Abstract
RNA-binding proteins control many aspects of cellular biology through binding single-stranded RNA binding motifs (RBM)1-3. However, RBMs can be buried within their local RNA structures4-7, thus inhibiting RNA-protein interactions. N6-methyladenosine (m6A), the most abundant and dynamic internal modification in eukaryotic messenger RNA8-19, can be selectively recognized by the YTHDF2 protein to affect the stability of cytoplasmic mRNAs15, but how m6A achieves wide-ranging physiological significance needs further exploration. Here we show that m6A controls the RNA-structure-dependent accessibility of RBMs to affect RNA-protein interactions for biological regulation; we term this mechanism “m6A-switch”. We found that m6A alters the local structure in mRNA and long non-coding RNA (lncRNA) to facilitate binding of heterogeneous nuclear ribonucleoprotein C (hnRNP C), an abundant nuclear RNA-binding protein responsible for pre-mRNA processing20-24. Combining PAR-CLIP and m6A/MeRIP approaches enabled us to identify 39,060 m6A-switches among hnRNP C binding sites; and global m6A reduction decreased hnRNP C binding at 2,798 high confidence m6A-switches. We determined that these m6A-switch-regulated hnRNP C binding activities affect the abundance as well as alternative splicing of target mRNAs, demonstrating the regulatory role of m6A-switches on gene expression and RNA maturation. Our results illustrate how RNA-binding proteins gain regulated access to their RBMs through m6A-dependent RNA structural remodeling, and provide a new direction for investigating RNA-modification-coded cellular biology.
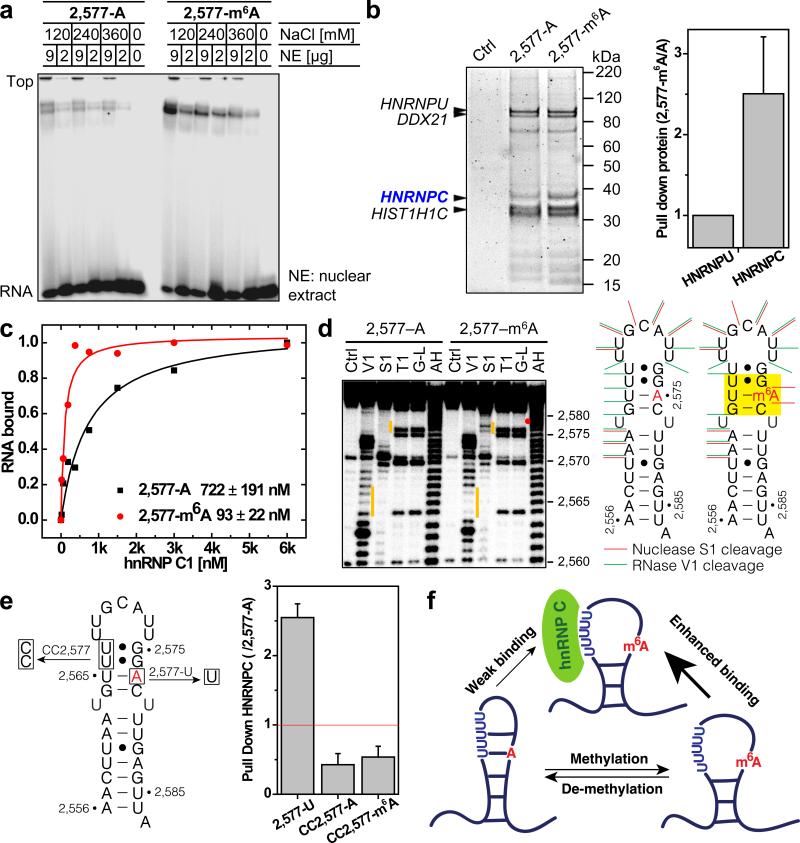
Post-transcriptional m6A RNA modification is indispensable for cell viability and development, yet its functional mechanisms are still poorly understood8-19. We recently identified one m6A site in a hairpin-stem on the human lncRNA MALAT1 (Metastasis Associated Lung Adenocarcinoma Transcript)25 (Extended Data Fig. 1a). Native gel shift assay indicated that this m6A residue increases the interaction of this RNA hairpin with proteins in the HeLa nuclear extract (Fig. 1a). RNA pull down assays identified heterogeneous nuclear ribonucleoprotein C1/C2 (hnRNP C) as the protein component of the nuclear extract that binds more strongly with the m6A-modified hairpin (Fig. 1b and Extended Data Fig. 1b, c). Stronger binding of the methylated hairpin was validated qualitatively by UV crosslinking and quantitatively (~8-fold increase) by filter-binding using recombinant hnRNP C1 protein (Fig. 1c and Extended Data Fig. 1d).
Figure 1. m6A alters RNA structure to enhance hnRNP C binding.
a, m6A increases binding with nuclear proteins. b, RNA pull down showing hnRNP C preferably binds methylated RNA. n = 4, ± s.d., biological replicates. c, Filter binding showing m6A increases hnRNP C1 binding with respective apparent dissociation constant (Kd) indicated at lower right; n = 3, ± s.d., technical replicates. d, RNA structural probing showing m6A disrupts local RNA structure highlighted in yellow. Ctrl, no nuclease added; V1, RNase V1 digestion; S1, nuclease S1 digestion; T1, RNase T1 digestion; G-L, G-ladder; AH, alkaline hydrolysis. The orange bars mark the structurally altered RNA regions in the presence of m6A (red dot). e, RNA pull down with mutated oligos. n = 3, ± s.d., technical replicates. f, Illustration of the m6A-switch model.
The hnRNP C protein belongs to the large family of ubiquitously expressed heterogeneous nuclear ribonucleoproteins which bind nascent RNA transcripts to affect premRNA stability, splicing, export and translation20-24. hnRNP C preferably binds single-stranded U-tracts (5 or more contiguous uridines)20,23-24,26-27. In the MALAT1 hairpin, hnRNP C binds a U5-tract which is half buried in the hairpin-stem opposing the A/m6A2,577 site (Extended Data Fig. 1a, e).
Since m6A residues within RNA stems can destabilize the thermo-stability of model RNA duplexes28, we hypothesized that the m6A2,577 residue destabilizes this MALAT1 hairpin-stem to make its opposing U-tract more single-stranded or accessible, thus enhancing its interaction with hnRNP C. We performed several experiments to validate this hypothesis. First, according to the RNA structural probing assays, the m6A-modified hairpin showed significantly increased nuclease S1 digestion (single-stranded specific) at the GAC (A= m6A) motif as well as markedly decreased RNase V1 digestion (double-stranded/stacking specific) at the U-tract opposing the GAC motif (Fig. 1d). The m6A residue markedly destabilized the stacking properties of the region centered around the U-residue that pairs with A/m6A2,577 (Extended data Fig. 1f-g), which was also supported by the increased reactivity between CMCT and the U-tract bases in the presence of m6A (Extended Data Fig. 1h). Second, the A2,577-to-U mutation increased hnRNP C pull down amount from nuclear extract, whereas U-to-C mutations in the U-tract significantly reduced hnRNP C pull down amount regardless of m6A modification (Fig. 1e). Third, the A2,577-to-U mutation increased the accessibility of U-tract and enhanced hnRNP C binding by ~4-fold (Extended data Fig. 2a-c). Binding results with 4 other mutated A/m6A oligos also supported the U-tract with increased accessibility alone being sufficient to enhance hnRNP C binding (Extended data Fig. 2d). Fourth, RNA terminal truncation followed by hnRNP C binding identified two pairs of truncated hairpins with highly accessible U-tracts, which improved hnRNP C binding significantly but independent of the m6A modification (Extended data Fig. 2ei). All these results confirmed that m6A modification can alter its local RNA structure and enhance the accessibility of its base-paired residues or nearby regions to modulate protein binding (Fig. 1f). We term this mechanism that regulates RNA-protein interactions through m6A-dependent RNA structural remodeling as “m6A-switch”.
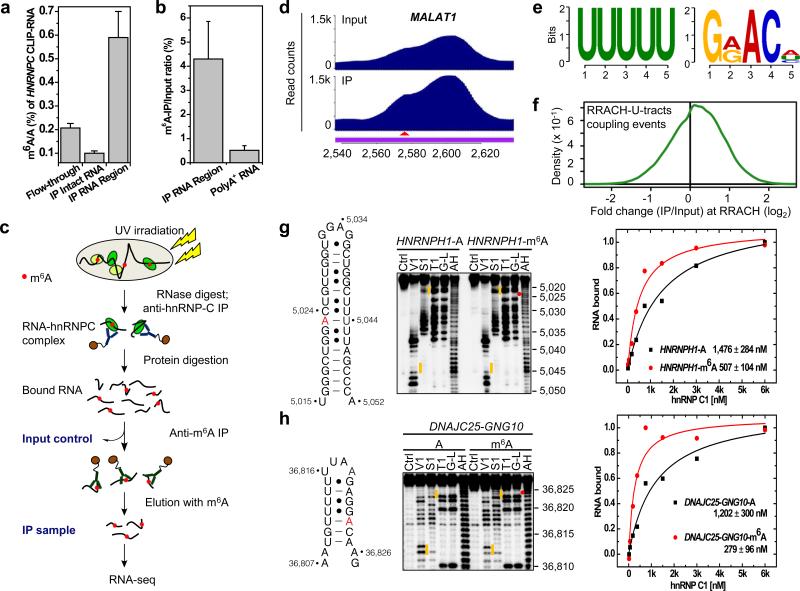
We performed two experiments to determine the global effect of m6A-switches on hnRNP C binding. First, in vivo cross-linking followed by immunoprecipitation and two-dimensional thin-layer chromatography (CLIP-2dTLC) showed that the m6A/A ratio of the hnRNP C bound RNA regions had ~6-fold higher m6A level than the hnRNP C bound intact RNA, and ~3-fold higher m6A level than the flow through RNA (Fig. 2a and Extended Data Fig. 3a). Second, the hnRNP C bound RNA regions had much higher anti-m6A pull down yield (4.3%) than the polyA+ RNA samples (0.5%) using the previously established m6A antibody13,14 (Fig. 2b). These results indicate widespread presence of m6A residues in the vicinity of hnRNP C binding sites.
Figure 2. PARCLIP-MeRIP identifies m6A-switches transcriptome-wide.
a, CLIP-2dTLC showing the m6A enrichment in hnRNP C bound RNA regions. n = 3, ± s.d., biological replicates. b, hnRNP C bound RNA regions had higher anti-m6A pull down yield than polyA+ RNA. n = 3, ± s.d., biological replicates. c, Illustration of the PARCLIP-MeRIP protocol. IP, immunoprecipitation. d, PARCLIP-MeRIP identified m6A residue around the MALAT1 2,577 site. e, Binding motifs identified by FIRE with PARCLIP-MeRIP peaks. f, Density plot showing the positive enrichment at RRACH sites. g-h, Validation of two m6A-switches by S1/V1 structural probing and filter binding. n = 4, ± s.d., technical replicates. Same annotation as in Fig. 1c, d.
To map the m6A sites around hnRNP C binding sites, we performed Photoactivatable-Ribonucleoside-Enhanced Crosslinking and Immunoprecipitation (PAR-CLIP)29 to isolate all hnRNP C bound RNA regions (Input control) followed by anti-m6A immunoprecipitation (MeRIP)13,14 to enrich m6A-containing hnRNP C bound RNA regions (IP). Both the Input control and IP samples from two biological replicates were sent for RNA-seq (Fig. 2c and Extended data Fig. 3b, c). This approach, termed PARCLIP-MeRIP, identified transcriptome-wide the m6A proximal hnRNP C binding site, such as the enriched peak around the MALAT1-2,577 site (Fig. 2d). Remarkably, hnRNP C PARCLIP-MeRIP peaks harbored two consensus motifs, the hnRNP C RBM (U-tracts) and the m6A consensus motif GRACH (a subset of RRACH13,14) (Fig. 2e). Both motifs were located mostly within 50 residues, suggesting transcriptome-wide RRACH-U-tract coupling events within the hnRNP C binding sites (Extended Data Fig. 4a, b). About 62% of all RRACH-U-tracts coupling events within hnRNP C binding sites are enriched at the RRACH motif (Fig. 2f). Our PARCLIP-MeRIP approach identified a total of 39,060 hnRNP C m6A-switches which corresponded to m6A-modified RRACH-U-tracts coupling events at FDR ≤ 5% (Extended Data Fig. 4c). These switches account for ~7% of 592,477 hnRNP C binding sites identified by PAR-CLIP. The majority (87%) of m6A-switches occur within introns (Extended Data Fig. 4d, e), consistent with the literature that hnRNP C is nuclear localized and primarily binds nascent transcripts20,23. We validated two intronic m6A-switches in hairpin structures where m6A residues increase the U-tract accessibility, and enhance hnRNP C binding by ~3-4 fold (Fig. 2g, h and Extended data Fig. 5).
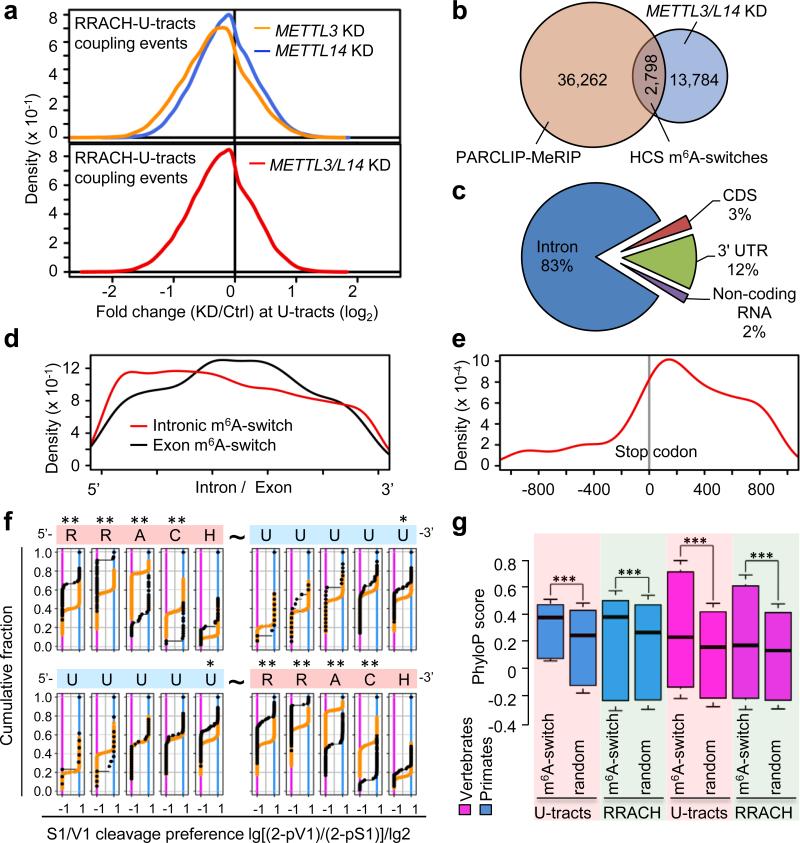
To assess the effect of global m6A reduction on RNA-hnRNP C interactions, we performed hnRNP C PAR-CLIP experiments in METTL3 and METTL14 knockdown (KD) cells (Extended Data Fig. 6a). We identified 16,582 coupling events with decreased U-tracts-hnRNP C interactions upon METTL3 KD and METTL14 KD (METTL3/L14 KD) with significant overlaps at FDR ≤5% (Fig. 3a and Extended Data Fig. 6b, c). In total, 2,798 m6A-switches identified by PARCLIP-MeRIP experiments showed decreased hnRNP C binding upon METTL3/L14 KD (Fig. 3b) and this number is likely under-estimated due to the fact that METTL3/L14 KD reduces the global m6A level by only ~30-40% 11,12. These sites composed the high confidence m6A-switches (HCS) that were used for subsequent analysis.
Figure 3. Global m6A reduction decreases hnRNP C binding at m6A-switches.
a, Density plot showing negative enrichment at the U-tracts. b, Identification of HCS m6A-switches. c, Region distribution of HCS m6A-switches. d, Density plot showing m6A-switches distribution relative to exon/intron boundaries. e, m6A-switches in coding RNA were enriched in the 3’UTR and near the stop codon. f, Cumulative distribution of HCS m6A-switches (black) and control (orange) regarding the S1/V1 cleavage preference (data from4) at U-tracts and RRACH motif. U-tract can be 3’ (upper) or 5’ (lower) of the RRACH motif. *: p < 0.05, **: p < 10−4, Kolmogorov-Smirnov test. g, Phylogenetic conservation of HCS m6A-switches among primates and vertebrates. ***: p < 10−16, Mann-Whitney-Wilcoxon test.
HCS m6A-switches are enriched in the introns of coding and non-coding RNAs (Fig. 3c and Extended Data Fig. 6d). Exonic m6A-switches are enriched at the middle of exons while intronic m6A-switches are slightly enriched near the 5′ end (Fig. 3d). m6A-switches within coding RNAs tend to locate at very long exons (Extended Data Fig. 6e) and are enriched near the stop codon and in the 3′UTR (Fig. 3e), consistent with the known topology of human m6A methylome in mRNAs13,14. Transcriptome-wide RNA structural mapping4-7 on HCS m6A-switches yielded consistent structural patterns with our three demonstrated m6A-switch hairpins (Fig. 3f). The “RR” residues in the RRACH motif and the 3’ U-tract residues show increased structural dynamics in the presence of m6A. Besides, m6A-switches prefer short RRACH-U-tract inter-motif distances, are not involved in the previously reported inter-U-tract motif patterns and are conserved across species (Fig. 3g and Extended Data Fig. 6f-i).
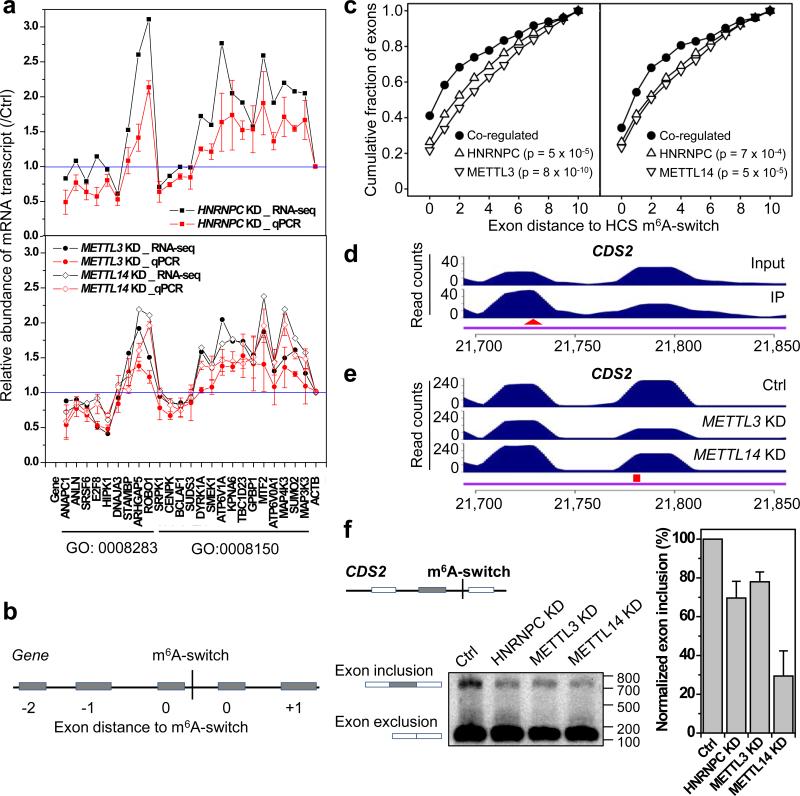
To reveal the function of m6A-switches on RNA biology, we performed polyA+ RNA-seq from HNRNPC, METTL3, METTL14 KD and control cells (Extended Data Fig. 7a). METTL3/L14 KD, which has been shown to decrease hnRNP C binding transcriptome-wide, co-regulated the expression of 5,251 genes with HNRNPC KD. In comparison, METTL3/L14 KD co-regulated only 24 genes with KD of another mRNA binding protein hnRNP U (Extended Data Fig. 7b), which was not enriched in our m6A-hairpin pull down (Fig. 1b). Approximately 45% of 1,815 HCS m6A-switch-containing genes were co-regulated by HNRNPC, METTL3/L14 KD, indicating that m6A-switch-regulated hnRNP C binding affects the abundance of target mRNAs. Gene Ontology (GO) analysis suggests that m6A-switch-regulated gene expression may influence “cell proliferation” and other biological processes (Extended data Fig. 7c). The m6A-switch-regulated expression of genes within these GO categories was validated by qPCR (Fig. 4a and Extended Data Fig. 7d-g). We also found that HNRNPC, METTL3 and METTL14 KD decreased cell proliferation rate to similar extents (Extended Data Fig. 7h).
Figure 4. m6A-switches regulate mRNA abundance and alternative splicing.
a, HNRNPC, METTL3/L14 KD co-regulated the abundance of m6A-switch-containing transcripts by RNA-seq and qPCR. b, Illustration of the relative exon distance to m6A-switches. c, Co-regulated exons by HNRNPC KD and METTL3 KD (left) and METTL14 KD (right) were more enriched around m6A-switch sites than non-co-regulated exons, Kolmogorov-Smirnov test. d-f, Validation of the m6A-switch regulated splicing at one exon neighboring the CDS2 m6A-switch as shown in PARCLIP-MeRIP data (d), METTL3/L14 KD data (e), and RT-PCR results (f). The red triangle and square mark the m6A site and U-tract, respectively. n = 4, ± s.d., biological replicates.
Besides the mRNA abundance level changes, we also observed splicing pattern changes within HCS m6A-switch-containing transcripts by DEXSeq30. HNRNPC KD co-up/down-regulated 131/127 exons with METTL3 KD and 130/115 exons with METTL14 KD. These co-regulated exons occur more frequently in the vicinity of m6A-switches than those non-co-regulated exons (Fig. 4b, c), indicating that m6A-switches tend to regulate splicing events at nearby exons. We investigated the splicing pattern at two exons with neighboring m6A-switches: the PARCLIP-MeRIP and METTL3/L14 KD data confirmed the hnRNP C binding signature at the m6A-switch site neighboring these exons; and HNRNPC, METTL3/L14 KD co-inhibited exon inclusion in both cases (Fig. 4d-f and Extended Data Fig. 8b-f). Besides, we identified 155 genes with multiple m6A-switches exhibiting more than two splice variants, and 221 m6A-switch-containing genes with differentially expressed splice variants in HNRNPC and METTL3/L14 KD samples. Further analysis suggested m6A-switches’ effect on intron exclusion (Extended Data Fig. 8g). Consistent with previous reports about the splicing regulation by both hnRNP C and m6A13,19,20,23, our results indicate that m6A functions as RNA structure remodeler to affect mRNA maturation through interfering with post-transcriptional regulator binding activities.
In summary, we demonstrated that post-transcriptional m6A modifications could modulate the structure of coding and non-coding RNAs to regulate RNA-hnRNP C interactions, thus influencing gene expression and maturation in the nucleus. It is possible that m6A could also recruit additional accessory factors, such as the YTH domain proteins that can directly recognize m6A as previously reported15, to destabilize the RNA structure and facilitate hnRNP C binding. Besides hnRNP C, m6A-switches may regulate the function of many other RNA-binding proteins through modulating the RNA-structure-dependent accessibility of their RBMs. Our work indicates widespread m6A-induced mRNA and lncRNA structural remodeling that affect RNA-protein interactions for biological regulation.
Methods
Mammalian cell culture, siRNA knockdown and Western blot
Human cervical cancer cell line HeLa (CCL-2) and embryonic kidney cell line HEK293T (CRL-11268) were obtained from American Type Culture Collection (ATCC) and were cultured under standard conditions. Control siRNA (1027281, Qiagen), METTL3 siRNA (SI04317096, Qiagen), METTL14 siRNA (SI04317096, Qiagen) or HNRNPC siRNA (10620318, Invitrogen) were transfected into HEK293T cells at a concentration of 40 nM using lipofectamine RNAiMAX (Invitrogen) according to the manufacturer's instructions. Cells were collected 48 hours after the transfection, shock-frozen in liquid nitrogen, and stored at -80 °C for further studies. Western blot analysis using METTL3- (HPA038002, Sigma), METTL14- (HPA038002, Sigma), hnRNP C- (sc-32308, Santa Cruz), GAPDH- (A00192-40, Genescript) specific antibodies was performed under standard procedures. Blotting membranes were stained by ECL-prime (RPN2232, GE Healthcare) and visualized by a digital imaging system (G: BOX, SYNGENE). All synthetic oligos were synthesized by Q.D.
Gel shift, RNA pull down and filter binding assay
HeLa nuclear extracts were isolated using the NE-PER Nuclear and Cytoplasmic Extraction Reagents (78833, Thermo Scientific) according to the manufacturer's instructions. The purified radioactively-labeled RNA oligos were refolded by heating at 90 °C for 1 min, then 30 °C for 5 min. 3 μl HeLa nuclear extract and 6 μl refolded RNA were incubated at room temperature (RT) for 30 min and then at 4 °C for 2 hrs. Each sample was mixed with 1 μl 50% glycerol, separated on the 8% native 1x TBE gel, and visualized by phosphorimaging using the Personal Molecular Imager (Bio-Rad).
The in vitro pull down assay was performed as described13. The eluted protein samples were separated on 4-12% polyacrylamide Bis-Tris gels (NP0321BOX, Invitrogen) and stained with SYPRO-Ruby (S12000, Invitrogen) according to the manufacturer's instructions. Protein in gel slices or the entire pulled down protein samples were digested with trypsin and identified using LC-MS/MS by the Donald Danforth Plant Science Center (Washington University, St. Louis. MO). The RNA oligos used in Fig. 1f: 2,577-U: 5’-AACUUAAUGUUUUUGCAUUGGUCUUUGAGUUA-Biotin; CC-2,577-A: 5’-AACUUAAUGUCCUUGCAUUGGACUUUGAGUUA-Biotin; CC-2,577-m6A: 5’-AACUUAAUGUCCUUGCAUUGGm6ACUUUGAGUUA-Biotin.
The full-length hnRNP C1 protein were purified and in vitro UV crosslinking assay were performed as previously described23. Filter-binding assays were performed as previously described24.
CLIP-2dTLC
HEK293T cells at 70-80% confluency were UV irradiated with 400 mJ/cm2 at 254 nm, and harvested by centrifuging at 4,000 rpm for 3 min at 4 °C (with centrifugation rotor #75003524, Fisher scientific). The pellet of cross-linked cells were resuspended in 1 ml lysis buffer (1x PBS, 0.1% SDS, 1% Nonidet P-40, 0.5% Sodium Deoxycholate, protease inhibitor cocktail and RNase inhibitor) and incubated on ice for 4 hrs. Cell lysate was isolated by centrifuging at 3,000 rpm for 5 min and pre-blocked with 50 μl protein A beads in 300 μl lysis buffer. Another 50 μl protein A beads (Invitrogen) were incubated with 8 μg corresponding antibodies for 4 h at room temperature, and then mixed with the pre-blocked cell lysate at 4 °C overnight. The beads were washed 3 times with 1 ml wash buffer (20 mM Tris-HCl pH 7.4, 10 mM MgCl2, 0.2% Tween-20), 3 times with 1 ml high salt buffer (5x PBS, 0.1% SDS, 1% Nonidet P-40, 0.5% Sodium Deoxycholate), and 3 times with 1 ml wash buffer. The beads were resuspended in 1 ml wash buffer, and divided into 2x 500 μl in two separate tubes. One tube was incubated with 200 μl RNase T1/A mixture at room temperature for 1 h. The other tube was incubated with 200 μl nuclease-free water at room temperature for 1 h. The beads were washed 3 times with 1 ml high salt buffer, and 3 times with 1 ml wash buffer. Crosslinked RNA was eluted from beads by incubating with 200 μl RNA elution buffer (100 mM Tris-HCl pH 7.4, 10 mM EDTA, 1% SDS) containing 2 mg/ml proteinase K at 50 °C for 30 min followed by phenol/chloroform extraction. The RNA pellet was dissolved in 7 μl nuclease-free water containing 1 μl RNase T1 (200 U), heated at 65 °C for 2 min, and incubated at 37 °C for 30 min. The T1-digested RNA fragments were labeled upon adding 2 μl T4 PNK mix (4.5 U/μl T4 PNK, 600 Ci/mmol [γ-32P] ATP, 5x PNK buffer) and incubation at 37 °C for 30 min. Unreacted [γ-32P] ATP was removed using Illustra MicroSpin G-25 columns. The eluted RNA was digested with 1 μl (1U/ μl) nuclease P1 at 37 °C for 1 h. Samples were spotted on cellulose TLC plate and 2D TLC was run as described25 using isobutyric acid: 0.5 M NH4OH (5:3, v/v) as the first dimension and isopropanol:HCl:water (70:15:15, v/v/v) as the second dimension.
RNA structural probing and RNA terminal truncation
The synthetic RNA oligos were 5′ end-labeled with γ-32P-ATP by T4 PNK (70031, Affymetrix), gel purified, and re-folded. Structural probing assay with RNase T1, nuclease S1 and RNase V1 was performed as previously described25. Note: 3′-end-labeled HNRNPH1 oligos were used for RNA structural probing assay in Fig. 2g.
CMCT RNA structural probing assay was performed as reported32. RNA refolding: 3 pmole RNA was annealed in 50 mM potassium borate (pH 8) by heating at 90 °C for 1.5 min then incubation at RT for 3 min.
RNA terminal truncation assay was carried out as previously reported33. RNA samples were first alkaline-hydrolyzed as in the RNA structural probing assay, and then incubated with hnRNP C1 protein in the same conditions as in the filter binding assay. The RNA-Protein complexes were then loaded onto filter papers and washed twice with chilled binding buffer. Air dry filters and RNA samples were then extracted from the filters and loaded onto denaturing gel as in the RNA structural probing assay.
PARCLIP and PARCLIP-MeRIP
PAR-CLIP procedures were performed as previously reported29 with the following modification. HEK293T cells in 15 cm plates treated following normal PAR-CLIP procedures were lysed and digested with a combination of RNase I (Ambion, AM2295, 15 μl 1/50 diluted with H2O) and Turbo DNases (2 μl) for 3 mins at 37 °C, shaking at 1,100 rpm. The lysate was then immediately cleared by spinning at 14,000 rpm, 4 °C for 30 min, and placed on ice for further use. hnRNP C binding sites were identified by PARalyzer v1.134 with default settings.
PARCLIP-MeRIP experiment applied m6A-antibody immunoprecipitation13,14,35 to the hnRNP C PAR-CLIP RNA samples. The hnRNP C PAR-CLIP RNA sample was incubated with m6A-specific antibody (202003, SYSY), RNase inhibitor (80 units, Sigma-Aldrich), human placental RNase inhibitor (NEB) in 200 μl 1x IP buffer (50 mM Tris-HCl pH 7.4, 750 mM NaCl and 0.5% (vol/vol) Igepal CA-630) at 4 °C for 2 hours under gentle shaking conditions. For each PARCLIP-MeRIP experiment, 20 μl protein-A beads (Invitrogen) were washed twice with 1 ml 1x IP buffer, blocked with 2 hours incubation with 100 μl 1× IP buffer supplemented with BSA (0.5 mg/ml), RNasin and Human placental RNase inhibitor, and then washed twice with 100 μl 1x IP buffer. The pre-blocked protein-A beads were then combined with the prepared immuno-reaction mixture and incubated at 4 °C for 2 hours, followed by three washes with 100 μl 1× IP buffer. After that, the RNA was eluted by 1 hour incubation with 20 μl elution buffer (1× IP buffer and 6.7 mM m6A, Sigma-Aldrich) under gentle shaking conditions, and purified by ethanol precipitation. The purified RNA sample (IP) as well as the input PAR-CLIP RNA sample (Input control) were used for library construction by Truseq small RNA sample preparation kit (Illumina).
Libraries were prepared using TruSeq Small RNA Sample Preparation Kit (RS-200-0012, Illumina) according to the manufacturer's instructions, and then sequenced by Illumina Hiseq2000 with single end 50-bp read length. The control and IP samples from PARCLIP MeRIP experiments (same case for the control and KD samples from METTL KD experiments) were sequenced together in one flowcell on two lanes, and the reads from two lanes of each sample were combined for remaining analysis. The raw seq data was trimmed using the Trimmomatic computer program version 0.3036 to remove adaptor sequences, and mapped to the Human genome version hg19 by Bowtie 1.0.037 without any gaps and allowed for at most two mismatches.
Detection of PARCLIP-MeRIP peaks and differential PAR-CLIP peaks
The raw read counts of the biological replicates confirmed the reproducibility between replicates (Extended Data Fig. 9), and replicates were combined for subsequent analysis. For each genomic site, we calculated the average read counts within an 11-nt window centered at that site, as the normalized read counts for that site. This normalization smoothed the raw mapping curves, and facilitated identification of peaks within each mapping cluster. To correct for changes in sequencing depth or expression levels between samples, we then normalized the read counts at each genomic site to the total number of read counts on the respective gene. The above defined double-normalization procedures enabled precise identification of changes in the mapping reads at specific genomic locations by directly comparing the normalized read counts between samples. No read counts in the intergenic region were compared between samples, because the transcription boundaries are not defined at this region and the intergenic read counts cannot be normalized to correct changes for transcript expression.
Detection of PARCLIP-MeRIP peaks involves comparing the read counts of the IP sample with that of the control (Ctrl) sample as follows: (i) we identified all peaks within hnRNP C binding sites in the IP sample; (ii) we performed transcriptome-wide scanning to compare read counts of each identified peak in (i) with read counts at same genomic locations in the Ctrl sample to calculate the fold change score, score = log2 (HIP/HCtrl). The score threshold was set to be 1, corresponding to a twofold increase compared with control.
Detection of decreased hnRNP C binding sites involved comparing hnRNP C occupancies in the METTL KD (KD) sample with that in control as follows: (i) we identified all peaks within hnRNP C binding sites in the METTL KD sample; (ii) we performed transcriptome-wide scanning to compare read counts of each identified peak in (i) with read counts at the same genomic locations in control to calculate the fold change score, score = log2 (HKD/HCtrl). The score threshold was set to be -1, corresponding to a twofold decrease compared with control.
Identification of enriched motifs and hnRNP C m6A-switches
To identify enriched motifs, we first sorted the 12,998 hnRNP C PARCLIP-MeRIP peaks (with IP/Input enrichment ≥ 2) by the T-to-C mutation frequency. We then chose the top 4,500 peaks with the highest T-to-C mutation frequency for motif analysis using FIRE38 with default RNA analysis parameters. The top two enriched motifs are the GRACH and the U-tract motif. We also used the top 1,024 and 2,048 peaks for motif analysis, yielding the same motif results as the top 4,500 peaks.
To identify transcriptome-wide hnRNP C m6A-switches, we first searched for all coupling events within 50 nucleotides between U5 and RRACH motif, with the U5 motif located within hnRNP C binding sites. For PARCLIP-MeRIP samples, the fold change score E at the RRACH motif was calculated for each coupling event. Also, p-value for each coupling event was calculated as described39. Then, we generated the π-value, π=E·(-log10 P), as one comprehensive parameter to pick meaningful genomic loci40. hnRNP C m6A-switches identified from PARCLIP-MeRIP experiments should fulfill the following requirements: (i) read counts at both the control and IP sample ≥ 5; (ii) π-value ≥ 0.627, corresponding to FDR ≤ 5%.
For METTL KD samples, the fold change score at the U-tracts motif was calculated for each coupling event. hnRNP C m6A-switches identified from METTL3/L14 KD samples should fulfill the following requirements: (i) read counts at both the control and KD sample ≥ 5; (ii) π-value ≤ 0.627, corresponding to FDR ≤ 5%.
Distribution of hnRNP C m6A-switches
Pie charts illustrating distribution within each segment were made using the following hierarchy: intron > ncRNA > 3′UTR > 5′UTR > CDS > intergenic. To plot the distribution of hnRNP C m6A-switches in their respective localized segments (such as intron, exon, 3′UTR, CDS, 5′UTR), we first identified the distance between each m6A-switch and the 5′ end of the respective segment. This distance was then divided by the length of that segment to determine a percentile where this m6A-switch fell, and then this specific percentile bin was incremented. Following this approach, we obtained the distribution pattern of all m6A-switches within each segment.
RNA-seq
RNA-seq experiments were performed on two replicate RNA samples from HNRNPC, METTL3, METTL14 KD as well as control HEK293T cells (48 hours after transfection). Total RNA samples were extracted according to RNeasy plus kit (Catalog # 74104, Qiagen). Libraries were prepared according to the TruSeq Stranded mRNA LT Sample Prep Kit (Catalog # RS-122-9005DOC). KD and control samples were sequenced together in one flowcell on four lanes, respectively. All samples were sequenced by illumina Hiseq 2000 with pair end 100-bp read length. The reads from the four lanes of each sample were combined for all analysis. The RNA-seq data was mapped using the splice-aware alignment algorithm TopHat version 1.1.441 based on the following parameters: tophat –num-threads 8 –mate-inner-dist 200 –solexa quals –min-isoform-fraction 0 –coverage-search-segment-mismatches 1. Gene expression level changes were analyzed using cuffdiff42. Differential splicing was determined using DEXSeq30 based on Cufflinks-predicted, nonoverlapping exons. To compare with a different mRNA binding protein, the RNA-seq data from HNRNPU KD HEK293T cells (GEO34995 dataset43) was analyzed.
Gene Ontology, evolutionary conservation, graphic and statistical analysis
Gene Ontology (GO) enrichment analysis was applied on the co-regulated HCS-containing genes, against all HCS-containing genes as background, using GOrilla44.
Phylogenetic conservation analysis was performed by comparing PhyloP scores at the U-tracts motif and RRACH motif for hnRNP C m6A-switches to those of randomly selected sequences. The PhyloP scores were accessed from the precompiled phyloP scores45 (ftp://hgdownload.soe.ucsc.edu/goldenPath/hg19/phyloP46way/) under both primates and vertebrates categories. P-values were evaluated using the Mann-Whitney-Wilcoxon test, ***: p < 10 −16. For the U-tract motifs, we collected all U-tracts (5x U's) across all chromosomes and randomly selected 10,000 sites among the 38,561,577 sites of our census. The random selection was done separately for primates and for vertebrates. For the RRACH motif, we also collected all RRACH sites across all chromosomes and randomly selected 10,000 sites among the 78,815,225 sites of our census. Here too, the random selection was done separately for primates and vertebrates.
Sequence logos were generated using the WebLogo package. R statistical package was used for all statistical analysis (unless stated otherwise).
Cell proliferation analysis
HEK293T cells were transfected with si-control, si-HNRNPC, si-METTL3 and si-METTL14 RNAs. After transfection, the numbers of cells were counted at 0, 24, 48 and 72 hrs as described in46. Three independent experiments were performed and growth curves were plotted to test the effects on cell proliferation.
RT-PCR quantitation
Total RNA samples were extracted from HEK293T cells and reverse transcribed using SuperScript® III First-Strand Synthesis System (Life Technologies, #18080-051). In order to validate the splicing changes identified from our RNA-seq data, we performed RT-PCR measurements using Thermo Scientific™ Taq™ DNA Polymerase under the following conditions: 95 °C for 3 mins, 30 cycles of [95 °C for 30 s, 55 °C for 30 s, 72 °C for 1 min] and then finally 72 °C for 10 min. For the target alternate exon, we designed and used primers annealing to both neighboring constitutive exons. The PCR products were separated on 1.2% agarose gel and ethidium bromide stained. In order to validate the gene expression level changes identified from our RNA-seq data, we performed qRT-PCR measurements using Power SYBR® Green PCR Master Mix (Life Technology, # 4367659) under the following conditions: 50 °C for 3 mins followed by 95 °C for 10 mins, 40 cycles of [95 °C for 15 s, 60 °C for 1 min] and then 40 °C for 1 min and 95 °C for 15 s and finally 60 °C for 30 s.
The primer sequences are listed as below (Gene name: forward primer; reverse primer): ANAPC1: TGCCAAAAGAAATAGCAGTTCAG; TGCCAAAAGAAATAGCAGTTCAG; ANLN: GCCAGGCGAGAGAATCTTCA; GGCTGCTGGTTACTTGCTTC; SRSF6: ACAAGGAACGAACAAATGAGGG; GCTTCCAGAGTAAGATCGCCTAT; E2F8: ACCCAAGCTCAGCCATTGTA; GAGTCATAGTTGGTGGCCCT; HIPK1: CCAGTCAGCTTTGTACCCATC; TTGAAACGCAGGTGGACATA; DNAJA3: CCCTTTCATTTGTACTGCCTCC; TGATCTCTTTCTGGCTGGCA; STAMBP: GTTCTCATCCCCAAGCAAAG; ATCCAGCCCAGTGTGATGA; ARHGAP5: GCGGATTCCATTTGACCTCC; GCTGCCCTGGTGAAATGAAT; ROBO1: TTTGGGCTTCTGCGTAGTTT; GGAGGGTACTGGAGACAGCA; SRPK1: CCCTGAGAAGAGAGCCACTG; ACCCTGAAAAGGGAAGAGGA; CENPK: AAGGCTAAAAATTCACAAAGCA; TCCATATCTTTCCACATTTCTTCA; BCLAF1: TCCTGAAAGGTCTGGGTCTG; TCCTGAAAGGTCTGGGTCTG; SUDS3: TGCCTGGGGTTCTGTATTTC; CAGTTCAAGCGAGGGAAGTC; DYRK1A: CTTCAGCATGCAAACCTTCA; GGCAGAAACCTGTTGGTCAC; SMEK1: TTGAAGGACTGCACCACTTG; CCTGTGTTTTCGTGGTTGTG; ATP6V1A: AAGCATTTCCCCTCTGTCAA; CTGCCAGGTCTTCTTCTTCC; KPNA6: CCCTGTGTTGATCGAAATCC; GATCTGCTCAGGGGTTCCTC; TBC1D23: GGTGAATCTCCTAATGGCTCA; CGATCCACAGGAGTTGATGT; GPBP1: CGTCATTGAATTTTGAGAAGCA; TTAGGACGCCCAATAGCAGA; MTF2: GTCTGCATTTGGTTCCTGGT; CTGCAGGAAAGGCAACCTTA; ATP6V0A1: TCCGTGTCTGGTTCATCAAA; TCTGAGTGCAAACTGGATGG; MAP4K3: TCTTCATACCACAGGAAATGC; AACAGGTTTGTGTGGGGGTA; SUMO2: TTCTTTCATTTCCCCCTTCC; TATTTTTCCCCATCCCGTCT; MAP3K3: CAGTTCCTCTCCCCACTCTG; GACAGAGAGGTGCCTGCTTC; CDS2: CGATTTTCCCAGGATGACAG; GAAAGGGCCCTATTGAGGAC; YTHDF2: ACTTGAGTCCACAGGCAAGG; AAGCAGCTTCACCCAAAGAA.
Extended Data
Extended Data Figure 1. m6A increases the accessibility of U-tract to enhance hnRNP C binding.
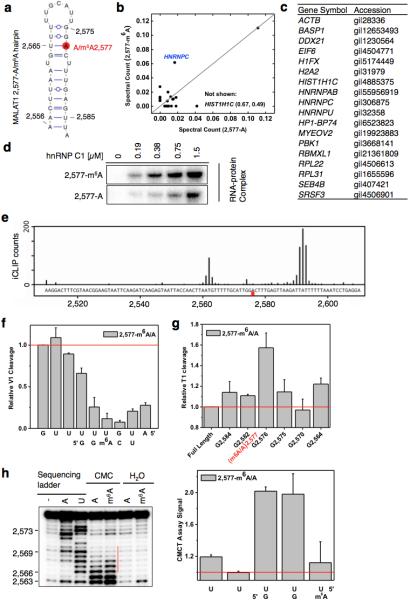
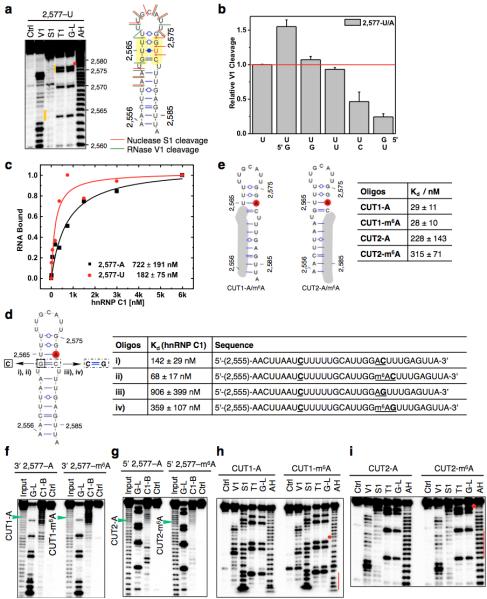
a, Secondary structure of the MALAT1 hairpin with m6A methylation at 2,577 site shown in red25. Nucleotide position numbers correspond to their locations along the human MALAT1 transcript (NR_002819). b, RNA pull down showing hnRNP C preferably binds methylated RNA. c, The list of proteins with identified peptides by mass spectrometry in b. d, Recombinant hnRNP C1 binds stronger with MALAT1 2,577-m6A hairpin compared to the unmethylated hairpin, as determined by in vitro UV crosslinking assay23. e, hnRNP C shows binding around A2,577 site along MALAT1 in vivo, as determined by previously published hnRNP C iCLIP data20. The underlying genomic sequence is shown at the bottom with a red square marking the m6A2,577 site. The slight shift of the iCLIP signal to upstream of the U-tract binding site is likely due to the steric hindrance of the peptide fragment remaining on RNA which can cause reverse transcription to terminate more than one nucleotide upstream of the cross-link site20. f, Quantification of the RNase V1 cleavage signal for the U-tract region from RNA structural mapping assay in Fig. 1e. To correct for sample loading difference, each band signal was normalized to the band signal of the immediate 3’ residue to the U-tract. n = 3, ± s.d., technical replicates. g, Quantitative of the RNase T1 cleavage signal from RNA structural mapping assay in Fig. 1e. Increased RNase T1 cleavage signal (single-stranded specific & cleavage after guanosines) was observed due to the surrounding m6A residue. To correct for sample loading difference, the ratio for each band signal among all bands in each lane was calculated. The y-axis value Relative T1 cleavage = (m6Anative/m6Adenature)/(Anative/Adenature). n = 2, technical replicates. h, Quantitative CMCT mapping showing increased signals for the U-tract bases around the U base-pairing with m6A. Quantitation of band signals within the U-tract region is shown on the right. n = 4, ± s.d., technical replicates.
Extended Data Figure 2. Increased accessibility of U-tracts enhances hnRNP C binding.
a, Structure probing of the 2,577A-to-U mutated MALAT1 hairpin (2,577-U), same annotation as in Fig. 1d. b, Quantification of the RNase V1 cleavage signal for the U-tract region from RNA structural mapping assays as in a. To correct for sample loading difference, each band signal was normalized to the band signal of the 3’ most U of the U-tract. n = 2, technical replicates. c, Filter-binding curves displaying the binding affinities between recombinant hnRNP C1 and 2,577-U/A oligos. n = 3, ± s.d., technical replicates. d, Filter-binding results showing the binding affinities between recombinant hnRNP C1 and four mutated MALAT1 oligos. (i) Mutate G-C to C-C, A2,577: predicted to weaken the hairpin stem and increase hnRNP C binding. Results: binding improved from 722 nM Kd to 142 nM (5-fold); (ii) Mutate G-C to C-C, m6A2,577: in this context of weaker stem, m6A is predicted to confer a smaller effect compared to wild-type hairpin. Result: improved binding only 2-fold instead of 8-fold; (iii) Restore C-C to C-G, A2,577: predicted to restore the hairpin stem and decrease hnRNP C binding compared to C-C mutant. Result: binding decreased by 6.4-fold; (iv) Restore C-C to C-G, m6A2,577: in this context of restored stem, m6A is again predicted to confer increased binding compared to A2,577 hairpin. Result: improved binding by 2.5-fold. n = 3 each, ± s.d., technical replicates. e, RNA alkaline hydrolysis terminal truncation assay showing recombinant hnRNP C1 binding to terminal truncated MALAT1 hairpin oligos (2,577 site m6A methylated or unmethylated). In this assay, 3′ radiolabeled MALAT1 2,577 hairpin oligos were terminal truncated by alkaline hydrolysis into RNA fragments which were then incubated with hnRNP C1 protein followed by filter binding wash steps. The remaining RNA on the filter paper was isolated and analyzed by denaturing gel electrophoresis, as indicated in the lane “C1-bound or C1-B”. “Input” refers to alkaline hydrolysis truncated RNA oligos used for incubation with hnRNP C1; “G-L or G-ladder” was generated from RNase T1 digestion; “Ctrl” refers to the intact MALAT1 hairpin without alkaline hydrolysis truncation. One pair of methylated/unmethylated truncated oligos (CUT1, marked by green arrows) was selected for subsequent biochemical analysis, due to their strong interaction with hnRNP C1. f, RNA terminal truncation assay as in e except 5′ 32P-labeled oligos were used. One pair of methylated/unmethylated truncated oligos (CUT2, marked by green arrows) was selected for subsequent biochemical analysis. g, Structure probing of the CUT1 oligos using RNase V1 and nuclease S1 digestion, same annotation as in Fig. 1e. The red dot marks the m6A site and the red line marks the U-tract region. h, Structure probing of the CUT2 oligos using RNase V1 and nuclease S1 digestion, same annotation as in g. i, Truncated oligos with exposed U-tracts increased hnRNP C binding regardless of m6A. n = 3, ± s.d., technical replicates.
Extended Data Figure 3. m6A is enriched in the vicinity of hnRNP C binding sites.
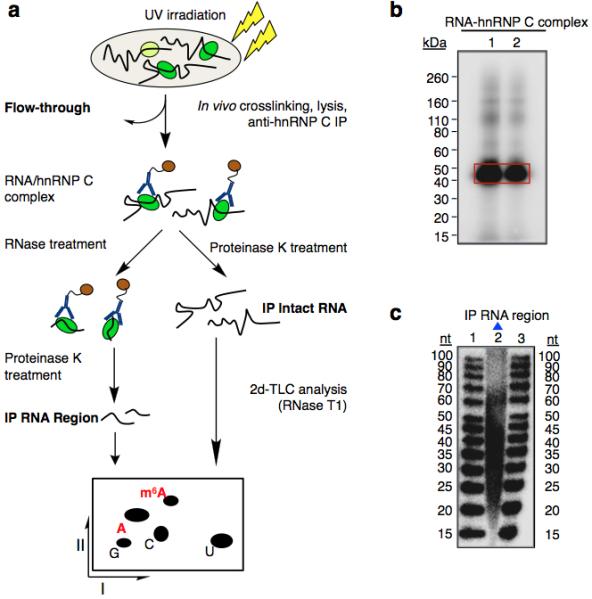
a, Schematic diagram of the CLIP-2dTLC protocol. IP, immunoprecipitation; nt, nucleotide. The RNase T1 used in our 2dTLC assay cleaves single-stranded RNA after guanosines, so the m6A/A ratio determined here represents the m6A fraction of all adenosines following guanosines. b, Analysis of crosslinked RNA-hnRNP C complexes (CLIP RNP) using denaturing gel electrophoresis (lanes 1 and 2). Positions of the protein size standards are shown on the left. hnRNP C IP RNA region (RNA samples within RNA-hnRNP C crosslinked complexes) were extracted from the gel slices marked by the red rectangle. c, Denaturing gel analyzing the size distribution for the hnRNP C PAR-CLIP RNA samples (lane 2). The RNA size standards were loaded in lanes 1 and 3.
Extended Data Figure 4. PARCLIP-MeRIP identifies transcriptome-wide m6A-switches in the vicinity of hnRNP C binding sites.
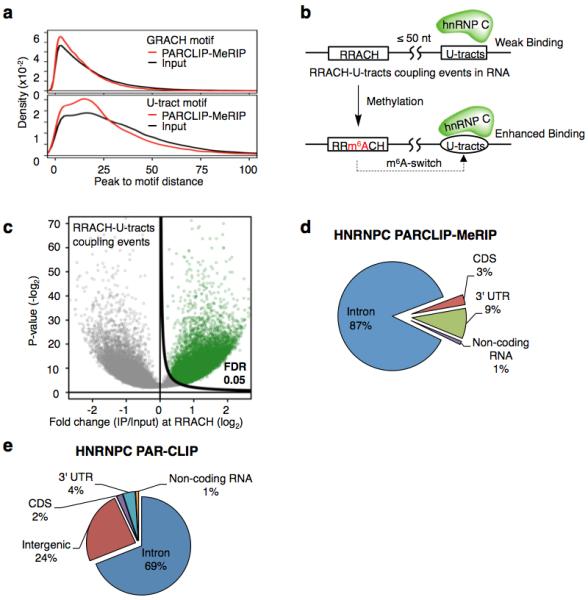
a, Density plots illustrating the distribution of distance between the PARCLIP-MeRIP/Input peaks and the nearest GRACH motif (top) or the nearest U-tracts in (bottom). b, Definition and identification of hnRNP C m6A-switches based on the PARCLIP-MeRIP analysis. Approximately 89% of PARCLIP-MeRIP peaks harboring both the U-tract and RRACH motif have “RRACH-U-tract” inter-motif distance within 50 nucleotides, significantly higher than the 64% of such coupling within the genomes. hnRNP C m6A-switches are identified as m6A methylated RRACH-U-tracts coupling events. c, Volcano plot depicting all coupling events (unfilled circles) as defined in b, according to their p-values37 (P, y-axis) and fold change values at RRACH sites (E, x-axis). To identify hnRNP C m6A-switches, we generated the π-value, π=E·(-log10P), as one comprehensive parameter to pick meaningful genomic loci38. hnRNP C m6A-switches identified from PARCLIP-MeRIP experiments should fulfill the following requirements: (i) read counts at both the control and IP sample ≥ 5; (ii) π-value ≥ 0.627, corresponding to False Discovery Rate (FDR) ≤ 5%. d, Pie chart depicting the region distribution of hnRNP C m6A-switches identified by PARCLIP-MeRIP. e, Pie chart depicting hnRNP C PAR-CLIP peaks. These are enriched in introns, consistent with previous reports that hnRNP C binds mainly nascent transcripts19,23,25.
Extended Data Figure 5. Validation of two identified m6A-switches.
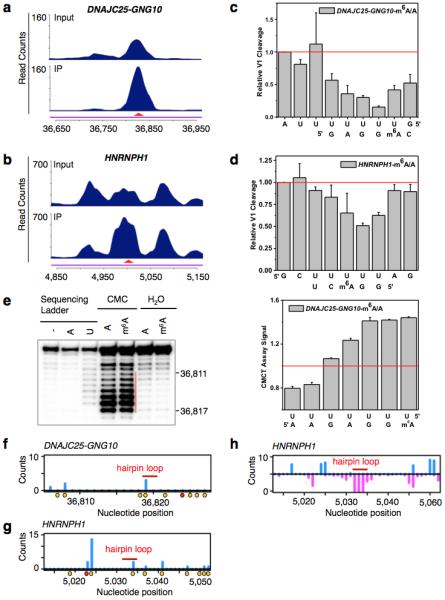
a-b, PARCLIP-MeRIP data detected positive IP/Input enrichment at the RRACH sites (red arrowheads) on the DNAJC25-GNG10 gene (a) and HNRNPH1 gene (b) in HEK293T cells. c-d, Quantification of RNase V1 cleavage signals around the U-tract region of m6A-switches on the DNAJC25-GNG10 (c) and HNRNPH1 (d) transcript, related to Fig. 2g-h. n = 3, ± s.d., technical replicates each. e, Quantitative CMCT mapping of DNAJC25-GNG10 m6A-switch shows increased band signals around the uridine base that pairs with m6A. The red vertical line marks the U-tract region. Quantitation of bands signal for the U-tract region is shown on the right. n = 3, ± s.d., technical replicates. HNRNPH1 m6A-switch hairpin is not suitable for CMCT probing, because its reverse transcription binding primer region is too short. f-g, In vivo DMS mapping of the DNAJC25-GNG10 hairpin (f) and HNRNPH1 (g); data are from7. A and C residues are marked with orange dots and the m6A residue is marked with a red dot. The hairpin loops are indicated by red bars. h, Transcriptome-wide S1/V1 mapping around the HNRNPH1 m6A-switch site. Blue bars represent V1 signal; magenta bars represent S1 signal. The hairpin loop is indicated by a red bar; data are from4. Not enough reads could be collected to make a plot for the DNAJC25-GNG10 m6A-switch region.
Extended Data Figure 6. Molecular features of HCS m6A-switches.
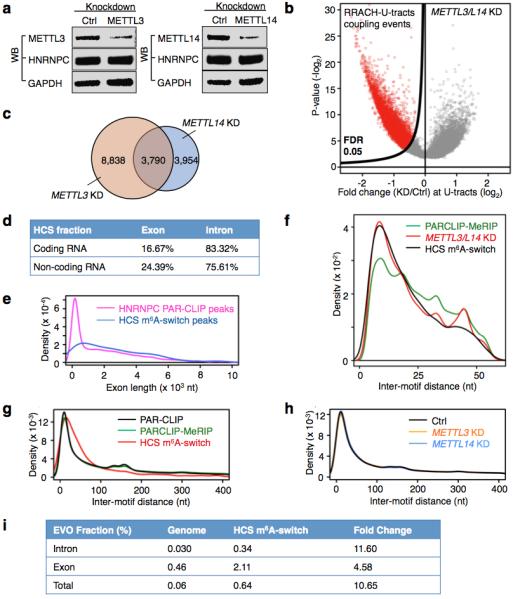
a, Western blot showing stable hnRNP C protein abundance upon METTL3/L14 KD. b, Volcano plot of the METTL3/L14 KD data depicting RRACH-U-tracts coupling events (unfilled red circles) as defined in Extended Data Fig. 4b, according to their p-values39 (P, y-axis) and fold change values at the U-tracts (E, x-axis). c, Overlap of RRACH-U-tract coupling events with decreased hnRNP C binding by METTL3 and METTL14 KD. d, The intron fraction of HCS m6A-switches in coding RNA and non-coding RNA. e, Density plot displaying the distribution of exonic m6A-switches/HNRNPC PAR-CLIP peaks according to exon length. f, Inter-motif (RRACH-U-tract) distance distributions suggest that m6A-switches have a preference for shorter distances between the RRACH and U-tract (> 5xU) motifs. The distribution curves are from PARCLIP-MeRIP data (green), METTL3/L14 KD (red) and HCS m6A-switches (black). g, Analysis of the inter-motif (U-tract-U-tract) distance patterns, previously identified by iCLIP20, in PARCLIP-MeRIP, METTL3/L14 KD and HCS m6A-switch data. The peaks at ~165 and ~300 nucleotides are clearly present. For the 2,798 high confident switches, we analyzed those in which the other U-tract motif is also in a PAR-CLIP-identified sequence; the long-range peaks seem to have shifted to longer distances (~220 and ~370 nucleotides). h, METTL3/L14 KD does not affect the inter-motif (U-tract-U-tract) distance distributions for U-tracts (≥5x U) in HEK293T cells. i, EVOfold analysis for the 2,798 HCS m6A-switches. The chances for HCS m6A-switches to have EVOfold records are significantly higher than random genomic sequences. We first calculated the number of HCS sites in the EVO database if occurring in random to be ~1.7 HCS sites. We found 18 HCS sites are present in EVO database, resulting in ~11x enrichment. This result is further divided into intronic and exonic regions.
Extended Data Figure 7. m6A-switches regulate the abundance of target mRNAs.
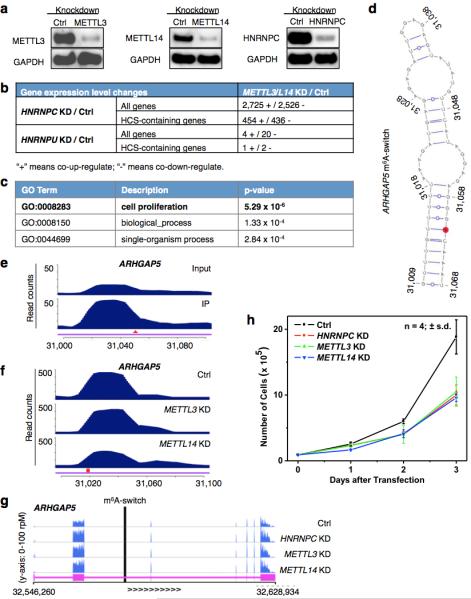
a, HNRNPC, METTL3/L14 KD confirmed by Western blots. b, HNRNPC KD and METTL3/L14 KD co-regulated the expression of a large number of genes. Gene expression changes between Ctrl and HNRNPC, HNRNPU, METTL3/L14 KD HEK293T cells were analyzed by Cuffdiff239,40, and the absolute numbers of differential expressed genes are shown. HCS-containing genes refer to the 1815 genes containing high confident m6A-switches. The RNA-seq data from HNRNPU KD HEK293T cells (GEO34995 dataset41) was analyzed for comparison with a different mRNA binding protein. HnRNPU did not show preferential interaction with the 2,577-m6A modified MALAT1 hairpin (Fig. 1b, 1c). c, Gene ontology analysis of the m6A-switch-containing genes whose expression level were co-differentially-regulated by HNRNPC and METTL3/L14 KD, against all m6A-switch-containing genes as background. d, An example of m6A-switch among co-regulated transcript is the ARHGAP5 transcript (NM_001030055). Its proposed secondary structure with m6A methylation site in red is shown with the opposing the U-tract in a stem. e-f, PARCLIP-MeRIP detected positive IP/Input enrichment at the RRACH site (red arrowhead) of the ARHGAP5 m6A-switch (e), while METTL3/L14 KD decreased hnRNP C binding at the U-tract (red square) of this m6A-switch (f). g, The expression level of ARHGAP5 gene was co-upregulated by HNRNPC, METTL3/L14 KD, as shown by the RNA-seq data from HEK293T cells. The vertical black line represents the m6A-switch site. h, HNRNPC, METTL3/L14 KD decreased the proliferation rates of HEK293T cells to a similar extent. n = 4, ± s.d., biological replicates.
Extended Data Figure 8. m6A-switches regulate alternative splicing of target mRNAs.
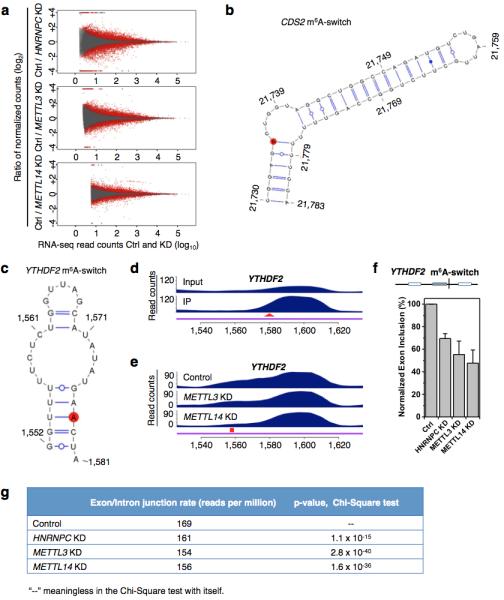
a, Fold changes (KD/Ctrl, log2) in normalized exon expression against RNA-seq reads detect the exons in HNRNPC KD, METTL3 KD, METTL14 KD and control samples. Statistically Significant Differentially Expressed Exons (SSDEE) called by DEXSeq are indicated in red. b, Proposed secondary structure of the CDS2 hairpin with the m6A methylation site shown in red, opposing the U-tract region. Nucleotide position numbers correspond to their locations along the human CDS2 transcript (NM_003818). c, Proposed secondary structure of the YTHDF2 hairpin with the m6A methylation site shown in red, opposing the U-tract region. Nucleotide position numbers correspond to their locations along the human YTHDF2 transcript (NM_001173128). de, PARCLIP-MeRIP detected a positive enrichment at the RRACH site (red arrowhead) (d), while METTL3/L14 KD decreased hnRNP C binding at the U-tract (red square) of this YTHDF2 m6A-switch (e). f, The inclusion level of one YTHDF2 exon is co-down-regulated by HNRNPC KD, METTL3 KD and METTL14 KD, as validated by RT-PCR. n = 3, ± s.d., biological replicates. g, We analyzed our polyA+ RNA-seq data to look for reads that span intron/exon junctions on CDS m6A-switch containing genes. We find that the control sample has significantly higher reads spanning intron/exon junctions than HNRNPC, METTL3/L14 KD samples. This result indicates that m6A depletion at the CDS m6A-switches promotes intron exclusion.
Extended Data Figure 9. Summary of the sequencing samples.
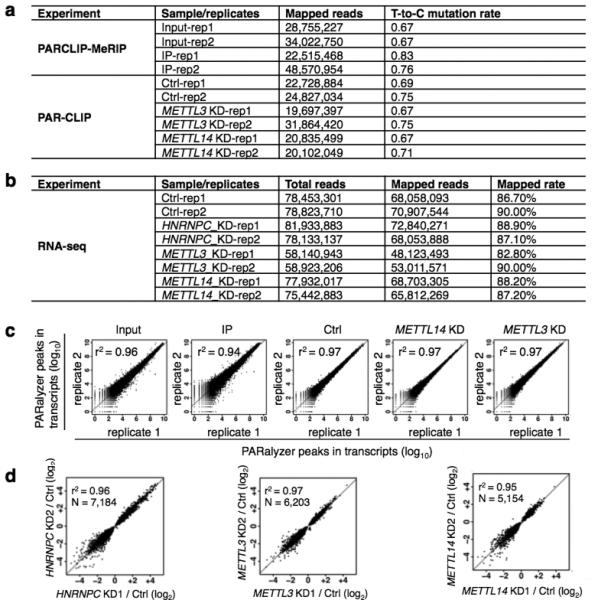
a, For PARCLIP-MeRIP and PAR-CLIP experiments from HEK293T cells, the number of mapped reads and “T-to-C” mutation rates are given for each replicate. b, For RNA-seq experiments from HEK293T cells, the number of total reads, the number of mapped reads as well as the mapping rates is given for each replicate. c, Scatter plots comparing transcripts for all PAR-CLIP replicate experiments. The square of Spearman's rank correlation value (r2) for each pair is shown in the upper left corner of the respective panel. d, The detected expression level changes show a strong correlation between gene KD replicates. Scatter plots comparing the fold changes (log2) in normalized gene expression from replicates of HNRNPC, METTL3 and METTL14 KD. The square of Spearman's rank correlation value (r2) for each pair is shown in the upper left corner of respective panels.
Acknowledgements
This work is supported by National Institutes of Health EUREKA GM088599 (C.H. and T.P.). We thank all members of the Pan and He laboratories for comments and discussions. We also thank Drs. Y.C. Leung, G. Perdrizet, Y. Pigli, J. Yue, J. Liu, Y. Yue, K. Chen and M. Yu for technical assistance. M.P. was a Natural Sciences and Engineering Research Council of Canada postdoctoral fellow.
Footnotes
Author contributions N.L., G.Z., M.P. designed and performed experiments, and analyzed data. Q.D. synthesized all RNA oligos. N.L., M.P. and T.P. conceived the project. N.L. and T.P. wrote the paper with input from C.H. and M.P.
Author Information All RNA sequencing data were deposited in the Gene Expression Omnibus (http://www.ncbi.nlm.nih.gov/geo) under accession number GSE56010.
The authors declare no competing financial interests.
References
- 1.Antson AA. Single-stranded-RNA binding proteins. Curr Opin Struct Biol. 2000;10:87–94. doi: 10.1016/s0959-440x(99)00054-8. [DOI] [PubMed] [Google Scholar]
- 2.Dreyfuss G, Kim VN, Kataoka N. Messenger-RNA-binding proteins and the messages they carry. Nat Rev Mol Cell Biol. 2002;3:195–205. doi: 10.1038/nrm760. [DOI] [PubMed] [Google Scholar]
- 3.Ray D, et al. A compendium of RNA-binding motifs for decoding gene regulation. Nature. 2013;499:172–177. doi: 10.1038/nature12311. [DOI] [PMC free article] [PubMed] [Google Scholar]
- 4.Wan Y, et al. Landscape and variation of RNA secondary structure across the human transcriptome. Nature. 2014;505:706–709. doi: 10.1038/nature12946. [DOI] [PMC free article] [PubMed] [Google Scholar]
- 5.Ding Y, et al. In vivo genome-wide profiling of RNA secondary structure reveals novel regulatory features. Nature. 2013;505:696–700. doi: 10.1038/nature12756. [DOI] [PubMed] [Google Scholar]
- 6.Kertesz M, et al. Genome-wide measurement of RNA secondary structure in yeast. Nature. 2010;467:103–107. doi: 10.1038/nature09322. [DOI] [PMC free article] [PubMed] [Google Scholar]
- 7.Rouskin S, Zubradt M, Washietl S, Kellis M, Weissman JS. Genome-wide probing of RNA structure reveals active unfolding of mRNA structures in vivo. Nature. 2013;505:701–705. doi: 10.1038/nature12894. [DOI] [PMC free article] [PubMed] [Google Scholar]
- 8.Bokar JA. In: The biosynthesis and functional roles of methylated nucleosides in eukaryotic mRNA. Fine-tuning of RNA functions by modification and editing. Grosjean H, editor. Springer-Verlag; Berlin, Heidelberg, New York: 2005. pp. 141–178. [Google Scholar]
- 9.Jia G, et al. N6-methyladenosine in nuclear RNA is a major substrate of the obesity-associated FTO. Nat Chem Biol. 2011;7:885–887. doi: 10.1038/nchembio.687. [DOI] [PMC free article] [PubMed] [Google Scholar]
- 10.Zheng G, et al. ALKBH5 is a mammalian RNA demethylase that impacts RNA metabolism and mouse fertility. Mol Cell. 2013;49:18–29. doi: 10.1016/j.molcel.2012.10.015. [DOI] [PMC free article] [PubMed] [Google Scholar]
- 11.Liu J, et al. A METTL3-METTL14 complex mediates mammalian nuclear RNA N6- adenosine methylation. Nat Chem Biol. 2014;10:93–95. doi: 10.1038/nchembio.1432. [DOI] [PMC free article] [PubMed] [Google Scholar]
- 12.Wang Y, et al. N6-methyladenosine modification destabilizes developmental regulators in embryonic stem cells. Nat Cell Biol. 2014;16:191–198. doi: 10.1038/ncb2902. [DOI] [PMC free article] [PubMed] [Google Scholar]
- 13.Dominissini D, et al. Topology of the human and mouse m6A RNA methylomes revealed by m6A-seq. Nature. 2012;485:201–206. doi: 10.1038/nature11112. [DOI] [PubMed] [Google Scholar]
- 14.Meyer KD, et al. Comprehensive analysis of mRNA methylation reveals enrichment in 3′ UTRs and near stop codons. Cell. 2012;149:1635–1646. doi: 10.1016/j.cell.2012.05.003. [DOI] [PMC free article] [PubMed] [Google Scholar]
- 15.Wang X, et al. N6-methyladenosine-dependent regulation of messenger RNA stability. Nature. 2014;505:117–120. doi: 10.1038/nature12730. [DOI] [PMC free article] [PubMed] [Google Scholar]
- 16.Fustin JM, et al. RNA-methylation-dependent RNA processing controls the speed of the circadian clock. Cell. 2014;155:793–806. doi: 10.1016/j.cell.2013.10.026. [DOI] [PubMed] [Google Scholar]
- 17.Schwartz S, et al. High-resolution mapping reveals a conserved, widespread, dynamic mRNA methylation program in yeast meiosis. Cell. 2014;155:1409–21. doi: 10.1016/j.cell.2013.10.047. [DOI] [PMC free article] [PubMed] [Google Scholar]
- 18.Batista P, et al. m6A RNA modification controls cell fate transition in mammalian embryonic stem cells. Cell Stem Cell. 2014;15:707–719. doi: 10.1016/j.stem.2014.09.019. [DOI] [PMC free article] [PubMed] [Google Scholar]
- 19.Zhao X, et al. FTO-dependent demethylation of N6-methyladenosine regulates mRNA splicing and is required for adipogenesis. Cell Res. 2014;24:1403–1419. doi: 10.1038/cr.2014.151. [DOI] [PMC free article] [PubMed] [Google Scholar]
- 20.Konig J, et al. iCLIP reveals the function of hnRNP particles in splicing at individual nucleotide resolution. Nat Struct Mol Biol. 2010;17:909–915. doi: 10.1038/nsmb.1838. [DOI] [PMC free article] [PubMed] [Google Scholar]
- 21.McCloskey A, Taniguchi I, Shinmyozu K, Ohno M. hnRNP C tetramer measures RNA length to classify RNA polymerase II transcripts for export. Science. 2012;335:1643–1646. doi: 10.1126/science.1218469. [DOI] [PubMed] [Google Scholar]
- 22.Rajagopalan LE, Westmark CJ, Jarzembowski JA, Malter JS. hnRNP C increases amyloid precursor protein (APP) production by stabilizing APP mRNA. Nucleic Acids Res. 1998;26:3418–3423. doi: 10.1093/nar/26.14.3418. [DOI] [PMC free article] [PubMed] [Google Scholar]
- 23.Zarnack K, et al. Direct competition between hnRNP C and U2AF65 protects the transcriptome from the exonization of Alu elements. Cell. 2012;152:453–466. doi: 10.1016/j.cell.2012.12.023. [DOI] [PMC free article] [PubMed] [Google Scholar]
- 24.Cieniková Z, et al. Structural and Mechanistic Insights into Poly(uridine) Tract Recognition by the hnRNP C RNA Recognition Motif. J. Am. Chem. Soc. 2014;136:14536–14544. doi: 10.1021/ja507690d. [DOI] [PubMed] [Google Scholar]
- 25.Liu N, et al. Probing N6-methyladenosine RNA modification status at single nucleotide resolution in mRNA and long noncoding RNA. RNA. 2013;19:1848–1856. doi: 10.1261/rna.041178.113. [DOI] [PMC free article] [PubMed] [Google Scholar]
- 26.Krecic AM, Swanson MS. hnRNP complexes: composition, structure, and function. Curr Opin Cell Biol. 1999;11:363–371. doi: 10.1016/S0955-0674(99)80051-9. [DOI] [PubMed] [Google Scholar]
- 27.Gorlach M, Burd CG, Dreyfuss G. The determinants of RNA-binding specificity of the heterogeneous nuclear ribonucleoprotein C proteins. J Biol Chem. 1994;269:23074–23078. [PubMed] [Google Scholar]
- 28.Kierzek E, Kierzek R. The thermodynamic stability of RNA duplexes and hairpins containing N6-alkyladenosines and 2-methylthio-N6-alkyladenosines. Nucleic Acids Res. 2003;31:4472–4480. doi: 10.1093/nar/gkg633. [DOI] [PMC free article] [PubMed] [Google Scholar]
- 29.Hafner M, et al. Transcriptome-wide identification of RNA-binding protein and microRNA target sites by PAR-CLIP. Cell. 2010;141:129–141. doi: 10.1016/j.cell.2010.03.009. [DOI] [PMC free article] [PubMed] [Google Scholar]
- 30.Anders S, Reyes A, Huber W. Detecting differential usage of exons from RNA-seq data. Genome Res. 2012;22:2008–2017. doi: 10.1101/gr.133744.111. [DOI] [PMC free article] [PubMed] [Google Scholar]
- 31.Gorlach M, Burd CG, Dreyfuss G. The determinants of RNA-binding specificity of the heterogeneous nuclear ribonucleoprotein C proteins. J Biol Chem. 1994;269:23074–23078. [PubMed] [Google Scholar]
- 32.Ehresmann C, et al. Probing the structure of RNAs in solution. Nucleic Acids Res. 1987;15:9109–9128. doi: 10.1093/nar/15.22.9109. [DOI] [PMC free article] [PubMed] [Google Scholar]
- 33.Peterson ET, Pan T, Coleman J, Uhlenbeck OC. In vitro selection of small RNAs that bind to Escherichia coli phenylalanyl-tRNA synthetase. J Mol Biol. 1994;242:186–192. doi: 10.1006/jmbi.1994.1571. [DOI] [PubMed] [Google Scholar]
- 34.Corcoran DL, et al. PARalyzer: definition of RNA binding sites from PAR-CLIP short-read sequence data. Genome Biol. 2011;12:R79. doi: 10.1186/gb-2011-12-8-r79. [DOI] [PMC free article] [PubMed] [Google Scholar]
- 35.Dominissini D, Moshitch-Moshkovitz S, Salmon-Divon M, Amariglio N, Rechavi G. Transcriptome-wide mapping of N6-methyladenosine by m6A-seq based on immunocapturing and massively parallel sequencing. Nat Protoc. 2013;8:176–189. doi: 10.1038/nprot.2012.148. [DOI] [PubMed] [Google Scholar]
- 36.Lohse M, et al. RobiNA: a user-friendly, integrated software solution for RNA-Seq-based transcriptomics. Nucleic Acids Res. 2012;40:W622–627. doi: 10.1093/nar/gks540. [DOI] [PMC free article] [PubMed] [Google Scholar]
- 37.Langmead B, Trapnell C, Pop M, Salzberg SL. Ultrafast and memory-efficient alignment of short DNA sequences to the human genome. Genome Biol. 2009;10:R25. doi: 10.1186/gb-2009-10-3-r25. [DOI] [PMC free article] [PubMed] [Google Scholar]
- 38.Elemento O, Slonim N, Tavazoie S. A universal framework for regulatory element discovery across all genomes and data types. Mol Cell. 2007;28:337–350. doi: 10.1016/j.molcel.2007.09.027. [DOI] [PMC free article] [PubMed] [Google Scholar]
- 39.Ouyang Z, Snyder MP, Chang HY. SeqFold: genome-scale reconstruction of RNA secondary structure integrating high-throughput sequencing data. Genome Res. 2013;23:377–387. doi: 10.1101/gr.138545.112. [DOI] [PMC free article] [PubMed] [Google Scholar]
- 40.Xiao Y, et al. A novel significance score for gene selection and ranking. Bioinformatics. 2012;30:801–807. doi: 10.1093/bioinformatics/btr671. [DOI] [PMC free article] [PubMed] [Google Scholar]
- 41.Trapnell C, Pachter L, Salzberg SL. TopHat: discovering splice junctions with RNA-Seq. Bioinformatics. 2009;25:1105–1111. doi: 10.1093/bioinformatics/btp120. [DOI] [PMC free article] [PubMed] [Google Scholar]
- 42.Trapnell C, et al. Differential gene and transcript expression analysis of RNA-seq experiments with TopHat and Cufflinks. Nat Protoc. 2012;7:562–578. doi: 10.1038/nprot.2012.016. [DOI] [PMC free article] [PubMed] [Google Scholar]
- 43.Huelga SC, et al. Integrative genome-wide analysis reveals cooperative regulation of alternative splicing by hnRNP proteins. Cell Rep. 1:167–178. doi: 10.1016/j.celrep.2012.02.001. [DOI] [PMC free article] [PubMed] [Google Scholar]
- 44.Eden E, Navon R, Steinfeld I, Lipson D, Yakhini Z. GOrilla: a tool for discovery and visualization of enriched GO terms in ranked gene lists. BMC Bioinformatics. 2009;10:48. doi: 10.1186/1471-2105-10-48. [DOI] [PMC free article] [PubMed] [Google Scholar]
- 45.Pollard KS, Hubisz MJ, Rosenbloom KR, Siepel A. Detection of nonneutral substitution rates on mammalian phylogenies. Genome Res. 2010;20:110–121. doi: 10.1101/gr.097857.109. [DOI] [PMC free article] [PubMed] [Google Scholar]
- 46.Yang F, Yi F, Han X, Du Q, Liang Z. MALAT-1 interacts with hnRNP C in cell cycle regulation. FEBS Lett. 2013;587:3175–3181. doi: 10.1016/j.febslet.2013.07.048. [DOI] [PubMed] [Google Scholar]


