

Abstract
FabI is a potential antibiotic target against Francisella tularensis, which has been classified as a Category A biowarfare agent of high risk to public health. Our previous work demonstrated that N-benzyl benzimidazole compounds possess promising FabI inhibitory activity, but their druggability properties including metabolic stability are unknown. The objective of this study was to characterize structure-metabolism relationships of a series of N-benzyl benzimidazole compounds to guide chemical optimization for better metabolic stability. To this end, metabolic stability data were obtained for 22 initial lead compounds using mouse hepatic microsomes. Metabolic hotspots on the benzimidazole core structure as well as the benzyl ring were identified and verified by metabolite identification studies of 4 model compounds. Interestingly, the proposed structure-metabolism relationships did not apply to 9 newly synthesized cyclopentane or oxacyclopentane derivatives of N-benzyl benzimidazole. Subsequently, in silico quantitative structure-property relationship models were developed. Four molecular descriptors representing molecular polarity/polarisability, symmetry and size were identified to best explain variability in metabolic stability of different compounds. Multi-linear and nonlinear regression models based on the selected molecular descriptors were developed and validated. The structure-metabolism relationships for N-benzyl benzimidazole compounds should help optimization of N-benzyl benzimidazole compounds for better pharmacokinetic behavior.
key terms: microsome, optimization, antibiotics, metabolism
Introduction
Francisella tularensis is the causative organism of the zoonotic disease, tularemia (rabbit fever), and has been classified as a Category A biowarfare agent due to its extremely low infective dose, ease of cultivation, rapid onset, and potentially high morbidity and mortality (Oyston and others 2004; Pohanka and Skladal 2009). The current recommended therapy for tularemia is streptomycin or tetracycline; however, these drugs can cause significant side effects (e.g. nephrotoxicity) or are not orally bioavailable (Hepburn and Simpson 2008). Accordingly, there is an urgent need for a safe and effective oral antibiotic that can be used during a widespread tularemia outbreak.
The enzymes involved in the bacterial fatty acid biosynthesis pathway (FAS II) represent potentially selective antimicrobial targets (Bush and Pucci 2011); the mammalian counterpart FAS I uses a fundamentally distinct multienzyme complex that exhibits low amino acid sequence homology to the components of FAS II (Wright and Reynolds 2007). Enoyl-acyl carrier protein (ACP) reductase (FabI) is a component of the FAS II pathway, and is the only enzyme that catalyzes the final step of the pathway (i.e. reduction of a double bond in enoyl-ACP) (Wen and others 2009). In recent studies, we developed a novel series of benzimidazole analogues with a para-halogen substituted benzyl group that inhibited FabI activity in the micromolar to nanomolar range. These compounds possessed antibacterial activity against a panel of clinical pathogens including F. tularensis (Hevener and others 2012). Interestingly, a co-crystal structure of the FabI enzyme with a benzimidazole compound revealed a novel binding mode, distinct from that of other known FabI inhibitors, that may give rise to a unique resistance pattern if the resistance occurs (Mehboob and others 2012).
Hepatic metabolism is a major route of drug elimination, potentially limiting the amount of drugs systemically available for bioactivity. Hepatic microsomes have served as a screening system to identify compounds with promising metabolic stability and to prioritize large numbers of lead compounds for further development (Boyer and others 2009; Di and others 2006). Furthermore, studies of metabolites produced in microsomal reaction have enabled identification of metabolic “soft spot” and thus chemical optimization through modification of the metabolically labile substructure (K. Sahua 2013; Stepan and others 2011). On the other hand, quantitative structure-property relationships (QSPR) models can be developed based on theoretical molecular descriptors that are derived solely from structural information of compounds (Hernandez-Covarrubias and others 2012). These models have assisted identification of structural features responsible for metabolic instability (Gupta and others 2010). Together with the experimental approaches using hepatic microsomes, this in silico approach helps designing compounds with promising pharmacokinetic properties.
In the present study, to guide chemical optimization for better metabolic stability, we characterized structure-metabolism relationships for N-benzyl-benzimidazole compounds based on results from mouse hepatic microsomes and metabolite identification studies. Furthermore, in silico QSPR models was developed and validated for prediction of microsomal stability.
Materials and methods
Compounds
Compounds 1 to 6, 12, 15, and 16 were purchased from ChemBridge (San Diego, CA), while Compound 7 to 11, and 14 were from Specs (Wakefield, RI). Compound 13, and 17 to 31 were synthesized by Dr. Arun K. Ghosh’s Lab at Purdue University (manuscript in preparation). The purity of all these compounds has been determined by LC-MS and/or NMR to be ≥ 95%. Stock solutions (20 mM) of each compound were prepared in dimethyl sulfoxide and serially diluted in methanol to the required concentrations. Phenytoin, phosphate-buffered saline (PBS), isocitric acid, magnesium chloride, isocitric acid dehydrogenase, and nicotinamide adenine dinucleotide phosphate (NADP+) were purchased from Sigma-Aldrich (St. Louis, MO). Formic acid (ACS grade), acetonitrile and methanol (Optima grade) were obtained from Fisher Scientific (Pittsburgh, PA).
Hepatic microsomal assays
Pooled female BALB/c mouse liver microsomes were prepared as described previously (Jeong and Chiou 2006). A typical incubation mixture (100 μL total volume) for metabolic stability studies contained 1 μM (final concentration; reflecting bioactive concentration) test compounds, 0.5 mg/mL microsomal protein (100 mM Tris-HCl buffer, pH 7.4), and NADPH-generating system (5 mM isocitric acid, 0.2 unit/mL isocitric acid dehydrogenase, 5 mM magnesium chloride, 1 mM NADP+). The final concentration of organic solvent in the incubation media was less than 1% (v/v). After preincubation at 37°C for five min, the reactions were started by addition of NADP+ and further incubated for another 0, 5, 10, and 20 min. For control experiments, NADPH and/or liver microsomes were omitted from these incubations. The reactions were terminated by adding 100 μL ice-cold acetonitrile containing phenytoin (1 μM) as internal standard and keeping the samples on ice for 30 min. The mixtures were centrifuged at 16 100g for 15 min at 4 °C. The supernatant were analyzed by using liquid chromatography-tandem mass spectrometry (LC-MS/MS). For metabolite identification studies, Compound 5, 16, 19, and 20 (100 μM) were individually incubated with microsomes (0.5 mL) for 60 minutes. Two volumes of acetonitrile were added and the mixture was kept on ice for 30 minutes to terminate the reaction and precipitate proteins. The mixture was then centrifuged at 16 100g for 20 min at 4 °C, and the supernatants were evaporated under reduced pressure. The residues were reconstituted with the mobile phase and analyzed by LC-MS/MS for metabolite identification.
Protein binding assay
To measure the free fraction of test compounds in female BALB/c mouse serum (fu, s) and/or liver microsomes (fu, m), Single-Use Rapid Equilibrium Dialysis plate from Thermo Scientific-Pierce Biotechnology (Rockford, IL) was used. The cutoff molecular weight for the dialysis membrane was 8,000 Da. In general, spiked serum or microsomal (0.5 mg/mL) solutions (100 μL) containing each test compound (1 μM) were placed into the sample chamber and 300 μL PBS dialysis buffer into the adjacent chamber. The content of organic solvent in the final serum/microsomal solutions was kept below 1%. The plates were then covered with sealing tape (MicroAmp™, Applied Biosystems, Foster City, CA) and incubated at 37°C for four hours on an orbital shaker at 100 rpm. Aliquots (50 μL) were removed from each side of the insert and placed in separate tubes. The same volume (50 μL) of blank serum/microsomes was added to the buffer samples and an equal volume of PBS was added to the collected serum/microsomes samples. To each sample, 200 μL of acetonitrile containing phenytoin (1 μM) as internal standard was added. These samples were vortexed for 30 seconds and chilled on ice for 30 minutes, then centrifuged at 16 100g for 15 min at 4 °C. Drug concentrations in the supernatant were determined by LC-MS/MS.
Measurement of drug concentration and metabolite identification
Drug concentrations in microsomal and serum samples were determined by Agilent 1200 HPLC interfaced with Applied Biosystems Qtrap 3200 equipped with an electrospray ion source. Chromatographic separation was carried out with a Waters XTerra MS C18 column (2.1×50 mm, 3.5 μm; Agilent Technologies, Santa Clara, CA). The mobile phases consisted of solvent A [0.1% (v/v) aqueous formic acid] and solvent B (acetonitrile). A gradient flow HPLC method (250 μL/min over 10 min) was developed for each test compound. The test compounds and internal standard was detected in a positive ion mode by examining multiple reaction monitoring (MRM) pairs. The test compounds were quantified by comparing the ratio of ion currents obtained for the substrates and an internal standard calibration curve. For metabolite identification of selected compounds, chromatographic separation was performed on an EC NUCLEODUR C18 Isis column (250 mm, 4.6 mm ID, 3 μm; Macherey-Nagel, Düren, German). A slower gradient HPLC method was used to achieve the separation of metabolites using the same mobile phases (A and B) as described before: 20% B at time 0, linear ramp to 90% B over 30 min, 90% B for 3 minutes, linear fall to 20% B over 0.5 minutes, followed by 11.5 minutes equilibration. The mass acquisition method consisted of an information-dependent acquisition (IDA) scan cycle including the enhanced mass scan (EMS) as the survey scan and multiple dependent enhanced product ion scans (EPI). Scan range of the EMS was set at 100–500 Da for phase I metabolites. The spraying needle voltage was set at 5000 V. Curtain gas was set at 20 psi; gas 1 and gas 2 were set at 45 psi and 50 psi, respectively; collision assisted dissociation gas was at medium (EMS) or high (EPI), and the source heater probe temperature was at 500 °C. Data acquisition and processing were accomplished using Analyst software (version 1.4.2; Applied Biosystems).
FabI inhibition assay
Inhibitory concentrations of benzimidazole compounds for FabI activity were determined as previously described (Hevener and others 2012), except as noted in Tables 1 and 2.
TABLE 1.
Microsomal stability, FabI inhibitory activity, and cLogP values (calculated by ACD/ChemSketch software) of FabI inhibitors with N-benzyl-benzimidazole scaffold
| |||||||||
|---|---|---|---|---|---|---|---|---|---|
| FabI Inhibitiona | Microsomal Stability | ||||||||
|
|
|||||||||
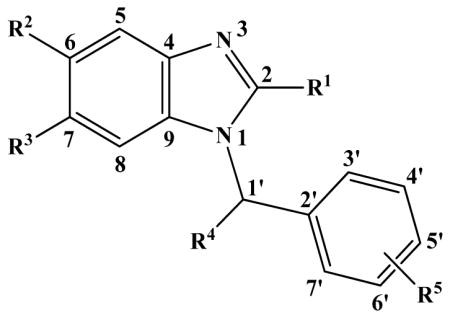
| Compd | R1 | R2 | R3 | R4 | R5 | cLogP | IC50 (μM) | t1/2 (min) | CLint, app (μl/min/mg) |
| 1 | H | H | H | H | 3′-H, 4′-H, 5′-H, 6′-H, 7′-H | 3.24 | >100 | 5.8 | 240 |
| 2 | H | H | H | H | 3′-H, 4′-H, 5′-CH3, 6′-H, 7′-H | 3.70 | 90 | 5.4 | 255 |
| 3 | H | H | H | H | 3′-H, 4′-H, 5′-OCH3, 6′-H, 7′-H | 3.16 | 38 | 5.6 | 248 |
| 4 | H | H | H | H | 3′-H, 4′-H, 5′-Br, 6′-H, 7′-H | 4.01 | 27 | 7.4 | 186 |
| 5 | H | H | H | H | 3′-H, 4′-Cl, 5′-Cl, 6′-H, 7′-H | 4.31 | 4.7 | 4.6 | 304 |
| 6 | H | H | H | =O | 3′-H, 4′-H, 5′-Cl, 6′-H, 7′-H | 3.57 | >100 | N.A.b | N.A. |
| 7 | NH2 | H | H | H | 3′-H, 4′-H, 5′-Cl, 6′-H, 7′-H | 3.35 | >100 | 32.5 | 43 |
| 8 | COCH3 | H | H | H | 3′-H, 4′-H, 5′-Cl, 6′-H, 7′-H | 3.68 | >100 | 3.8 | 365 |
| 9 | NHCOCH3 | H | H | H | 3′-H, 4′-H, 5′-Cl, 6′-H, 7′-H | 3.50 | >100 | 20.3 | 68 |
| 10 | CH3 | H | H | H | 3′-H, 4′-Cl, 5′-Cl, 6′-H, 7′-H | 4.83 | 3.2 | 4.3 | 324 |
| 11 | SCH2CH3 | H | H | H | 3′-H, 4′-H, 5′-Cl, 6′-H, 7′-H | 5.63 | >100 | 3.1 | 452 |
| 12 | H | CH3 | CH3 | =O | 3′-H, 4′-H, 5′-H, 6′-Cl, 7′-H | 4.53 | >100 | N.A. | N.A. |
| 13 | H | CH3 | CH3 | CH3 | 3′-H, 4′-H, 5′-Cl, 6′-Cl, 7′-H | 5.57 | 2.75 | 9.2 | 151 |
| 14 | H | CH3 | CH3 | H | 3′-H, 4′-H, 5′-Cl, 6′-H, 7′-H | 4.76 | 0.3 | 3.8 | 369 |
| 15 | H | CH3 | CH3 | H | 3′-Cl, 4′-H, 5′-Cl, 6′-H, 7′-H | 5.36 | 0.7 | 4.0 | 345 |
| 16 | H | CH3 | CH3 | H | 3′-H, 4′-H, 5′-Cl, 6′-Cl, 7′-H | 5.23 | 0.3 | 5.3 | 263 |
| 17 | H | CH3 | CH3 | H | 3′-H, 4′-OCH3, 5′-Cl, 6′-H, 7′-H | 4.62 | >100 | 2.4 | 573 |
| 18 | H | CH3 | CH3 | H | 3′-H, 4′-OCH3, 5′-Cl, 6′-H, 7′-Br | 5.60 | >100 | 3.5 | 395 |
| 19 | H | CH3 | CH3 | H | 3′-H, 4′-H, 5′-OCH3, 6′-H, 7′-H | 4.08 | 0.5c | <2 | >693 |
| 20 | H | CH3 | CH3 | H | 3′-H, 4′, 5′-OCH2O, 6′-H, 7′-H | 4.02 | 1.0c | 3.7 | 376 |
| 21 | H | CH3 | CH3 | H | 3′-H, 4′-CH3, 5′-OCH3, 6′-H, 7′-H | 4.54 | 0.25c | <2 | >693 |
| 22 | H | CH3 | CH3 | H | 3′-H, 4′-CH3, 5′-OH, 6′-H, 7′-H | 3.88 | 1.3 | 3.3 | 426 |
FabI IC50 values determined per published procedures (Hevener et al. 2012);
N.A., not available;
IC50 value determined with reduced FabI concentration of 10 nM.
TABLE 2.
Optimization of benzimidazole-based FabI inhibitors and prediction of in vivo hepatic clearance in BALB/c mouse
| |||||||||||
|---|---|---|---|---|---|---|---|---|---|---|---|
| Compd | R1 | R2 | R3 | cLogP | FabI Inhibitiona | Microsomal Stability | Serum/Microsomal Free Fraction | Hepatic Clearance | Hepatic Extraction Ratio | ||
|
| |||||||||||
| IC50 (μM) | t1/2 (min) | Clint, app (μl/min/mg) | fu, s | fu, m | Clh (ml/min/kg) | ||||||
| 23 | CH2 | CH3 | 3′-H, 4′-Cl, 5′-Cl, 6′-H, 7′-H | 5.77 | 0.043 | 20.0 | 69 | 0.001 | 0.017 | 7 | 0.1 |
| 24 | CH2 | H | 3′-H, 4′-H, 5′-OCH3, 6′-H, 7′-H | 4.28 | 0.84 | 2.9 | 474 | 0.022 | 0.299 | 38 | 0.4 |
| 25 | CH2 | H | 3′-H, 4′, 5′-OCH2O, 6′-H, 7′-H | 4.22 | 2.2 | 4.6 | 304 | 0.021 | 0.263 | 30 | 0.3 |
| 26 | CH2 | H | 3′-H, 4′-CH3, 5′-OCH3, 6′-H, 7′-H | 4.74 | 0.005 | 2.1 | 672 | 0.006 | 0.086 | 45 | 0.5 |
| 27 | O | CH3 | 3′-H, 4′-Cl, 5′-Cl, 6′-H, 7′-H | 4.28 | 0.89 | 14.8 | 94 | 0.034 | 0.393 | 13 | 0.1 |
| 28 | O | H | 3′-H, 4′-H, 5′-OCH3, 6′-H, 7′-H | 2.78 | 5.3 | 5.9 | 235 | 0.183 | 0.816 | 47 | 0.5 |
| 29 | O | H | 3′-H, 4′, 5′-OCH2O, 6′-H, 7′-H | 2.73 | 11.8 | 20.4 | 68 | 0.201 | 0.791 | 24 | 0.3 |
| 30 | O | H | 3′-H, 4′-CH3, 5′-OCH3, 6′-H, 7′-H | 3.24 | 0.12 | 1.4 | 980 | 0.158 | 0.812 | 72 | 0.8 |
| 31 | O | H | 3′-H, 4′-OCH3, 5′-OCH3, 6′-H, 7′-H | 2.60 | 22.4 | 18.6 | 75 | 0.293 | 0.855 | 31 | 0.3 |
FabI IC50 values determined per published procedures (Hevener et al. 2012) with reduced FabI concentration of 10 nM.
Prediction of in vitro and in vivo clearance
Apparent half-lives (t1/2) for the disappearance of parent drug in microsomal incubations were calculated from the pseudo-first-order rate constants (ke) obtained by linear regression of plots of ln[amount of the remaining drug] versus time (GraphPad Prism 5 software, La Jolla, CA). Microsomal t1/2 was calculated using the equation: . The microsome apparent hepatic intrinsic clearance (CLint, app) was determined using the equation: as described previously (Di and others 2012). The hepatic clearance (CLh) was then estimated by the well-stirred model (Chiba and others 2009): , where Qh is mouse hepatic blood flow (90 mL/min/kg) (Davies and Morris 1993). The scaling factors included in the equations are: 30 milligrams of protein per gram of liver wet weight (Kreuzer and others 1991), and 62.9 grams of liver per kilogram body weight (i.e. experimental data from >20 mice). Hepatic extraction ratio was then estimated by dividing CLh by Qh.
Data set for QSPR modeling
Of 31 N-benzyl-benzimidazole derivatives, Compound 6 and 12 were omitted from modeling due to their chemical instability. The remaining 29 compounds were grouped into two subsets based on the k-means clustering method (Leonard and Roy 2006). About 80% of the data set (23 compounds) was classified into the training set to build models; the remaining 20% (6 compounds) was used as a prediction set in multi-linear regression (MLR) modeling. The same training data set was used for artificial neural network (ANN) modeling. Additionally, for ANN modeling, six compounds in the prediction set were randomly split into validation and test sets (three and three compounds, respectively) to improve robustness of the fitting.
Molecular descriptors
CORINA, via the NCI’s Online SMILES Translator and Structure File Generator, was used to generate three-dimensional coordinates in MOL format from the chemical structure of each FabI inhibitor. Eight hundred and sixty three descriptors (729 1D/2D descriptors and 134 3D descriptors) were generated by PaDEL-Descriptor 2.12 (Yap 2011). The following six descriptors were calculated by ACD/ChemSketch (ACD/Labs, Toronto, Canada): cLogP, molar refractivity, molar volume, parachor, surface tension, and polarizability.
Variable selection and model development
Firstly, the descriptors that are irrelevant or redundant in describing the benzimidazole compounds were removed through the following pretreatment of the dataset: (1) Error codes were replaced with zero, and descriptors containing zero values for >90% of the compounds were removed. (2) Descriptors that are highly correlated (r2≥0.9) with the existing descriptors were removed. These pretreatments removed >500 descriptors. Secondly, the remaining ~330 descriptors were individually normalized to the [0, 1] range. The normalized data were then used to develop a model of molecular descriptors that best represent metabolic stability (i.e. CLint, app).
For principal component (PC) analysis of the dataset, a minimum number of descriptors that best represent metabolic stability were first identified. To this end, the genetic algorithm (GA) technique was applied to the dataset using the BuildQSAR program (de Oliveira and Gaudio 2001). The following prediction parameters were used: a population of 100 random models, 1500 iterations to evolution, and the mutation probability of 35%. MLR models with the descriptors that had cross-correlation coefficient of >0.6 were removed from further consideration. Using the descriptors identified through the GA method, MLR models were constructed using SPSS version 17.0 (SPSS Inc. Chicago, IL).
The nonlinear relationship between the selected descriptors (from GA) and CLint, app was analyzed by ANN using MATLAB R2009b (Mathworks, Natick, MA). The descriptors selected from the best MLR model were submitted to a three-layer (4-3-1) fully connected error back propagation neural network with sigmoid transfer function. The number of input neurons was equal to that of the selected descriptors. The number of nodes for hidden layer and momentum was optimized by the validation set. Levenberg–Marquardt algorithm was adopted to optimize weights and minimize biases (Hagan and Menhaj 1994). The early-stopping method was adopted to improve robustness of the model.
Model validation
The following parameters were calculated to evaluate the performance of models: Q2 (leave-one-out cross-validation squared correlation coefficient), RMSE (root-mean-square error of prediction), R2 (square correlation coefficient for regression line of the experimental vs. predicted activity), R02 (square correlation coefficients for regression line through the origin), and K (the slope of regression line through the origin). The residuals between predicted and experimentally derived activities were also calculated. The propositional criteria necessary for high predictive ability of a model were high Q2 (> 0.5), high R2 for external test set (> 0.6), (R2 – R02)/R2 < 0.1, and 0.85≤K≤1.15 (Golbraikh and Tropsha 2002).
Results
Metabolic stability
Of 22 compounds initially selected for microsomal stability assay, Compound 6 and 12 were found chemically unstable in the incubation buffer (the compounds undetectable after 3 min of incubation). Concentration of the remaining 20 compounds decreased in microsomal reactions in the presence but not in the absence of NADPH, suggesting microsomal oxidation of the compounds by cytochrome P450 (CYP) and/or flavin-containing monooxygenase (FMO). As shown in Table 1, the benzimidazole core structure (Compound 1) exhibited high oxidative metabolic turnover (t1/2, 5.8 min). However, an amino substituent at the 2-position (Compound 7) resulted in a dramatically increased stability (t1/2, 32.5 min). Substituting an acetyl (Compound 8) or a methyl group (Compound 10) for this hydrogen bond donor group failed to maintain the good metabolic properties. In addition, methyl group substitutions at the 6- and 7- positions (Compound 16) exhibited little effect on stability (t1/2, 5.3 min), whereas the presence of a methyl group at the methylene linker (Compound 13) slightly improved the stability (t1/2, 9.2 min). A compound containing a halogen atom on the benzene ring (Compound 4) was generally more stable (t1/2, 7.4 min); however, substitution by methyl (Compound 2), methoxy (Compound 19) or methylenedioxy ring (Compound 20) did not improve the microsomal stability. Figure 1 summarizes structure-metabolic stability relationships (SMR) for the N-benzyl-benzimidazole series.
Fig. 1.
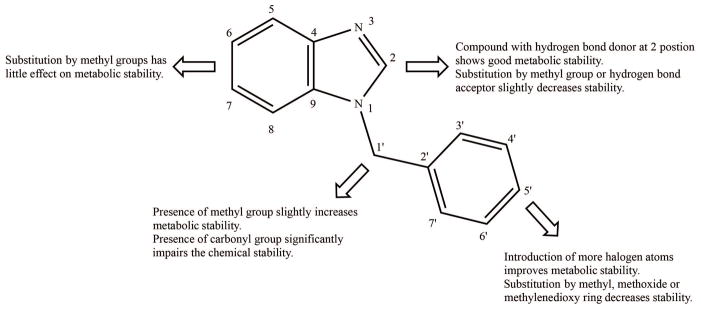
N-benzyl-benzimidazole structure-metabolic stability relationships map.
Metabolite identification
To detect metabolic “soft spots” of the compounds, metabolites of 4 structurally representative members (Compound 5, 16, 19 and 20) were identified by using LC-MS/MS. After incubation of Compound 5 with NADPH-supplemented liver microsomes, four metabolites were observed (Figure 2A). The mass spectrum of Compound 5 (m/z 277) showed an abundant product ion of m/z 159 (loss of benzimidazole) (Figure 2B). The fragment ion scan of M-1 (m/z 309, mass shifts + 32 Da, dihydroxylation) (Figure 2C) and M-3 (m/z 293, mass shifts + 16 Da, monohydroxylation) (Figure 2D) revealed the same fragment ion (at m/z 159), indicating that hydroxylation occurred at the benzimidazole ring. M-2 and M-4 showed the same mass spectrum as M-1 and M-3, indicating that they are positional isomers of M-1 and M-3, respectively. Together, this result suggests that the unsubstituted benzimidazole ring is metabolically labile.
Fig. 2.

Metabolite identification of Compound 5. Representative chromatography (A); MS/MS spectrum of parent Compound 5 (B); M-1 and M-2, benzimidazole dihydroxylation (C); and M-3 and M-4, benzimidazole monohydroxylation (D).
Compound 16, possessing C-6, 7 dimethyl substituents on the benzimidazole ring, was then investigated and four hydroxylated metabolites were detected (Figure 3A). The product ion spectrum of Compound 16 (Figure 3B), M-1 (m/z 337, mass shifts + 32 Da, dihydroxylation) (Figure 3C), M-2 and M-3 (m/z 321, mass shifts + 16 Da, monohydroxylation) (Figure 3D) yielded the typical product ion at m/z 159 (loss of dimethylbenzimidazole), suggesting that hydroxylation still occurred mainly at the benzimidazole moiety. The presence of product ion at m/z 291 in the spectrum of M-2 and M-3 (Figure 3D) indicated that the hydroxylation took place at a methyl substituent of the benzimidazole ring. M-1 demonstrated a similar fragmentation pattern as M-2 and M-3, indicating sequential hydroxylation of the benzimidazole ring after monohydroxylation. On the other hand, in the spectrum of M-4 (m/z 321, mass shifts + 16 Da, monohydroxylation) (Figure 3E), the presence of a product ion at m/z 175 indicates hydroxylation at the benzyl moiety. The product ions at m/z 147 and m/z 111 in the same spectrum further confirmed that the hydroxylation occurred at the methylene linker. Together, methyl substitutions on the benzimidazole moiety appeared to introduce additional metabolic soft spots to the molecular structure.
Fig. 3.

Metabolite identification of Compound 16. Representative chromatography (A); MS/MS spectrum of parent Compound 16 (B); M-1, dimethylbenzimidazole dihydroxylation (C); M-2 and M-3, methyl monohydroxylation (D); and M-4, methylbenzene monohydroxylation (E).
The effect of substitutions at the phenyl ring on the metabolic profile was examined using Compound 19 and 20 as model compounds. The product ion spectrum of Compound 19 (m/z 267) (Figure 4B) showed an abundant product ion at m/z 121 (loss of dimethylbenzimidazole). The predominant metabolite, M-7 (m/z 253, mass shifts – 14 Da, demethylation) (Figure 4F) resulted in the fragment ion of m/z 107, indicating O-demethylation of the methoxy group on the phenyl ring. The product ion spectra of M-1, M-3, and M-4 (m/z 269, mass shifts + 2 Da, demethylation and monohydroxylation) (Figure 4C) included an ion at m/z 123, suggesting that hydroxylation occurred on the benzyl ring. M-2 and M-6 (m/z 283, mass shifts + 16 Da, monohydroxylation) (Figure 4D) appears to represent hydroxylation at the dimethylbenzimidazole unit and was present as positional isomers. On the other hand, M-5 (m/z 299, mass shifts + 32 Da, dihydroxylation) (Figure 4E) and M-8 (m/z 283, mass shifts + 16 Da, monohydroxylation) (Figure 4G) represent hydroxylation at the benzyl moiety. For Compound 20, 6 metabolites were detected after microsomal reaction (Figure 5A). M-1 (m/z 313, mass shifts + 32 Da, dihydroxylation) (Figure 5C) and M-2, M-4, and M-5 (m/z 297, mass shifts + 16 Da, monohydroxylation) (Figure 5D) appeared to be hydroxylation products at the dimethylbenzimidazole ring. M-3 (m/z 269, mass shifts – 12 Da, demethylenation) (Figure 5E) showed two product ions at m/z 123 and 147, indicating oxidative demethylenation of the methylenedioxybenzene. M-6 (m/z 297, mass shifts + 16 Da, monohydroxylation) (Figure 5F) appears to be a hydroxylation product at the benzyl unit. Taken together, the benzimidazole ring or methyl substituents of the ring were identified as metabolic soft spots, and methyl, methoxy, or methylenedioxy groups at the phenyl ring were identified as additional soft spots.
Fig. 4.

Metabolite identification of Compound 19. Representative chromatography (A); MS/MS spectrum of parent Compound 19 (B); M-1, M-3, and M-4, demethylation & monohydroxylation (C); M-2 and M-6, dimethylbenzimidazole monohydroxylation (D); M-5, methylbenzene dihydroxylation (E); M-7, demethylation (F); and M-8, methylbenzene monohydroxylation (G).
Fig. 5.

Metabolite identification of Compound 20. Representative chromatography (A); MS/MS spectrum of parent Compound 20 (B); M-1, dimethylbenzimidazole dihydroxylation (C); M-2, M-4, and M-5 dimethylbenzimidazole monohydroxylation (D); M-3, demethylenation (E); M-6, methylbenzene monohydroxylation (F).
Blockage of metabolic soft spots
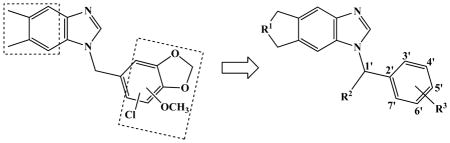
In an attempt to block methyl hydroxylation of Compound 16, the most active compound in our first generation FabI inhibitors (Hevener and others 2012), a new set of compounds were designed and synthesized where a cyclopentane was attached to the side of benzimidazole ring at the 6, 7-positions (Table 2). Additionally, since decreased lipophilicity of a compound is often associated with better metabolic stability (Meanwell 2011), a series of oxacyclopentane analogs that show less hydrophobicity as compared to the dimethylbenzimidazole compounds were synthesized. For Compound 23 and 27, a methyl group was also introduced to the methylene linker to block hydroxylation at the site (Fig 3E). The cyclopentane compounds maintained promising FabI inhibitory activity (Table 2). The in vitro microsomal t1/2 of Compound 23 (i.e. 20 min) was 4-fold longer than that of Compound 16. Also, the oxacyclopentane analogs (Compound 27–31) showed improved metabolic stability as compared to their dimethylbenzimidazole counterparts (Compound 15–22), while retaining FabI inhibitory activity. Compound 29 showed ~6-fold longer microsomal t1/2 in comparison with Compound 20, potentially due to decreased lipophilicity (clogP, 2.73 versus 4.02); however, Compound 30 (clogP, 3.24) showed similar metabolic stability as Compound 21 (clogP, 4.54), indicating that lipophilicity of compounds alone does not predict metabolic stability of benzimidazole compounds. Of note, substitution at the phenyl ring showed differential effects on metabolic stability of cyclopentane vs. oxacyclopentane analogs (Compounds 23–26 vs. 27–31). For example, the same OCH2O-substitution exhibited different effects on metabolic stability of Compound 25 vs. 29. Together, these results indicate that information of substituted functional group or a single physicochemical property of compounds does not fully predict metabolic stability of benzimidazole compounds.
Identification of molecular descriptors for prediction of CLint, app
To better predict metabolic stability of the benzimidazole compounds, QSPR models were developed where multiple structural features of individual compound were examined as predictors of CLint, app. To this end, 869 molecular descriptors were theoretically derived from the 29 N-benzyl-benzimidazole derivatives. Five hundred and thirty nine descriptors were found irrelevant or redundant for the series of compounds, and thus removed from further analysis. We then tested whether the most representative descriptors for prediction of CLint, app could be identified through PC analysis using the remaining 330 molecular descriptors. Ninety percent of the total data variance in descriptors was explained by 9 PCs (Figure 6A); however, the loading plot of PC1 and PC2 (that explain >50% of the variance) did not show significant clustering (Figure 6B), indicating that PC1 and PC2 likely contain descriptors that are highly correlated to each other, and that the key descriptors for metabolic stability are not identifiable through PC analysis.
Fig. 6.

Analysis of chemical diversity by PC analysis. Cumulative percent of explained data variance by consecutive PCs (A), loading plot of PC1 and PC2 (B), and a 3D scores correlation plot of the first three PCs (C).
Then, the representative descriptors for prediction of CLint, app were selected via a variable selection method of GA. To this end, the 29 compounds were split into training and prediction sets. The dispersion of the factor scores on the 3D coordinates system (Fig 6C) by PC1, PC2, and PC3 (that together explain ~65% of variances) demonstrated that the 29 compounds in the training and prediction sets were well scattered over the whole chemical space, indicating a lack of bias in the split data. The selected descriptors and statistical values for different models were summarized in supplementary Table S1. The iterative process yielded 4 variables that best describe CLint, app, and the following multi-linear regression model was derived using the 4 variables:
ECCEN is a 2D topological descriptor and defined as a sum of the product of eccentricity and degree of each vertex in a molecular graph (Sharma and others 1997). MLFER_S is a descriptor for combined dipolarity/polarizability (Platts and others 1999). Wgamma1.unity and WT.unity represent symmetry and molecular size of a compound, respectively (Todeschini and Gramatica 1998). The predicted CLint, app and descriptor values for all compounds are listed in supplementary Table S2. Graphical representation of the experimental versus predicted log (CLint, app) values for the training and prediction showed a good correlation (Fig 7A). The statistical characteristics of this MLR model were in accordance with the criteria for a good predictive model (Table 3).
Fig. 7.
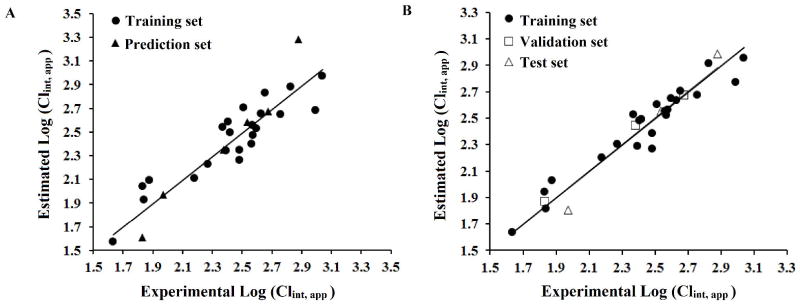
QSPR model of microsomal stability dataset using MLR (A) and ANN (B). Plot of estimated versus calculated CLint, app (log-transformed) for training and prediction sets.
TABLE 3.
Statistical results of MLR and ANN models.
| Model | Data Set | Q2 | RMSE | R2 | R02 | (R2-R02)/R2 | K |
|---|---|---|---|---|---|---|---|
| MLR | Training | 0.72 | 0.14 | 0.84 | 0.81 | 0.04 | 1.00 |
| Prediction | 0.19 | 0.96 | 0.88 | 0.08 | 1.02 | ||
| ANN | Training | 0.93 | 0.10 | 0.92 | 0.91 | 0.02 | 1.00 |
| Validation | 0.04 | 1.00 | 0.99 | 0.00 | 1.01 | ||
| Test | 0.12 | 1.00 | 0.94 | 0.06 | 1.00 | ||
| Predictiona | 0.09 | 0.97 | 0.96 | 0.01 | 1.01 |
The validation and test set of ANN model were also analyzed together in order to compare with MLR results.
Nonlinear models have been previously shown to better fit the relationship between molecular descriptors and metabolic stability of compounds than linear models do (Sakiyama and others 2008). In order to explore non-linear relationship between CLint, app and the 4 molecular descriptors selected through GA, ANN models were developed. The experimental versus the predicted values of log (CLint, app) from the ANN model revealed a good correlation (Figure 7B). Interestingly, the statistical results of ANN model show better fitting with ANN than the MLR model (e.g. R2 increased from 0.84 to 0.92 for the training set), suggesting that the nonlinear model better predicts metabolic stability of a compound based on the 4 selected descriptors.
Prediction of serum protein binding
Hepatic clearance and extraction ratios are governed by the extent of protein binding as well as metabolic stability (Obach 1999). To determine whether serum protein binding can be predicted based on physicochemical characteristics of the compounds, the effect of lipophilicity on protein binding was examined. Log fu, s and calculated lipophilicity values (i.e. clogP) of 29 benzimidazole-based FabI inhibitors (Figure 8) showed a strong negative correlation (r2=0.90, p<0.0001), indicating that increased lipophilicity is associated with increased serum protein binding, as would be expected.
Fig. 8.
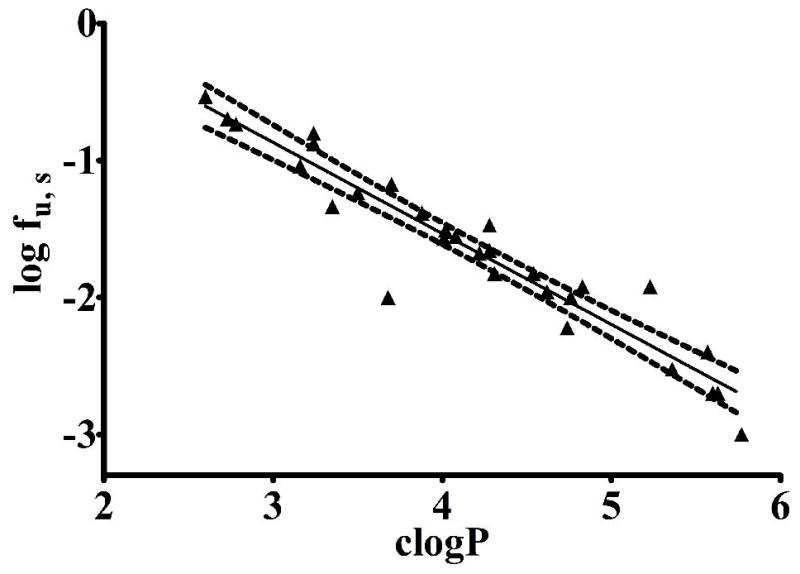
The relationship between the experimental serum free fraction (log fu, s) and the calculated cLogP (generated by ACD/ChemSketch) for 29 FabI inhibitors with N-benzyl-benzimidazole scaffold. The dashed lines represent the 95% confidence interval.
Discussion
Optimization of lead compounds for both better metabolic stability and desired bioactivity is critical in drug development. We have previously established a detailed framework for structure-activity relationships for a series of N-benzyl-benzimidazole FabI inhibitors (Hevener and others 2012; Mehboob and others 2012). Compounds with promising bioactivity were then designed and synthesized, but their metabolic stabilities were unknown. Our objective in this study is to characterize metabolic fates of these N-benzyl-benzimidazole FabI inhibitors and derive their structure-metabolism relationships to guide chemical modifications for better metabolic stability.
Results from microsomal stability assays of 22 benzimidazole analogues using mouse hepatic microsomes showed a wide range of metabolic t1/2 values (Table 1). Based on the data, we developed a preliminary structure-metabolic stability map (Figure 1). The compound showing the longest t1/2 had an amino group at the 2-position (Compound 7); however, this modification was known to lead to decreased bioactivity (Hevener and others 2012) and thus was avoided in further studies. The existence of a methoxy group or methylenedioxy phenyl ring contributed unfavorably to the metabolic stability; in microsomal reactions of two such compounds (Compound 19 and 20), O-demethylated and O-demethylenated products were identified (Figures 4 and 5), indicating that demethylation at the phenyl ring is in part responsible for the short metabolic t1/2. Our metabolite identification analysis also revealed that the phenyl rings of both compounds underwent mono- or di-hydroxylation. Considering that the phenyl ring of these N-benzyl-benzimidazole analogs occupies a deep hydrophobic pocket of the FabI enzyme (Mehboob and others 2012), the resulting hydroxyl metabolites will likely exhibit a great loss in bioactivity. On the other hand, introduction of halogens on the phenol ring seemed to prevent phenolic hydroxylation; for Compound 5 and 16, hydroxylation metabolites at the phenyl ring were not detected (Figures 2 and 3). The phenomenon seems consistent with a previous report that introduction of an electron-withdrawing group on a phenol ring prevents phenolic hydroxylation (Palani and others 2002). The halogen substitution at the phenol ring also improves the bioactivity of N-benzyl-benzimidazole compounds as FabI inhibitors; the previous cocrystal structure of FabI with Compound 16 revealed that the para-chlorine atom on the phenyl ring could form a halogen bond with an amino group within the binding pocket, which favorably contributed to the stability of protein-ligand complexes and thus bioactivity (Hernandes and others 2010). Of note, halogen substitutions at the phenyl ring generally improved the microsomal stability (Compound 4 vs. 1), indicating that halogen substitutions at the phenyl ring of benzimidazole analogs likely improve both bioactivity and metabolic stability.
Our metabolite identification analysis also revealed that mono- or di-hydroxylation at the benzimidazole backbone is the major biotransformation pathway for the N-benzyl-benzimidazole compounds. Incorporation of methyl groups at 6- and 7-positions in the benzimidazole scaffold had little effect on metabolic stability (Table 1); they instead provided additional metabolic hotspots for hydroxylation (Fig 3). Of interest, results from our prior co-crystal structure of F. tularensis FabI complexed with a benzimidazole compound indicate that lipophilic substituents at these positions show improved FabI inhibitory activity and that the size of the active pocket can accommodate large substituents (Mehboob and others 2012). Cyclic modification of the benzimidazole ring was then pursued to improve inhibitory activity as well as metabolic stability, and compounds with a cyclopentane ring were newly synthesized. Compound 23 showed about a 2-fold increase in t1/2 values over its dimethylbenzimidazole counterpart (Compound 13) (Table 2). Encouraged by these findings, we further examined whether such improvement could be obtained with a less lipophilic heterocyclic ring system, such as one containing an oxacyclopentane ring. Decreased lipophilicity of compounds is known to be associated with better metabolic stability (Meanwell 2011). Overall, the oxacyclopentane-containing analogs exhibited improved metabolic stability as compared to dimethylbenzimidazole compounds; however, the metabolic stability was worse or similar as compared to the cyclopentane compounds in spite of the lower clogP values (Tables 1 and 2). Moreover, some of the predictions for microsomal stability based on the SMR map (Figure 1) did not hold true for oxacyclopentane-containing analogs; methoxide and methylenedioxy substitutions in the phenyl ring did not decrease metabolic stability of Compound 29 and 31 (as compared to compound 27). It appears plausible that the metabolic stability of a specific compound is affected by the context of other structural patterns. Together, these results indicate that single physicochemical properties or information of substituent functional groups does not fully explain and predict the microsomal stability data for all benzimidazole compounds included in our study.
Ligand-based QSPR models are considered to be a useful tool for prediction of metabolic stability of lead compounds (Kirchmair and others 2012). While computational models based on diverse chemical structures may be used at global scale (Hu and others 2010), models built from an array of chemicals with a common backbone structure can be useful in differentiating the effects of subtle chemical differences on metabolic stability (Norinder and Bergstrom 2006; Vacondio and others 2011). In this study, using 29 compounds carrying a benzimidazole backbone structure, we developed a QSPR model. Out of 869 molecular descriptors for the compounds, the following 4 descriptors were chosen to best explain CLint, app: MLFER_S, WT.unity, ECCEN, and Wgamma1.unity. MLFER_S is a descriptor for “polarity/polarisability” and was negatively correlated with CLint, app. For example, Compound 30 and 31 differ only by the type of C-4′ substituent at the phenyl ring (i.e. methoxy vs. methyl, respectively for Compound 31 and 30), but Compound 31 has a 2-fold increased MLFER_S value in comparison with Compound 30 (Supplementary Table S2). This may contribute in part to the 13-fold longer microsomal t1/2 of Compound 31. We postulate that increased MLFER_S of compounds leads to better metabolic stability through decreased interaction between the compounds and metabolic enzymes; the dipole interactions between water and polar compounds likely protect the compound from interacting with hydrophobic amino acids within the active site of metabolic enzymes. On the other hand, WT.unity is a descriptor for molecular size while ECCEN and Wgamma1.unity are descriptors for 2D and 3D symmetry, respectively. Inclusion of these descriptors in the final QSPR model indicates that molecular conformation could exert a strong impact on metabolic stability. Multi-linear and nonlinear models developed based on the key descriptors demonstrated high goodness-of-fit for the experimental CLint, app data (Table 3), indicating that the models may be used as a robust surrogate for in vitro microsomal stability experiments, and as a tool to prioritize a large number of compounds for further development.
Conclusions
We have characterized metabolic stability and protein binding properties of 31 active FabI compounds with benzimidazole backbone structure. A structure-metabolism relationship was characterized, and quantitative models for prediction of CLint, app were developed and validated. The resulting models should reveal new avenues for the design of new generation of FabI inhibitors with improved pharmacokinetic behavior.
Supplementary Material
Footnotes
Declaration of interest
This work was supported by National Institutes of Health Grant U01 AI077949.
References
- Boyer D, Bauman JN, Walker DP, Kapinos B, Karki K, Kalgutkar AS. Utility of MetaSite in Improving Metabolic Stability of the Neutral Indomethacin Amide Derivative and Selective Cyclooxygenase-2 Inhibitor 2-(1-(4-Chlorobenzoyl)-5-methoxy-2-methyl-1H-indol-3-yl)-N-phenethyl-ace tamide. Drug Metabolism and Disposition. 2009;37:999–1008. doi: 10.1124/dmd.108.026112. [DOI] [PubMed] [Google Scholar]
- Bush K, Pucci MJ. New antimicrobial agents on the horizon. Biochemical Pharmacology. 2011;82:1528–39. doi: 10.1016/j.bcp.2011.07.077. [DOI] [PubMed] [Google Scholar]
- Chiba M, Ishii Y, Sugiyama Y. Prediction of Hepatic Clearance in Human From In Vitro Data for Successful Drug Development. Aaps Journal. 2009;11:262–76. doi: 10.1208/s12248-009-9103-6. [DOI] [PMC free article] [PubMed] [Google Scholar]
- Davies B, Morris T. PHYSIOLOGICAL-PARAMETERS IN LABORATORY-ANIMALS AND HUMANS. Pharmaceutical Research. 1993;10:1093–5. doi: 10.1023/a:1018943613122. [DOI] [PubMed] [Google Scholar]
- de Oliveira DB, Gaudio AC. BuildQSAR: A new computer program for QSAR analysis. Quant Struct-Act Relat. 2001;19:599–601. [Google Scholar]
- Di L, Keefer C, Scott DO, Strelevitz TJ, Chang G, Bi Y-A, Lai Y, Duckworth J, Fenner K, Troutman MD, et al. Mechanistic insights from comparing intrinsic clearance values between human liver microsomes and hepatocytes to guide drug design. European Journal of Medicinal Chemistry. 2012;57:441–8. doi: 10.1016/j.ejmech.2012.06.043. [DOI] [PubMed] [Google Scholar]
- Di L, Kerns EH, Li SQ, Petusky SL. High throughput microsomal stability assay for insoluble compounds. International Journal of Pharmaceutics. 2006;317:54–60. doi: 10.1016/j.ijpharm.2006.03.007. [DOI] [PubMed] [Google Scholar]
- Golbraikh A, Tropsha A. Beware of q(2)! Journal of Molecular Graphics & Modelling. 2002;20:269–76. doi: 10.1016/s1093-3263(01)00123-1. [DOI] [PubMed] [Google Scholar]
- Gupta RR, Gifford EM, Liston T, Waller CL, Hohman M, Bunin BA, Ekins S. Using Open Source Computational Tools for Predicting Human Metabolic Stability and Additional Absorption, Distribution, Metabolism, Excretion, and Toxicity Properties. Drug Metabolism and Disposition. 2010;38:2083–90. doi: 10.1124/dmd.110.034918. [DOI] [PubMed] [Google Scholar]
- Hagan MT, Menhaj MB. TRAINING FEEDFORWARD NETWORKS WITH THE MARQUARDT ALGORITHM. Ieee Transactions on Neural Networks. 1994;5:989–93. doi: 10.1109/72.329697. [DOI] [PubMed] [Google Scholar]
- Hepburn MJ, Simpson AJH. Tularemia: current diagnosis and treatment options. Expert Rev Anti-Infect Ther. 2008;6:231–40. doi: 10.1586/14787210.6.2.231. [DOI] [PubMed] [Google Scholar]
- Hernandes MZ, Cavalcanti SMT, Moreira DRM, de Azevedo WF, Jr, Lima Leite AC. Halogen Atoms in the Modern Medicinal Chemistry: Hints for the Drug Design. Current Drug Targets. 2010;11:303–14. doi: 10.2174/138945010790711996. [DOI] [PubMed] [Google Scholar]
- Hernandez-Covarrubias C, Vilchis-Reyes MA, Yepez-Mulia L, Sanchez-Diaz R, Navarrete-Vazquez G, Hernandez-Campos A, Castillo R, Hernandez-Luis F. Exploring the interplay of physicochemical properties, membrane permeability and giardicidal activity of some benzimidazole derivatives. European Journal of Medicinal Chemistry. 2012;52:193–204. doi: 10.1016/j.ejmech.2012.03.014. [DOI] [PubMed] [Google Scholar]
- Hevener KE, Mehboob S, Su PC, Truong K, Boci T, Deng JP, Ghassemi M, Cook JL, Johnson ME. Discovery of a Novel and Potent Class of F. tularensis Enoyl-Reductase (FabI) Inhibitors by Molecular Shape and Electrostatic Matching. J Med Chem. 2012;55:268–79. doi: 10.1021/jm201168g. [DOI] [PMC free article] [PubMed] [Google Scholar]
- Hu YB, Unwalla R, Denny RA, Bikker J, Di L, Humblet C. Development of QSAR models for microsomal stability: identification of good and bad structural features for rat, human and mouse microsomal stability. J Comput-Aided Mol Des. 2010;24:23–35. doi: 10.1007/s10822-009-9309-9. [DOI] [PubMed] [Google Scholar]
- Jeong H, Chiou WL. Role of P-glycoprotein in the hepatic metabolism of tacrolimus. Xenobiotica. 2006;36:1–13. doi: 10.1080/00498250500485115. [DOI] [PubMed] [Google Scholar]
- Sahua KAAS, Shaharyara M, Ahmadb N, Anwarb M, Ahmad FJ. Chromatographic separation of piracetam and its metabolite in a mixture of microsomal preparations, followed by an MS/MS analysis. European Journal of Medicinal Chemistry. 2013;65:94–101. doi: 10.1016/j.ejmech.2013.04.053. [DOI] [PubMed] [Google Scholar]
- Kirchmair J, Williamson MJ, Tyzack JD, Tan L, Bond PJ, Bender A, Glen RC. Computational Prediction of Metabolism: Sites, Products, SAR, P450 Enzyme Dynamics, and Mechanisms. Journal of Chemical Information and Modeling. 2012;52:617–48. doi: 10.1021/ci200542m. [DOI] [PMC free article] [PubMed] [Google Scholar]
- Kreuzer PE, Kessler W, Welter HF, Baur C, Filser JG. ENZYME SPECIFIC KINETICS OF 1,2-EPOXYBUTENE-3 IN MICROSOMES AND CYTOSOL FROM LIVERS OF MOUSE, RAT, AND MAN. Arch Toxicol. 1991;65:59–67. doi: 10.1007/BF01973504. [DOI] [PubMed] [Google Scholar]
- Leonard JT, Roy K. On selection of training and test sets for the development of predictive QSAR models. Qsar & Combinatorial Science. 2006;25:235–51. [Google Scholar]
- Meanwell NA. Improving Drug Candidates by Design: A Focus on Physicochemical Properties As a Means of Improving Compound Disposition and Safety. Chemical Research in Toxicology. 2011;24:1420–56. doi: 10.1021/tx200211v. [DOI] [PubMed] [Google Scholar]
- Mehboob S, Hevener KE, Truong K, Boci T, Santarsiero BD, Johnson ME. Structural and Enzymatic Analyses Reveal the Binding Mode of a Novel Series of Francisella tularensis Enoyl Reductase (FabI) Inhibitors. J Med Chem. 2012;55:5933–41. doi: 10.1021/jm300489v. [DOI] [PMC free article] [PubMed] [Google Scholar]
- Norinder U, Bergstrom CAS. Prediction of ADMET properties. Chem Med Chem. 2006;1:920–37. doi: 10.1002/cmdc.200600155. [DOI] [PubMed] [Google Scholar]
- Obach RS. Prediction of human clearance of twenty-nine drugs from hepatic microsomal intrinsic clearance data: An examination of in vitro half-life approach and nonspecific binding to microsomes. Drug Metabolism and Disposition. 1999;27:1350–9. [PubMed] [Google Scholar]
- Oyston PCF, Sjostedt A, Titball RW. Tularaemia: Bioterrorism defence renews interest in Francisella tularensis. Nature Reviews Microbiology. 2004;2:967–78. doi: 10.1038/nrmicro1045. [DOI] [PubMed] [Google Scholar]
- Palani A, Shapiro S, Josien H, Bara T, Clader JW, Greenlee WJ, Cox K, Strizki JM, Baroudy BM. Synthesis, SAR, and biological evaluation of oximino-piperidino-piperidine amides. 1 Orally bioavailable CCR5 receptor antagonists with potent anti-HIV activity. J Med Chem. 2002;45:3143–60. doi: 10.1021/jm0200815. [DOI] [PubMed] [Google Scholar]
- Platts JA, Butina D, Abraham MH, Hersey A. Estimation of molecular linear free energy relation descriptors using a group contribution approach. Journal of Chemical Information and Computer Sciences. 1999;39:835–45. doi: 10.1021/ci990427t. [DOI] [PubMed] [Google Scholar]
- Pohanka M, Skladal P. Bacillus anthracis, Francisella tularensis and Yersinia pestis. The most important bacterial warfare agents - review. Folia Microbiologica. 2009;54:263–72. doi: 10.1007/s12223-009-0046-1. [DOI] [PubMed] [Google Scholar]
- Sakiyama Y, Yuki H, Moriya T, Hattori K, Suzuki M, Shimada K, Honma T. Predicting human liver microsomal stability with machine learning techniques. Journal of Molecular Graphics & Modelling. 2008;26:907–15. doi: 10.1016/j.jmgm.2007.06.005. [DOI] [PubMed] [Google Scholar]
- Sharma V, Goswami R, Madan AK. Eccentric connectivity index: A novel highly discriminating topological descriptor for structure-property and structure-activity studies. Journal of Chemical Information and Computer Sciences. 1997;37:273–82. [Google Scholar]
- Stepan AF, Karki K, McDonald WS, Dorff PH, Dutra JK, DiRico KJ, Won A, Subramanyam C, Efremov IV, O’Donnell CJ, et al. Metabolism-Directed Design of Oxetane-Containing Arylsulfonamide Derivatives as gamma-Secretase Inhibitors. J Med Chem. 2011;54:7772–83. doi: 10.1021/jm200893p. [DOI] [PubMed] [Google Scholar]
- Todeschini R, Gramatica P. New 3D molecular descriptors: The WHIM theory and QSAR applications. Perspect Drug Discov Design. 1998;9–11:355–80. [Google Scholar]
- Vacondio F, Silva C, Lodola A, Carmi C, Rivara S, Duranti A, Tontini A, Sanchini S, Clapper JR, Piomelli D, et al. Biphenyl-3-yl alkylcarbamates as fatty acid amide hydrolase (FAAH) inhibitors: Steric effects of N-alkyl chain on rat plasma and liver stability. European Journal of Medicinal Chemistry. 2011;46:4466–73. doi: 10.1016/j.ejmech.2011.07.021. [DOI] [PMC free article] [PubMed] [Google Scholar]
- Wen L, Chmielowski JN, Bohn KC, Huang J-K, Timsina YN, Kodali P, Pathak AK. Functional expression of Francisella tularensis FabH and FabI, potential antibacterial targets. Protein Expression and Purification. 2009;65:83–91. doi: 10.1016/j.pep.2008.11.011. [DOI] [PubMed] [Google Scholar]
- Wright HT, Reynolds KA. Antibacterial targets in fatty acid biosynthesis. Current Opinion in Microbiology. 2007;10:447–53. doi: 10.1016/j.mib.2007.07.001. [DOI] [PMC free article] [PubMed] [Google Scholar]
- Yap CW. PaDEL-Descriptor: An Open Source Software to Calculate Molecular Descriptors and Fingerprints. J Comput Chem. 2011;32:1466–74. doi: 10.1002/jcc.21707. [DOI] [PubMed] [Google Scholar]
Associated Data
This section collects any data citations, data availability statements, or supplementary materials included in this article.