Abstract
Photoacoustic spectrum analysis (PASA) has demonstrated the capability of identifying the microstructures in phantoms and biological tissues. PASA adopts the procedures in ultrasound (US) spectrum analysis although the signal generation mechanisms related to ultrasound backscatter and photoacoustic wave generation differ. The purpose of this study is to theoretically validate the method of PASA. The analytical solution to the power spectrum of PA signals generated by identical microspheres following discrete uniform random distribution in space was derived. The simulation and experiment validation of analytical solution include: 1) the power spectrum profile of a single microsphere with a diameter of 300 μm; and 2) the PASA parameters of the PA signals generated by randomly distributed microspheres of diameters of 100, 200, 300, 400 and 500 μm, and at concentrations of 30, 60, 120, 240, 480 per 1.53cm3 in the observation range of [0.5, 13MHz].
Keywords: photoacoustics, spectrum analysis, tissue characterization, quantitative imaging
INTRODUCTION
Traditional photoacoustic (PA) imaging focuses on the macroscopic signal contour, or equivalently the low frequency signal components, as a reflection of the macroscopic optical absorption (Wang and Hu 2012). The relatively insignificant fluctuations included in the PA signals, or namely the high frequency components, also encode the microscopic spatial information within the volume under investigation (Kumon et al. 2011; Xu et al. 2012; Yang et al. 2012; Wang et al. 2013; Xu et al. 2014). The frequency domain analysis of PA signals or namely PA spectrum analysis (PASA) is an innovative imaging technology that has been recently investigated for the non-invasive examination of the microstructures in phantoms (Xu et al. 2012; Yang et al. 2012) and biological tissues (Kumon et al. 2011; Patterson et al. 2011; Saha and Kolios 2011; Hysi et al. 2012; Strohm et al. 2013; Patterson et al. 2014; Xu et al. 2014).
PASA follows most of the procedures of ultrasound (US) spectrum analysis (USSA) (Lizzi et al. 1983; Lizzi et al. 2003). In PASA (Kumon et al. 2011; Xu et al. 2012), the frequency domain power spectrum of time-domain PA signals is first calculated. A frequency range, usually from less than 1MHz to the frequency where the power spectrum falls below noise floor, is afterwards selected for quantitative analysis. The signal power spectrum within the selected frequency range is fit to a linear model. The slope, intercept and midbandfit values of the linear model are used to characterize the frequency components in the PA signal, or equivalently the microstructures of the sample under observation. The slope of the linear model represents the magnitude of high frequency components in comparison to that of the low frequency ones. Larger slope value represents larger magnitudes of the high frequency components. Intercept and midband-fit (the magnitude of the linear model at the center of the observed frequency range) represent the zero-frequency and averaged magnitude of the signal power spectrum, respectively.
PASA has successfully characterized the microstructure changes in prostate (Kumon et al. 2011; Patterson et al. 2014) and liver (Patterson et al. 2011; Xu et al. 2014) tissues, and the morphology changes of red blood cells (Saha and Kolios 2011; Hysi et al. 2012; Strohm et al. 2013). Taking advantage of the unique optical absorption spectrum of each chemical substance, PASA has also shown the capability in identifying the distribution of individual chemical components, such as hemoglobin and lipid, in liver tissues (Xu et al. 2014). A recent study (Chitnis et al. 2014) presented an analytical solution to the power spectrum of PA signal generated by a single spherical absorber. The model has shown correlations to the PA signal power spectrum profiles in experimental measurements. By fitting the model to the experiment measurements, the model has also shown the capability of estimating the dimensions of the PA sources. In this study, a more rigorous, explicit analytical model of the PA signal power spectrum will be derived. The derived model facilitates the accurate solution for the dimensions of a PA source by its signal power spectrum.
The analytical solution to US signal power spectrum has been derived (Lizzi et al. 1983; Lizzi et al. 1987). The derivation decomposed the US signal spectrum into a series of factors and investigated the contribution of each factor individually. Since the signal receiving devices in US and PA imaging systems are identical, part of the analytical solution to USSA can be directly adopted by PASA. The major difference between USSA and PASA is the source spectrum profiles due to the distinctive signal generation mechanisms. This study will focus on the simple case of spherical PA sources.
Following the methodology used in USSA (Lizzi et al. 1983; Lizzi et al. 1987), the derivation of the analytical model of PA signal power spectrum will first decompose the power spectrum as the convolution between the source profile and a series of spatial dependent components. The analytical expression of each spectral component will be explicitly derived. The components in combination will be used to quantify the signal power spectrum and the corresponding PASA parameters. Similar to USSA (Lizzi et al. 1983; Lizzi et al. 1987), all derivations are under the assumption that the absorbing structures are randomly distributed. The analytical solution will be validated by simulation and experiment results.
THEORY
The PA signal received by an US transducer, presented in spherical coordinates (Xu and Wang 2006), is:
| (1) |
where r′, θ′ and ϕ′ are the radial, azimuthal and polar coordinates in the spherical system, respectively; vs is the speed of sound; P0 is the original pressure at the surface of the PA source; r is the position of the detection surface of the US transducer and r′ is the position of the source sphere; g is the gating function to ensure that only the signal from the spatial range of r1′ and r2′ are evaluated; D2 is the directivity function representing the receiving efficiency in θ′ and ϕ′ directions:
| (2) |
where d is the diameter of the receiving surface of the transducer and λ is received wavelength.
The terms in the square brackets in Eq. (1) represent the signal profile determined by the source geometry and spatial distribution. As mentioned in the introduction, the PA sources in each case of this study have identical spherical geometry and follow discrete uniform random distribution in space. When a spherical optical absorbing sphere is heated by optical energy, an inward and an outward going pressure disturbance at the surface of the sphere in combination formulate an N-shape signal profile in time domain. The N-shape profile can be expressed as (Hoelen and de Mul 1999):
| (2) |
where A is the amplitude of the N-shape profile. The terms in the square brackets in Eq. (1) can thereby be replaced by the convolution of the N-shape signal profile convoluted by a series of pulse functions:
| (3) |
where U is the discrete uniform random distribution function, α is the frequency-dependent depth attenuation of the PA signals. Since the separation of the microspheres are relatively small comparing to the distance between the region-of-interest and the detector surface, α(ω,|r̄′− r|) is approximated as a series of values which are constant with respect to the average propagation distance |r̄′− r|. The α values represent the attenuation of signal power along the propagation path. The square roots of the α values are thereby used in Eq. (3) for the attenuation of signal magnitudes. Substituting the square brackets in Eq. (1) by Eq. (3) leads to:
| (4) |
Rearranging Eq. (4) by extracting the source profile from the spherical integration:
| (5) |
The PA signal is thereby decomposed into two parts: 1) the source profile considering the frequency domain attenuation; and 2) the integration which is only determined by the spatial factors including the spatial distribution of the PA sources, the spatial directivity function of the US transducer, and gating function. We thereby define the integration in Eq. (5) as Spatial (r′, t):
| (6) |
The power spectrum of a signal is the square of its Fourier transform:
| (7) |
where “conj” in is short for conjugate. Utilizing the property that the Fourier transform of convolution in time domain is equivalent to dot product in frequency domain:
| (8) |
Rearranging Eq. (8) leads to:
| (9) |
Using the correlation between Fourier transform and convolution, Eq. (9) has the time-domain integral form of:
| (10) |
where RNshape and RSpatial represent the autocorrelations of Nshape(t) and Spatial(r′, t). The autocorrelation of the source profile in Eq. (3) is:
| (11) |
The explicit expression of Eq. (11) is:
| (12) |
The contribution of the source profile to the power spectrum is thereby:
| (13) |
The explicit solution of Eq. (13) is:
| (14) |
Rearranging Eq. (14) into trigonometric identities:
| (15) |
Rearranging Eq. (15) to a simple format:
| (16) |
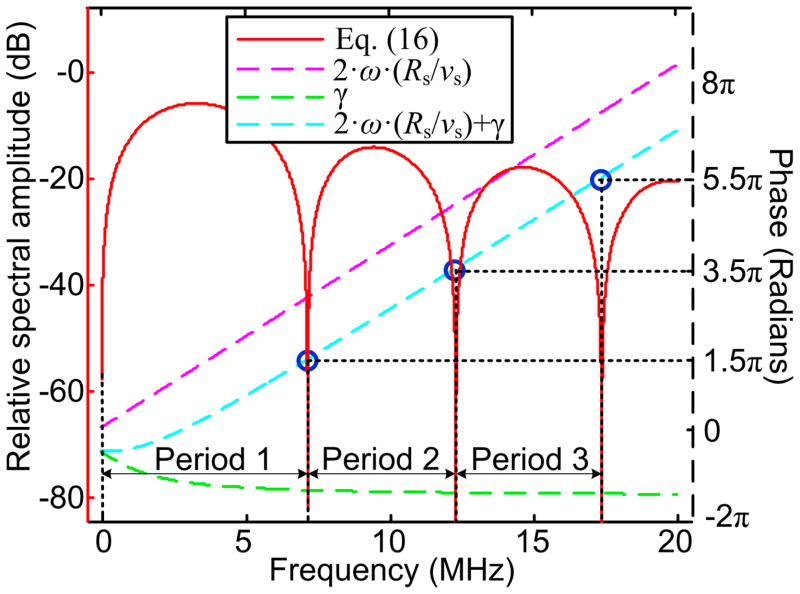
where . The argument of the sine function in Eq. (16), [2ω · (Rs/vs) + γ], determines the phase of the magnitude fluctuation of the equation.
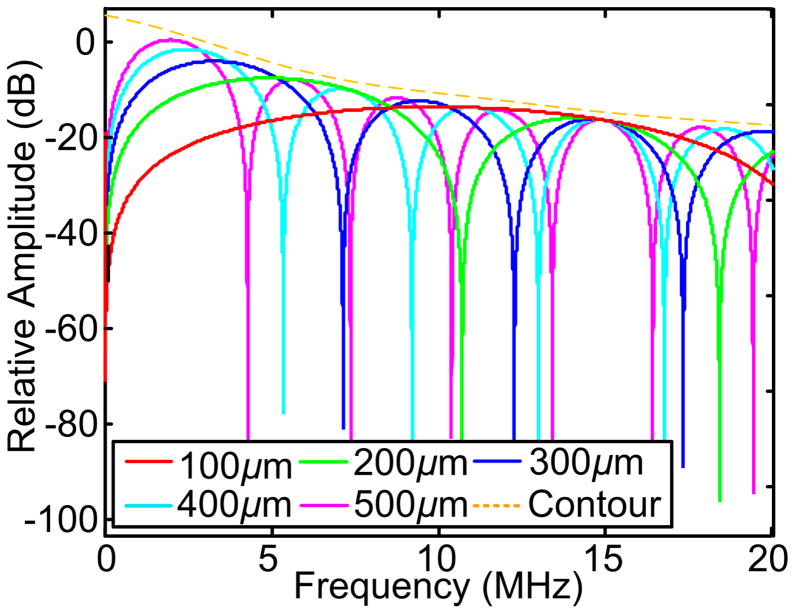
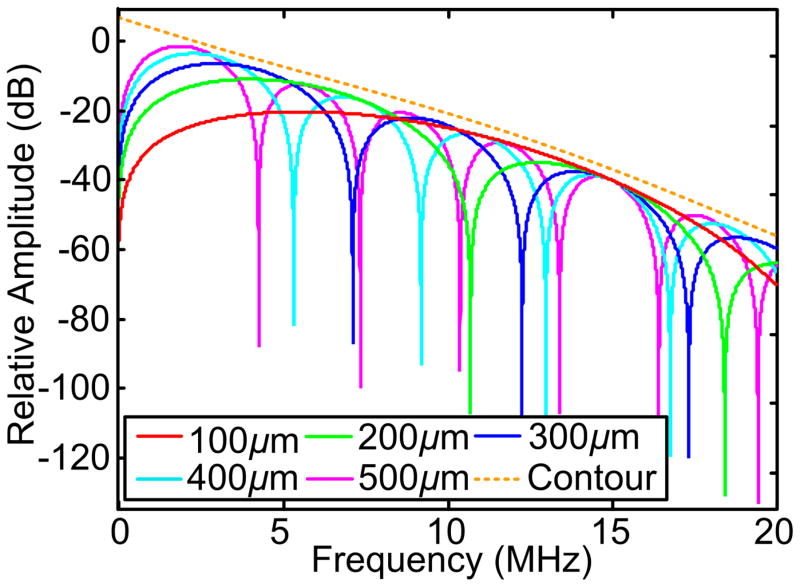
Figure 1 shows the evaluation of Eq. (16) at Rs=150μm (diameter of 300 μm) and vs=1500 m/s within the frequency range of 0 to 20 MHz. 2ω ·(Rs/vs), γ and [2ω · (Rs/vs) + γ] were also evaluated with respect to the frequencies to demonstrate the correlation between the fluctuation period of Eq. (16) and Rs. Figure 2 shows the evaluation of Eq. (16) with Rs of 100 to 500 μm with intermittence of 100 μm in the range of 0 to 20 MHz. The power spectra were normalized by A2 for directly comparing the fluctuations and the descending of the spectral magnitude along the frequency axis.
Fig. 1.
Power spectrum of a spherical PA source. Eq. (16) was evaluated at Rs=150 μm (diameter 300 μm) and vs=1500m/s, with magnitudes specified on left vertical axis. The phase components in Eq. (16), 2ω ·(Rs/vs), γ and [2ω ·(Rs/vs) + γ] were also evaluated within the frequency range of [0,20] MHz. When Eq. (17) is satisfied, the magnitude of the power spectrum becomes zero. These zero points, when converted to logarithmic scale, become negative infinite and formulate the dip points in the power spectrum.
Fig. 2.
Power spectra of microspheres with varied diameters. The power spectra were normalized by the squared magnitude of the PA signals for the direct comparison among the spectral contours. (a) and (b) are power spectra without and with frequency attenuation, respectively. The frequency-dependent attenuation (α) is proportional to the square of the frequency (f2) and the propagation distance (Pinkerton 1949). In our previous study (Xu et al. 2012), the (α/f2) value of 8% porcine gel phantom at 20 °C was estimated at 750 according to (Pinkerton 1949). The local maxima of the spectra follow similar descending rate as indicated by the orange dashed line.
The three multiplication factors in Eq. (16) were individually analyzed in comparison to the plots in Figs. 1 and 2 for understanding the microstructure information encoded in the signal power spectrum.
A2 is proportional to the optical energy receivd by a microsphere. According to the bilateral illumination geometry to in our study (Xu et al. 2012), the optical energy absorbed by a microsphere should be proportional to the area of its cross-section, or equivalently .
-
1+sin [2ω ·(Rs/vs) + γ] is a fluctuating term with values in the range of [0, 2]. The width of the fluctuation periods, as marked in Fig. 1, or the distance between the zeros points, can be used to estimate the dimension of a single PA source. The fluctuation term reaches zeros points when:
(17) Note that the value of γ, as explicitly expressed in Eq. (16), varies with respect to the frequencies and the PA source radius. Figure 1 shows that γ becomes relatively invariant beyond the first fluctuation period. The power spectra of 300, 400 and 500 μm microspheres in Fig. 2 also show that the fluctuation periods are close to constant starting from the second period. The PA source dimension thereby can be approximated by:(18) where ωn+1 − ωn is the width of one spectral period.
[ ] describes the descending contour of the signal power spectrum. is the dominant term due to its larger magnitude over when Rs is in the μm scale. The upper contour of the power spectrum, as delineated by the orange dashed curve in Fig. 2 is thereby nearly independent of the dimensions of the PA sources.
Similar to the derivation in USSA (Lizzi et al. 1987), the contribution of the spatial factors in Eq. (6) to the PA power spectrum can be expressed as:
| (19) |
where RU, Rd and Rg are the autocorrelations of the discrete unique random distribution function, the directivity and gating function in spatial domain, respectively. According to a previous study in USSA (Lizzi et al. 1987), the Rd and Rg are system specific and can be considered constant when the source dimension is within ten-to hundred-micron level. Rd and Rg can be determined by calibration measurements. Eq. (19) thereby becomes:
| (20) |
where sp_D and sp_g are the contribution of the directivity and gating functions to the total power spectrum, respectively. The discrete uniform random distribution function U consists of a series of delta functions with random spatial or equivalently temporal positions. The power spectrum of such function, as reported in a previous study (Heiden 1969), is in a flat profile with magnitude proportional to the number of the delta functions:
| (21) |
The magnitude of the PA signal power spectrum generated by n identical and randomly distributed microspheres can thereby be estimated by:
| (22) |
where k is the constant system factor including the directivity and gating functions, and the specific heat capacity at constant pressure as well as thermo expansion coefficient of the microspheres material. is the cross-section of a PA source. Therefore, the magnitudes of the PA signal power spectra 1) increase linearly with respect to the number of PA sources; and 2) are proportional to the square of the diameters of the PA sources.
SIMULATION AND EXPERIMENT SETUP
The analytical model was validated by simulations and experiments in: 1) describing the signal power spectra generated by a single microsphere; and 2) estimating the PASA parameters for quantifying the dimensions and concentrations of multiple, identical microspheres following discrete uniform random distribution.
In simulation, Eq. (2) was used to describe the PA signal from a single PA source. The PA signals of multiple PA sources were generated by the convolution of a series of delta functions with randomly generated delta function positions and the N-shape profile in Eq. (2).
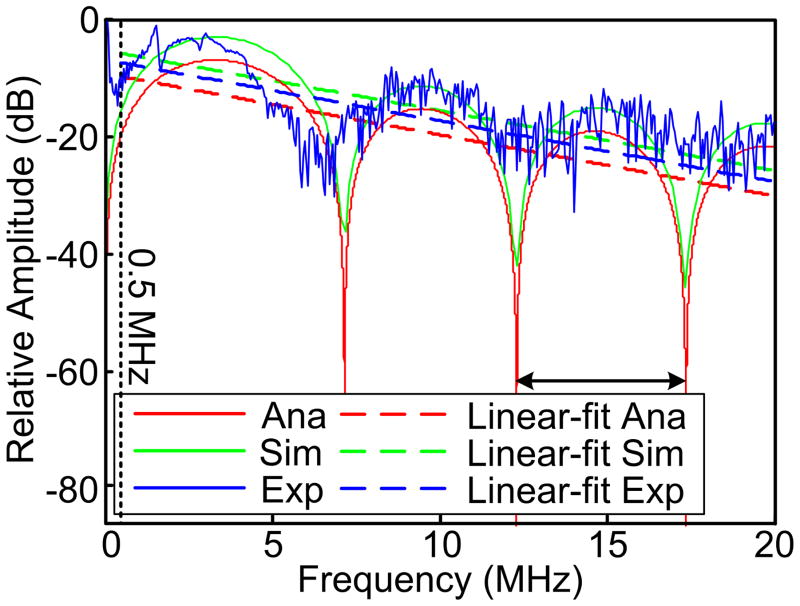
In the actual experimental measurement, PA signal from a 300-μm-diamter microsphere was acquired in an experiment setup similar to those in our previous study (Xu et al. 2012). The illumination source in the experiement setup was a Q-switched Nd-YAG laser (PrecisionLite DLS 8010, Continuum, San Jose, CA) with output power of 800 mJ per pulse at 532 nm and pulse duration of 5 ns. A needle hydrophone (HNC-1500, ONDA Co., Sunnyvale, CA) with detection bandwidth of 20 MHz was positioned 10 mm away from the microsphere. The power spectrum of the PA signal was calibrated by the system frequency response and the frequency-dependent attenuation along the propagation path. The power spectra by the three methods were fit to linear models in the range of [0.5, 20] MHz, as shown in Fig. 3. The extremely low frequency components were not considered due to the limited receiving bandwidth of our measurement system.
Fig. 3.
Power spectra of the PA signals generated by a single microsphere with diameter of 300 μm and the corresponding linear-fit. The power spectra were normalized by the squares of the maximum signal magnitudes for direct comparison among the spectral contours. The experimental power spectrum was calibrated by the frequency-dependent attenuation.
PA signals from phantoms with randomly distributed microspheres in (Xu et al. 2012) were reproduced in this study. During the phantom fabrication in (Xu et al. 2012), the hot porcine gel and microspheres were sealed in a container. The container was kept rotating until the porcine gel coagulated. Such fabrication procedures produced random microsphere distribution in the phantom volume. The phantom was located 30 mm away from the hydrophone during the experiment. PASA was implemented to the spectral range of [0.5, 13MHz] as the experiment results in (Xu et al. 2012) fell below the noise floor beyond 13MHz. To facilitate the comparison of the power spectra derived from the analytical solution to the experiment and simulation, previously mentioned frequency-dependent attenuation was implemented to the analytical solution.
The signal power spectra in the simulations and experiments were calculated as the square of the discrete fourier transform of the PA signals in MATLAB (R2011b, MathWorks, Natick, MA). Since both the midband-fit and the intercept represent the magnitude of the analyzed PA signal power spectrum, this study only the shows the midband-fit along with slope values.
RESULTS
Figure 3 shows good agreement among the signal power spectra produced by the analytical solution, the simulation and the experiment measurements. The power spectra were difficult to perfectly match probably due to: 1) the voxelization of the microsphere in the simulation slightly distorted its geometry; 2) the discrete samplings in simulations and experiments reduced the bandwidths of the original signals and thereby contributed to the less distinctive “dips” in the power spectra comparing to those in the analytical model; and 3) inhomogeneous distribution of optical energy in the microsphere in the experiments could not produce a perfect signal contour described by Eq. (2). The periods in the high frequency range of the experimental power spectrum are observable but almost overwhelmed by the system noise. The linear-fits to the power spectra acquired by the three methods are almost parallel, indicating that the slope could be another reliable parameter for quantifying the microsphere dimension in actual measurements in addition to the fluctuation periods in Eq. (18).
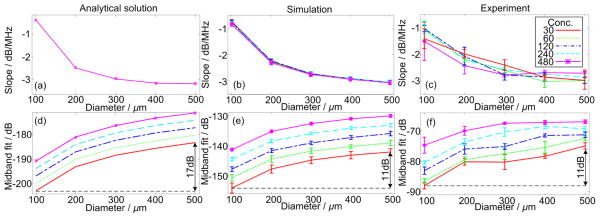
Figure 4(a)–(c) have shown prominent matching among the slopes derived by the three methods. Since the slope is independent of the source concentration, the curves at the five concentrations overlap in Fig. 4(a). Similar to the observations in Fig. 3, Fig. 4 also indicates that the slope value could be an alternative to the spectral periods described by Eq. (18) for quantifying the PA source dimensions.
Fig. 4.
The variation trends of the spectral slope and midband-fit values with respect to the diameters and concentrations of the microspheres. Conc. in the legend stands for concentration. The numbers in the legend are the numbers of microspheres per 1.53cm3 volume (Xu et al. 2012). In (a), the curves for the concentrations overlap as the slope values do not vary with respect to the concentrations. The variation ranges of the midband-fit values are annotated in (d)–(f).
The uncertainty of the common system factor k in Eq. (22) leads to the differences in the absolute spectral magnitudes among Fig. 4(d)–(f). The relative changes could suffice for the validation of the analytical model. As predicted by Eq. (22), the variations of mindband-fit with respect to PA source dimensions in Fig. 4(d)–(f) follow approximately a quadratic trend versus the diameter of the PA sources. The parallel and evenly separated curves in Fig. 4(d)–(f) also agree with Eq. (22) which has explicitly shown the linear correlation between the increase of the PA source concentration and the spectral magnitude. However, the variations of midband-fit versus source diameters in analytical model demonstrate larger dynamic ranges comparing to those in simulations and experiments. According to Eq. (22), at identical concentration and system factors, the difference between the midband-fit values of 100 μm and 500 μm should be . In Fig. 4, analytical model shows a difference of 17dB whereas the simulation and experiment show differences of 11dB. Such inaccuracy could relate to the ignorance of the frequency-dependent attenuation in Eq. (22). The overestimation in the analytical model could be due to that the smaller microspheres generate more high frequency components and their spectral magnitudes are more attenuated than those of the larger ones along the propagation path. Such non-uniform attenuation (Xu et al. 2012) to the power spectra generated by microspheres of different sizes leads to the larger dynamic range of the curves derived by the analytical model. On the other hand, the discretization in simulation and system noise level in experiment reduced the high frequency features in the time-domain PA signals, for example, the “dips” between the periodical features Fig. 3. The loss of high frequency components makes the contribution of frequency-dependent attenuation less prominent. Figure 4(e) and (f) thereby show less dynamic range than the analytical model in Fig. 4(d).
DISCUSSION
The contribution of ringdown phenomenon to the PA signal spectrum was not investigated in this study. The ringdown could be generated by the acoustic wave reverberation within the microspheres or between the surfaces of the US transducer and the microspheres (Hindi et al. 2013). One of the contributions of ringdown to the PA signals in this study could be a low frequency (below 1MHz) contour modulated by the intrinsic frequencies of the PA source (Xu et al. 2012). Since the low frequency range was truncated, the contribution of the ringdown to the power spectrum was ignored. The comparison of the results in Fig. 3 and 4 agree with such approximation.
Although the periodical fluctuations of the power spectra could provide more accurate quantification for the PA source dimensions, in more realistic scenario where the PA source dimensions are not uniform, the fluctuation periods in the power spectra could be hardly observable.
The PASA could provide more robust characterization of the microscopic features in biological tissues by estimating the averaged dimensions and concentrations of the PA sources. The randomly distributed microspheres with dimensions of hundreds of microns in this study are good comparatives to the clusters of lipid infiltrated liver cells diffusively distributed in fatty liver. Our previous study has verified the capability of PASA in differentiating the fatty livers from the normal ones (Xu et al. 2014) by the lipid distribution. By extending the analytical model to higher frequency range, PASA could characterize PA sources with even smaller dimensions. For instance, the morphology of red blood cell, at the dimension of 5 to 10 microns, has been quantified by PASA with US transducers with frequency bandwidth up to 1 GHz (Strohm et al. 2013). It should be noted that Eq. (6) could produce close match to PA signal power spectra in the finite element simulation and experiment results reported by another group (Strohm et al. 2013).
CONCLUSION
The explicit analytical solution to the PA signal power spectrum is derived and validated by simulations and experiments. Instead of using model fitting to estimate the dimensions of the optical absorbers (Chitnis et al. 2014), the analytical models have shown the capability of explicitly solving for the dimensions of optical absorbers by their PA signal power spectra. The analytical model is also examined in predicting the PASA parameters. The theoretical basis of PASA is fundamentally justified.
Acknowledgments
This study is supported by the National Institutes of Health grant R01AR060350, American Heart Association grant 14POST17840001, National Natural Science Foundation of China under grants number 11028408.
Footnotes
Publisher's Disclaimer: This is a PDF file of an unedited manuscript that has been accepted for publication. As a service to our customers we are providing this early version of the manuscript. The manuscript will undergo copyediting, typesetting, and review of the resulting proof before it is published in its final citable form. Please note that during the production process errors may be discovered which could affect the content, and all legal disclaimers that apply to the journal pertain.
References
- Chitnis PV, Mamou J, Feleppa EJ. Spectrum analysis of photoacoustic signals for characterizing lymph nodes. The Journal of the Acoustical Society of America. 2014;135:2372. [Google Scholar]
- Heiden C. Power Spectrum of Stochastic Pulse Sequences with Correlation between the Pulse Parameters. Physical Review. 1969;188:319–26. [Google Scholar]
- Hindi A, Peterson C, Barr RG. Artifacts in diagnostic ultrasound. Reports in Medical Imaging. 2013:6. [Google Scholar]
- Hoelen CGA, de Mul FFM. A new theoretical approach to photoacoustic signal generation. The Journal of the Acoustical Society of America. 1999;106:695–706. [Google Scholar]
- Hysi E, Saha RK, Kolios MC. Photoacoustic ultrasound spectroscopy for assessing red blood cell aggregation and oxygenation. Journal of Biomedical Optics. 2012;17:125006. doi: 10.1117/1.JBO.17.12.125006. [DOI] [PubMed] [Google Scholar]
- Kumon RE, Deng CX, Wang X. Frequency-Domain Analysis of Photoacoustic Imaging Data From Prostate Adenocarcinoma Tumors in a Murine Model. Ultrasound in Medicine & Biology. 2011;37:834–9. doi: 10.1016/j.ultrasmedbio.2011.01.012. [DOI] [PMC free article] [PubMed] [Google Scholar]
- Lizzi FL, Feleppa EJ, Kaisar Alam S, Deng CX. Ultrasonic spectrum analysis for tissue evaluation. Pattern Recognition Letters. 2003;24:637–58. [Google Scholar]
- Lizzi FL, Greenebaum M, Feleppa EJ, Elbaum M, Coleman DJ. Theoretical framework for spectrum analysis in ultrasonic tissue characterization. The Journal of the Acoustical Society of America. 1983;73:1366–73. doi: 10.1121/1.389241. [DOI] [PubMed] [Google Scholar]
- Lizzi FL, Ostromogilsky M, Feleppa EJ, Rorke MC, Yaremko MM. Relationship of Ultrasonic Spectral Parameters to Features of Tissue Microstructure. Ultrasonics, Ferroelectrics and Frequency Control, IEEE Transactions on. 1987;34:319–29. doi: 10.1109/t-uffc.1987.26950. [DOI] [PubMed] [Google Scholar]
- Patterson MP, Riley CB, Kolios MC, Whelan WM. Optoacoustic characterization of prostate cancer in an in vivo transgenic murine model. Journal of Biomedical Optics. 2014;19:056008. doi: 10.1117/1.JBO.19.5.056008. [DOI] [PubMed] [Google Scholar]
- Pinkerton JMM. The Absorption of Ultrasonic Waves in Liquids and its Relation to Molecular Constitution. Proceedings of the Physical Society Section B. 1949;62:129. [Google Scholar]
- Saha RK, Kolios MC. A simulation study on photoacoustic signals from red blood cells. The Journal of the Acoustical Society of America. 2011;129:2935–43. doi: 10.1121/1.3570946. [DOI] [PubMed] [Google Scholar]
- Strohm EM, Berndl ES, Kolios MC. Probing red blood cell morphology using high-frequency photoacoustics. Biophysical Journal. 2013;105:59–67. doi: 10.1016/j.bpj.2013.05.037. [DOI] [PMC free article] [PubMed] [Google Scholar]
- Wang LV, Hu S. Photoacoustic Tomography: In Vivo Imaging from Organelles to Organs. Science. 2012;335:1458–62. doi: 10.1126/science.1216210. [DOI] [PMC free article] [PubMed] [Google Scholar]
- Wang S, Tao C, Wang X, Liu X. Quantitative detection of stochastic microstructure in turbid media by photoacoustic spectral matching. Applied Physics Letters. 2013;102:114102–4. [Google Scholar]
- Xu G, Dar IA, Tao C, Liu X, Deng CX, Wang X. Photoacoustic spectrum analysis for microstructure characterization in biological tissue: A feasibility study. Applied Physics Letters. 2012;101:221102–5. doi: 10.1063/1.4768703. [DOI] [PMC free article] [PubMed] [Google Scholar]
- Xu G, Meng Z-X, Lin JD, Yuan J, Carson PL, Joshi B, Wang X. The Functional Pitch of an Organ: Quantification of Tissue Texture with Photoacoustic Spectrum Analysis. Radiology. 2014:130777. doi: 10.1148/radiol.13130777. [DOI] [PMC free article] [PubMed] [Google Scholar]
- Xu M, Wang LV. Photoacoustic imaging in biomedicine. Review of Scientific Instruments. 2006;77:041101–22. [Google Scholar]
- Yang Y, Wang S, Tao C, Wang X, Liu X. Photoacoustic tomography of tissue subwavelength microstructure with a narrowband and low frequency system. Applied Physics Letters. 2012;101:034105–5. [Google Scholar]


