Abstract
The chemokine RANTES plays a key role in inflammation, cell recruitment and T cell activation. RANTES is heterogenic and exists as multiple variants in vivo. Herein we describe the development and characterization of a fully quantitative mass spectrometric immunoassay (MSIA) for analysis of intact RANTES and its proteoforms in human serum and plasma samples. The assay exhibits linearity over a wide concentration range (1.56 – 200 ng/mL), intra- and inter-assay precision with CVs <10%, and good linearity and recovery correlations. The assay was tested in different biological matrices, and it was benchmarked against an existing RANTES ELISA. The new RANTES MSIA was used to analyze RANTES and its proteoforms in a small clinical cohort, revealing the quantitative distribution and frequency of the native and truncated RANTES proteoforms.
Keywords: chemokine, mass spectrometric immunoassay, RANTES, quantitative analysis
Introduction
Chemokines are small proteins that chemo-attract different subsets of leukocytes and play complex roles in coordination of the immune response. Chemokines play important role in inflammation, although more diverse biological activities have been reported [1–5]. Based on the position of the two N-terminal cysteine residues, chemokines are classified in 4 groups: C-, CC-, CXC- and CX3C [6].
RANTES (Regulated on Activation, Normal, T-cell Expressed and Secreted) is a member of the CC chemokine group (hence the alternative name - CCL5). It binds to four of the CC- G-protein coupled receptors, CCR1, CCR3, CCR4 and CCR5 [7–9], and the DARC receptor [10]. RANTES is released from activated macrophages and T-lymphocytes, endothelial and epithelia cells, dermal fibroblast and renal tubular epithelium [10–12]. RANTES functional role has been demonstrated in association with autoimmune diseases [13], arthritis [14], diabetes [15], obesity and metabolic syndrome [16] and breast and cervical cancer [17]. In recent years RANTES and its proteoforms have been associated with cardiovascular diseases, including unstable carotid plaque [18] acute coronary syndrome [19] and atherosclerosis [20, 21]. RANTES may also play a role in fighting viral infections, including respiratory syncytial virus [22], influenza virus [23–25] and indirectly contributes to targeting anti-HIV infection therapies [12].
RANTES bioactivity has historically been associated with the full-length protein form, which is composed of 68 amino acids, has two intact disulfide bonds and a molecular mass of 7,847 Da [14]. The biological activity is modulated by at least two pathways of posttranslational proteolysis [26]. The first is mediated by a regulatory enzyme, dipeptidyl peptidase-IV (DPP IV), present on surface of many cell types, including activated T cells. This enzyme catalyzes the removal of two N-terminal amino acids, producing a cleaved RANTES (3–68) variant [27, 28]. The second pathway results from cathepsin G activity in neutrophils and monocytes, which produces an additional proteoform (4–68) [26, 29]. It has been shown that such processing not only modulates RANTES activity, but it also introduces different protein properties [30, 31]. This structure-function relationship necessitates development and utilization of RANTES analysis methods that will provide information about both the qualitative and quantitative distribution of RANTES and its proteoforms.
The primary methods for quantification of RANTES are commercially available immunoassays (i.e., ELISA) [10, 32]. Other customized assays utilize epitope specific antibodies towards one of the two variants produced by enzymatic cleavage, truncated variants (3–68) or (4–68) [28]. These ELISA methods, however, don’t have the capability to unambiguously detect or differentiate other unanticipated (i.e., not known a priori) posttranslational modified RANTES variants, or simultaneously measure multiple proteoforms in a single assay. In the last few decades, mass spectrometry (MS) has emerged as a powerful analytical technique for protein analysis. Through combination of immunoaffinity enrichment and MS detection [33–37], several novel MS-based methodologies have been developed - SELDI-MS [38], SISCAPA [39, 40], iMALDI [41], SILAC [42], that can provide more detailed protein analyses.
The Mass Spectrometric Immunoassay (MSIA) is a top-down MS-based approach that combines micro-scale immunoaffinity separation with mass spectrometric detection [43]. Antibodies towards targeted proteins are attached to porous micro columns fitted at the entrance of a pipette tip, and enable for proteins affinity extraction directly from a biological sample. After the affinity capture, proteins are eluted either directly onto a target plate for MALDI-TOF MS analysis [44], or with a small volume of elution solution for subsequent LC-ESI MS analysis [45]. When optimized, MSIA can provide detailed insights into the intrinsic protein characteristics, and has thus far been incorporated in numerous qualitative and a handful of fully quantitative assays [46–50]. We have previously developed a qualitative RANTES MSIA assay for high-throughput analysis of RANTES and its proteoforms [14]. The assay was used in screening a small population (~ 240 patients; healthy and diseased), in which the presence of previously identified variants was confirmed, and several new variants were discovered.
We now describe a quantitative MSIA for measuring RANTES and its variants in human plasma and serum samples, utilizing met-RANTES as internal reference standard for quantification. The method was characterized, verified, compared to commercially available ELISA, and employed in RANTES profiling of a small cohort of human plasma samples.
Materials and Methods
Reagents
Monoclonal mouse, anti-human CCL5/RANTES antibody, clone # 16411(Cat. No. MAB2781), recombinant human CCL5/RANTES protein (278-RN-010/CF), recombinant human CCL5/Met-RANTES protein (335-RM-025/CF) and Quantikine Human CCL5/RANTES Immunoassay (ELISA) kit (DRN00B) were obtained from R&D Systems Inc. (Minneapolis, MN, USA). Protein calibration standard I (Cat. No. 206355) was purchased from Bruker (Billerica, MA). Phosphate buffered saline (PBS) buffer (Cat. No. 28372), MES buffered saline (28390), 1, 1’ Carbonyldiimidazole (97%) (CDI, 530-62-1), acetonitrile (ACN, A955-4), hydrochloric acid (HCl, A144-212), N-methylpyrrolidinone (NMP, BP1172-4) and affinity pipettes fitted with porous micro columns (991CUS01) were obtained from Thermo Scientific (Waltham, MA, USA). Tween20 (Cat. No. P7949), trifluoracetic acid (TFA, 299537), sinapic acid (85429-5G), sodium chloride (S7653), HEPES (H3375), ethanolamine (ETA, 398136), albumin from bovine serum (BSA, A7906), ammonium acetate (A7330) and octyl β-D glucopyranoside (NOG, 08001) were obtained from Sigma Aldrich (St. Louis, MO, USA). Acetone (Cat. No. 0000017150) was obtained from Avantor Performance Materials (Center Valley, PA, USA).
Human plasma samples
For the assay development and validation, human EDTA plasma samples were obtained from ProMedDX (Norton, MA, USA). For the collection matrix comparison, samples were obtained from single individuals, utilizing Na-citrate, Na2EDTA, K2EDTA and K3EDTA anticoagulants for plasma collection, and serum samples (Bioreclamation LLC, Westbury, NY, USA). Two-hundred and ninety-seven plasma samples (Na2EDTA) from middle-aged patients with type 2 diabetes were used for method comparison and protein profiling study (Arizona State University Bioscience IRB approval; protocol No. 0911004560, Study Title: Population-based proteomics investigation of type 2 diabetes mellitus). All samples were labeled only with a code, without any other identifiers. Prior to analysis, samples were aliquot in 96-well plates (V = 250 µL) and stored at −80°C.
Preparation of standards and analytical samples
Eight-point standard curves were generated by serially diluting RANTES standard solution (1 mg/mL) in sample buffer (10 mM PBS; 3 g/L BSA buffer) to concentrations of 200 ng/mL, 100 ng/mL, 50 ng/mL, 25 ng/mL, 12.5 ng/mL, 6.25 ng/mL, 3.125 ng/mL and 1.56 ng/mL. The internal reference standard (met-RANTES) was diluted in the sample buffer to a final concentration of 50 ng/mL.
The analytical samples were prepared in 96 deep-well plates by combining 250 µL of each standard/undiluted plasma sample, and 125 µL detergent mix solution (4.5% Tween, 150 mmol/L NOG, 1.5 mol/L ammonium acetate, concentrated PBS (0.67 mol/L sodium phosphate, 1 mol/L sodium chloride)). After incubating on a shaker for 5 min (room temperature, 500 rpm), 250 µL of met-RANTES (50 ng/mL) was added in each well. Additional incubation followed on a shaker (room temperature, 5 min, 500 rpm). The total sample volume was 625 µL per well.
Control standard sample was prepared in sample buffer with concentration of 40 ng/mL RANTES and was analyzed in triplicates with each run.
Affinity pipettes derivatization
The affinity pipettes (Cat.No. 991CUS01, Thermo Scientific) were initially activated using a Multimek 96 channel pipettor (Beckman Coulter, Brea, CA), as described previously [49]. The antibody solution for derivatization contained 7.5 µg anti-RANTES antibody, in 50 µL of 10 mM MES buffer. For the antibody coupling, 750 cycles of aspirations and dispenses of 20 µL volumes were performed, followed by rinses with ETA (50 cycles, 100 µL aspiration/dispense volumes) and twice with HBS-N buffer (50 cycles, 100 µL). The total time required for activation and derivatization of the affinity pipettes was 90 min for a total of 96 pipettes. The antibody-derivatized pipettes were stored in HBS-N buffer at +4°C until used.
Mass spectrometric immunoassay
The antibody derivatized affinity pipettes were mounted onto the head of the Multimek 96-channel pipettor. The assay began with an assay buffer rinse (PBS, 0.1% Tween 20), 10 aspirations and dispense cycles, 100 µL volumes each. Next, the pipettes were immersed into the 96 deep-well plate containing the analytical samples and 750 aspirations and dispense cycles were performed (100 µL volume) allowing for affinity capture of RANTES and met-RANTES from the samples. The pipettes were then rinsed with assay buffer (100 cycles), and twice with water (10 cycles and 20 cycles, 100 µL aspiration/dispense volume). The extraction of the RANTES protein and its proteoforms from the plasma samples was executed in approximately 30 min. For elution of the captured proteins, 6 µL aliquots of MALDI matrix (15 g/L sinapic acid in aqueous solution containing 33 % (v/v) acetonitrile, and 0.4 % (v/v) trifluoroacetic acid) were aspirated into the affinity pipettes, and after a 10 second delay (to allow for the dissociation of the protein from the capturing antibody), the eluates were dispensed onto a 96-well formatted MALDI target. Following drying, linear mass spectra were acquired from each sample spot, using Bruker’s Ultraflex III MALDI-TOF/TOF mass spectrometer (Bruker, Billerica, MA) operating in positive ion mode, in the mass range from 5 to 30 kDa, with 200 ns delay, ion source 1 and ion source 2 voltages of 20.00 kV and 18.45 kV respectively, and signal suppression up to 500 Da. Approximately 5,000 laser-shot mass spectra were averaged for each standard and sample.
Data analysis
For accurate mass assignment, the mass spectra were internally calibrated with protein calibration standard I (Cat.No.8206355, Bruker, Billerica, MA) and also with the IRS (mass accuracy up to 0.001 Da). Further, the mass spectra were baseline subtracted (Tophat algorithm) and smoothed (SavitzkyGolay algorithm; width = 0.2 m/z; cycles = 1), before peak integration with Flex Analysis 3.0 software (Bruker Daltonics). Peak intensities for the native RANTES, met-RANTES and RANTES proteoforms were plotted in an excel spreadsheet. Standard curves were created by plotting the ratio of the intensities of the RANTES standard signals and met-RANTES signals against the standard concentration. The linear equations obtained were used to calculate the concentrations of native RANTES and RANTES proteoforms in the analyzed samples, from the ratio of the intensities of each variant to the IRS. Total RANTES concentration was calculated from the sum of the ratios of each variant against the IRS using the generated standard curve equations.
Results and discussion
Assay development, performance and method validation
The first step in the assay development was choosing the internal reference standard (IRS) for quantitation. According to the recently established “fit-for-purpose” approach, it is important that the IRS is subjected to the same processing as the protein analyte, in order to experience the same matrix-induced suppressive effects [51]. Some targeted proteomics assays use isotope-labeled peptide and/or protein standards for quantification [52], however other possibilities exist too [46]. In top-down targeted protein assaying using MSIA we have reported using IRS that are homologues protein from different animal species [49], or protein derivatives that differ very little in the amino acid sequence from the targeted protein [53]. In this work, we employed methionine-derivatized RANTES as an IRS. The met-RANTES sequence differs from native RANTES in one only amino acid – methionine in position 1. Met-RANTES is recognized by the anti-human RANTES antibody and when spiked into the analytical sample, can be retrieved together with human RANTES. In the resulting mass spectra met-RANTES presents a signal with mass shift of + 131.2 Da from human RANTES. In order to produce a constant response throughout the analyses, we spiked met-RANTES in the samples in constant concentration of 50 ng/mL (determined experimentally). In addition, we determined that met-RANTES is not subject to cleavage and/or interactions with the enzymes present in human plasma by spiking and recovering met-RANTES from plasma sample, and comparing RANTES and RANTES proteoforms signals in spiked vs. non-spiked plasma (data not shown). This is an important prerequisite, in order to utilize met-RANTES as an IRS. Moreover, the absence of met-RANTES cleavage under DPP IV enzymatic activity has previously been reported [26].
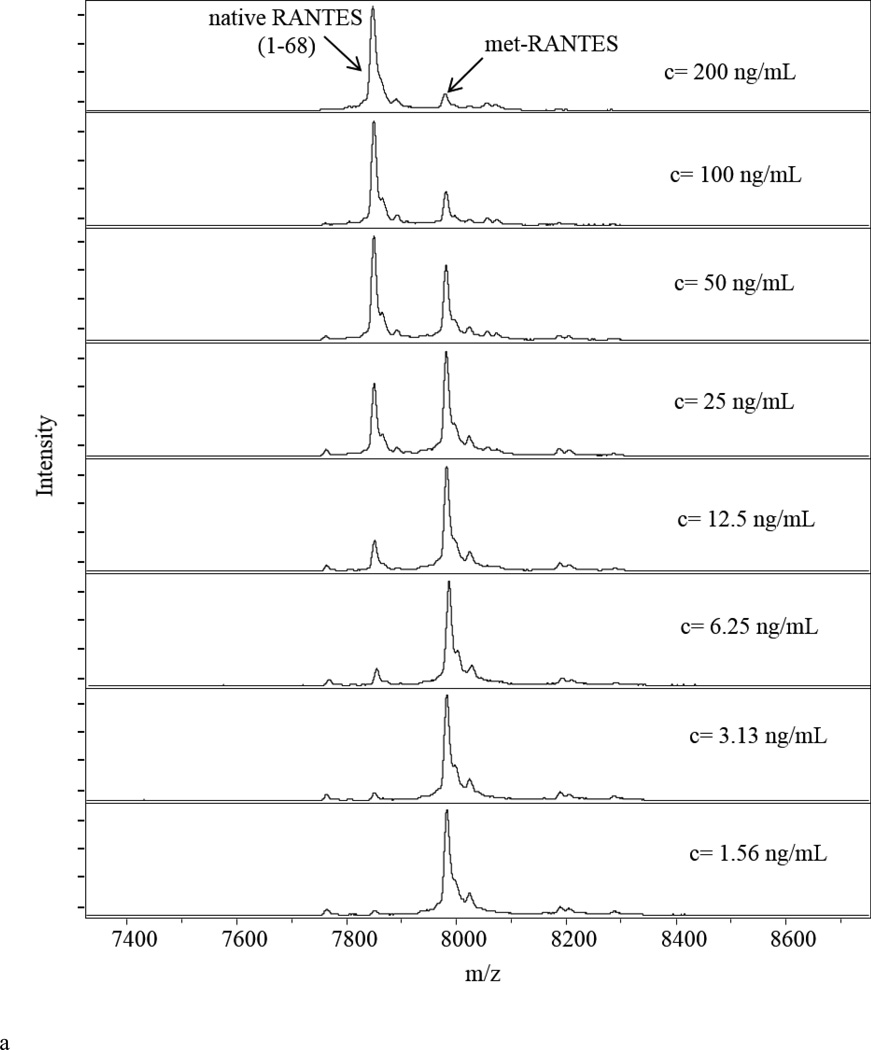
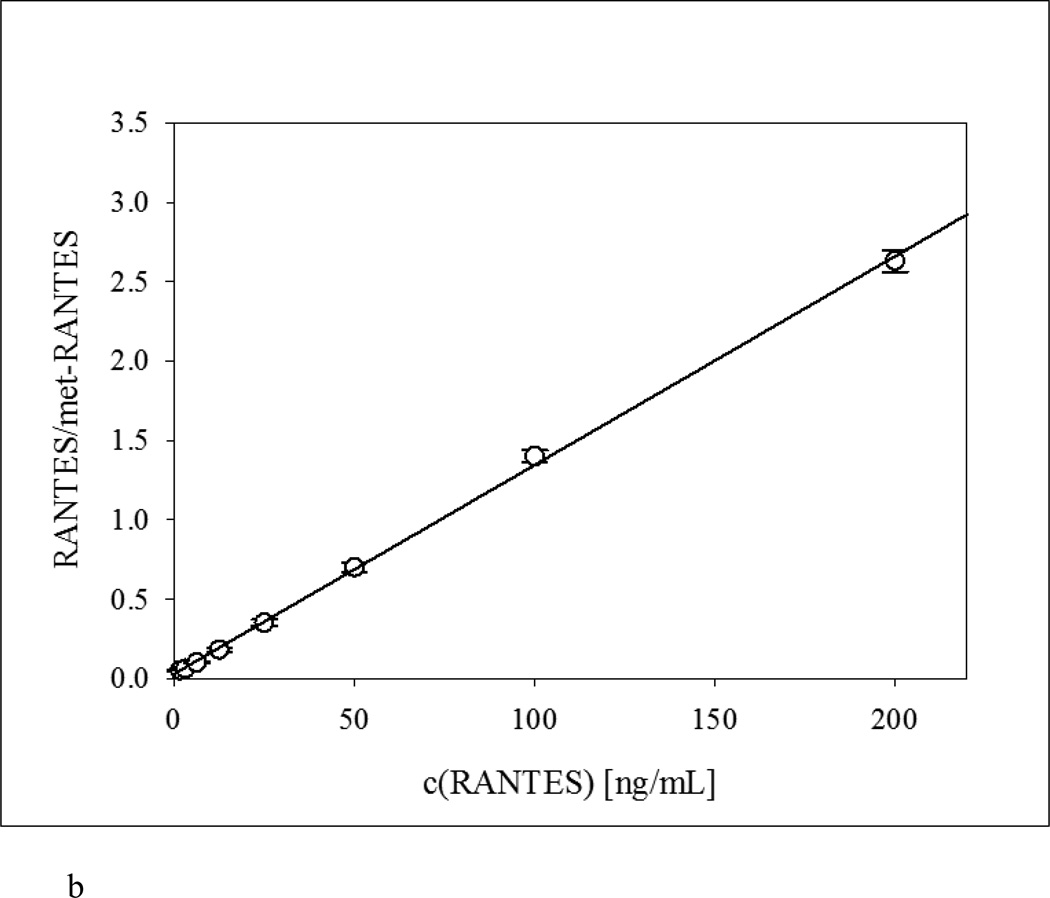
Following mass spectra acquisition, standard curves were created by plotting the ratio between RANTES standard and met-RANTES signal intensities (RANTES/met-RANTES) (y-axis) against the RANTES standard concentration (x-axis). Mass spectra from the RANTES standards (Figure 1a) together with the corresponding standard curve (Figure 1b) are presented. The fitted trendline shows linearity across the entire range, with a coefficient of determination (r2 = 0.9992) and standard error of estimate (SEE = 0.0278). The analytical performance of the developed method was analyzed by determining the LOD and LOQ. There are numerous methodologies that suggest different approaches regarding the way of calculating these parameters [51, 54, 55]. In our work, the lower limit of detection (LOD) was calculated from the limit of blank (LoB) as a sum from the mean of blank and 1.645 standard deviations from blank samples, and was found to be 0.727 ng/mL. The lower limit of quantification (LOQ), as determined from the LOD [54] was 1.56 ng/mL.
Figure 1.
Quantitative RANTES mass spectrometric immunoassay (MSIA). a) Representative RANTES MSIA mass spectra for the eight standard RANTES samples containing met-RANTES as an IRS; b) Representative standard curve generated with the RANTES MSIA, with an r2 = 0.9992, and standard error of estimate (SEE) of 0.0278.
The intra-assay precision (within run) was determined by analyzing three samples in triplicates, within a single assay run (Table 1). The inter-assay precision (between-run) was determined by analyzing one sample in triplicates, in three different days. The results presented in Table 1 show CV values of <10%.
Table 1.
Intra- and inter-day assay precision
| Intra-assay CVs | Inter-assay CV | ||||
|---|---|---|---|---|---|
| Sample | 1 | 2 | 3 | ||
| STDEVP: | 1.82 | 1.88 | 4.79 | STDEVP: | 1.84 |
| MEAN [ng/mL]: | 47.6 | 47.4 | 49.3 | MEAN [ng/mL]: | 45.7 |
| CV (%): | 3.82 | 3.97 | 9.72 | CV (%): | 4.03 |
Derivatized affinity pipettes batch-to-batch variability was determined by analyzing a standard sample with known total RANTES concentration (expected mean concentration = 40 ng/mL) in triplicates with each batch. The results show total CV = 9.81% with a SEE = 0.89% (obtained mean concentration = 39.6 ng/mL) (Supplement Table).
In separate experiments, a narrower concentration range of 15 – 150 ng/mL (i.e., physiological RANTES concentration in normal plasma) was evaluated for linearity and accuracy of the assay. Two plasma samples were initially spiked with high concentration of RANTES standard (between 100 – 150 ng/mL). The plasma samples were then serially diluted (2×, 4× and 8×), and analyzed with the mass spectrometric immunoassay to determine the RANTES concentration. The results obtained were compared with those theoretically expected, and are reported in Table 2a, indicating standard error comparable to the broader working curves (SEE = 0.0355). Lastly, spike and recovery experiments were performed by spiking two plasma samples with RANTES standard in 3 increasing concentrations (25, 50 and 100 ng/mL respectively). Obtained recovery was within the expected range of physiological concentration (SEE = 0.0618), and resulted in > 90% efficiency in recovering RANTES from plasma (Table 2b).
Table 2.
a) Assay linearity and b) Spiking recovery
| Assay linearity | Spiking recovery | ||||||||||
|---|---|---|---|---|---|---|---|---|---|---|---|
| Sample | Dilution | Observed [ng/mL] |
Expected [ng/mL] |
Recovery O/E (%) |
SEE (%) |
Sample | Spike [ng/mL] |
Observed [ng/mL] |
Expected [ng/mL] |
Recovery O/E (%) |
SEE (%) |
| 1 | 144 | 1 | 3.82 | ||||||||
| 2× | 70.9 | 71.8 | 98.7 | 1.3 | 25.0 | 26.7 | 28.8 | 92.6 | 7.4 | ||
| 4× | 35.5 | 35.9 | 99.0 | 1.0 | 50.0 | 53.4 | 53.8 | 99.1 | 0.90 | ||
| 8× | 18.9 | 17.9 | 105 | 5.0 | 100 | 110 | 103 | 106 | 6.0 | ||
| 2 | 117 | 2 | 10.4 | ||||||||
| 2× | 56.3 | 58.6 | 96.1 | 3.9 | 25.0 | 36.3 | 35.4 | 102.4 | 2.4 | ||
| 4× | 29.0 | 29.3 | 98.9 | 1.1 | 50.0 | 65.5 | 60.4 | 108.4 | 8.4 | ||
| 8× | 16.0 | 14.6 | 109 | 9.0 | 100 | 124 | 110 | 112 | 12 | ||
Method comparison
The RANTES MSIA data was referenced to the Quantikine RANTES ELISA kit. In order to eliminate differences in antibody specificity, we have used RANTES ELISA that utilizes the same primary antibody as our RANTES MSIA. A subset of 40 plasma samples were analyzed in duplicates using the RANTES ELISA following the instructions provided by the manufacturer, yielding total RANTES concentrations between 3.6 – 84.7 ng/mL.
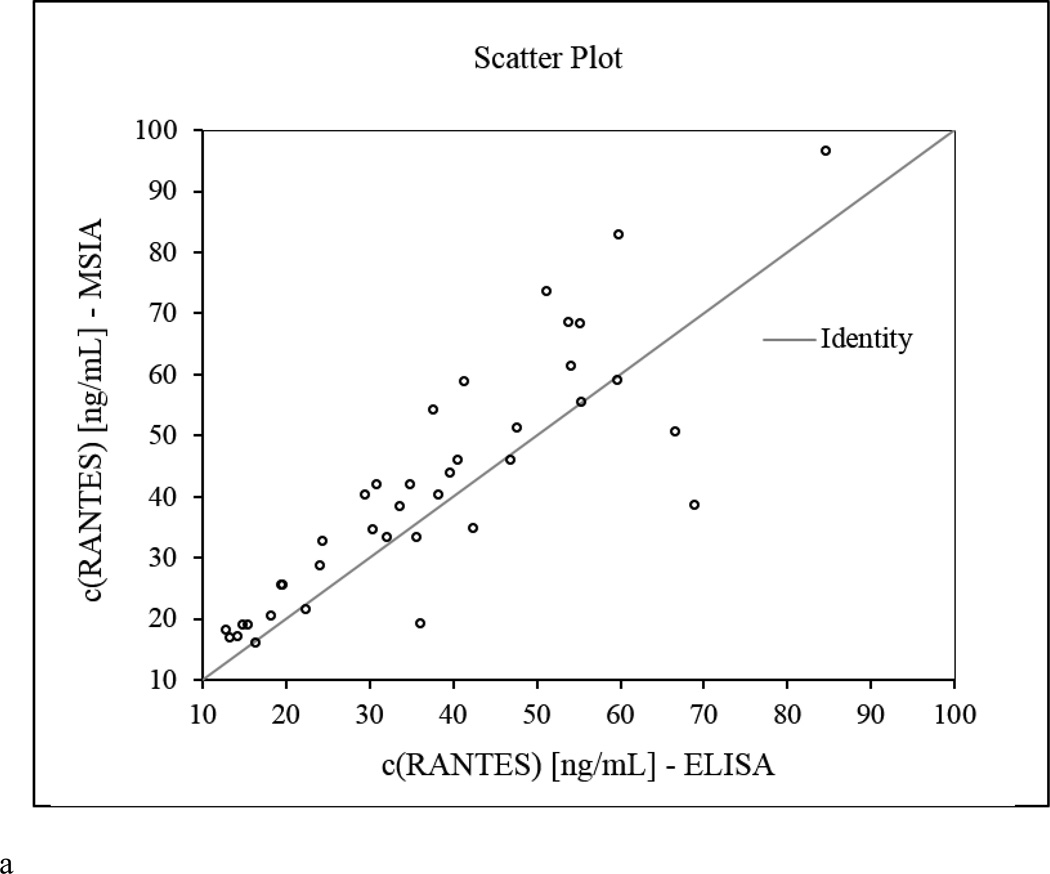
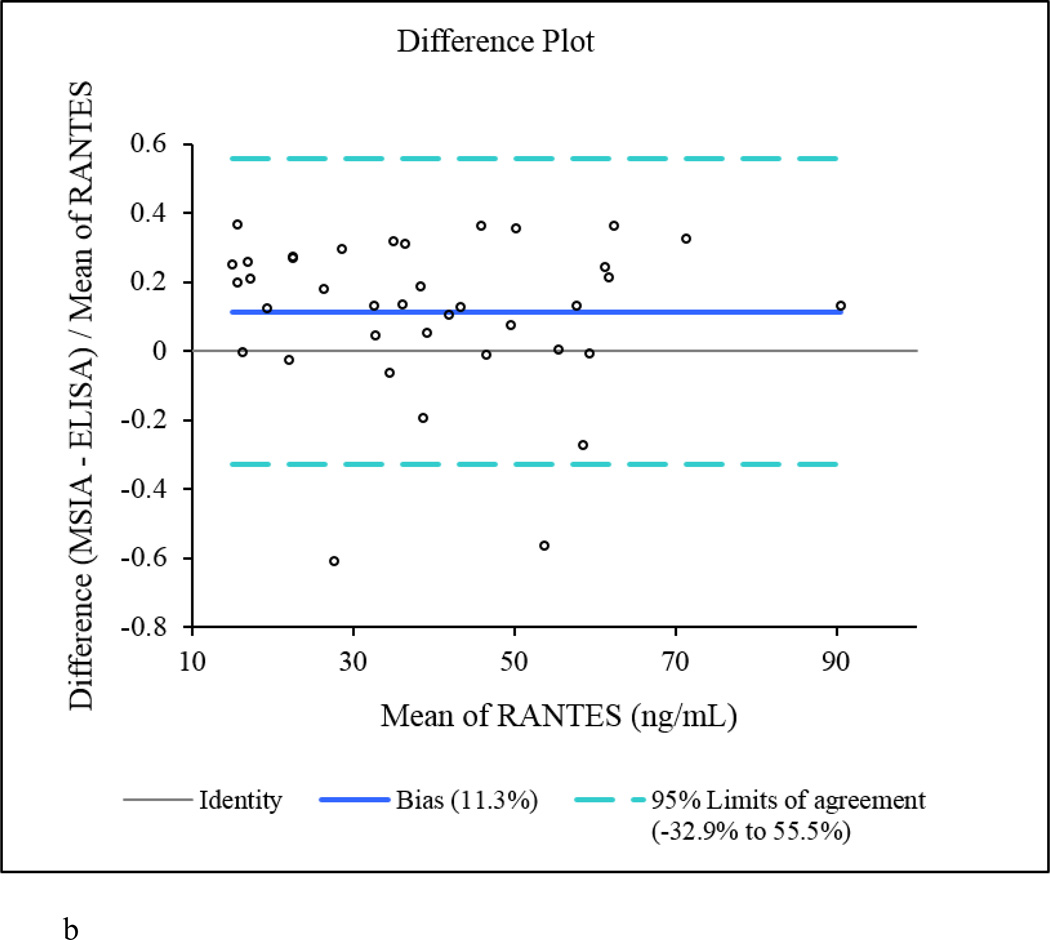
The native RANTES concentrations determined by MSIA correlated well with those obtained with the ELISA, with a Passing-Bablok fit [56] of 0.39 + 1.14×, and Cusum linearity p-value > 0.1. The Altman Bland plot [57] confirmed the correlation between the methods, as presented in the scatter plot (Figure 2a), with a positive bias of 11.3% (Figure 2b). When total RANTES concentration was calculated using MSIA (to include all RANTES proteoforms), and the results were compared to the ELISA data, higher positive bias was noted (+ 29.1%, data not shown). The appearance of bias in such method comparison analyses is not unusual [53, 58, 59], and it can be linked to a number of different causes. One may be the possibility that the secondary (labeled) antibody used in the ELISA does not recognize the truncated RANTES variants (this is only a speculation as we don’t have information about the epitopes of the RANTES antibodies used in the MSIA and the ELISA). Another possibility is the difference in sample processing. Human plasma handling can have a significant influence on protein concentration analysis [60, 61]. To minimize the effects of sample handling, the plasma samples that were analyzed with MSIA and ELISA were taken from a single batch, and were subjected to the same storage conditions. The only difference was the assaying time – MSIA takes a total of 40 min from sample preparation to data acquisition, whereas the ELISA method requires 3.5 h for analysis, during which time degradation in RANTES could occur.
Figure 2.
RANTES MSIA vs. ELISA method comparison. a) Scatter plot showing direct comparison between the RANTES concentrations for 40 human plasma samples obtained with the developed MSIA and a reference ELISA method; b) Altman-Bland difference plot showing slight positive correlation (bias =11.3%) between the RANTES concentrations obtained by MSIA vs. the reference ELISA method.
RANTES protein profiling in human plasma and serum samples
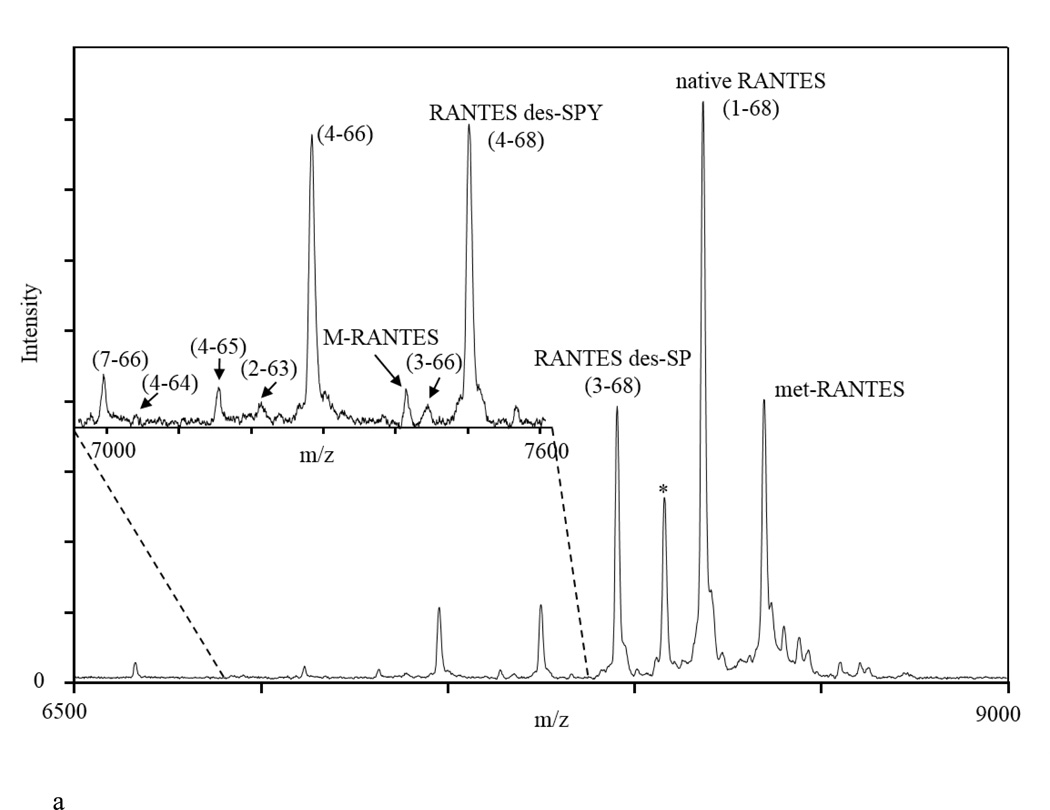
Presented in Figure 3a is an example of a mass spectrum obtained from a human plasma sample using the quantitative RANTES MSIA. To identify the protein species in the mass spectra, two internal calibrations were performed – one using protein calibration standard I (Bruker, Billerica, MA), and second, using the IRS in the spectrum. Peaks were calibrated up to 0.001 Da in m/z, in order to accurately determine their mass and assign them to the corresponding RANTES proteoform. Using this approach, and accounting for the selectivity of the RANTES antibody to detect only RANTES proteoforms, we were able to identify several RANTES proteoforms. Observed in the spectrum are signals of full-length RANTES (1–68) (MW=7,847.9), met-RANTES (MW=7,979.1), and RANTES proteoforms denoted as RANTES (3–68) (MW=7,663.7; missing an SP- N-terminal dipeptide as a result of DPP IV enzymatic cleavage), RANTES (4–68) (MW=7,500.6; missing an SPY- N-terminal peptide), and both N- and C-terminal cleaved variant, RANTES (4–66) (MW=7,282.3). In addition, we were able to detect the following less abundant RANTES species: RANTES (7–66) (MW=6,993.1; missing six N-terminal and two C-terminal amino acids), RANTES (4–64) (MW=7,040.1; missing three N-terminal and four C-terminal amino acids), RANTES (4–65) (MW=7,153.2; missing three N- and three C-terminal amino acids), and RANTES (3–66) (MW=7,445.5; missing two N- and two C-terminal amino acids). The signal with MW=7,413.5 has multiple truncation possibilities: (2–65) (missing one N- and three C-terminal amino acids); (4–67) (missing three N- and one C-terminal amino acids) or (5–68) (missing four N-terminal amino acids). For this study it was labeled as an M-RANTES species, and additional experiments are needed to confirm the actual truncation. The assignment of these signals was performed using the observed m/z values and comparison to the RANTES protein sequence and the previously published qualitative results [14]. The peak labeled with (*) could not be assigned to any RANTES sequence proteoform, and it is probably a plasma protein that binds to the RANTES antibody immobilized on the tips. This peak did not appear in negative controls when tips without RANTES antibody and/or antibodies specific to other protein were immobilized on the affinity pipette. More importantly, the peak remained constant when human RANTES standard was spiked in human plasma samples and incubated for specific period of times to allow for some RANTES degradation and increase in variants concentration (results not shown). The fact that this peak remained constant over time suggests that it is not a RANTES variant.
Figure 3.
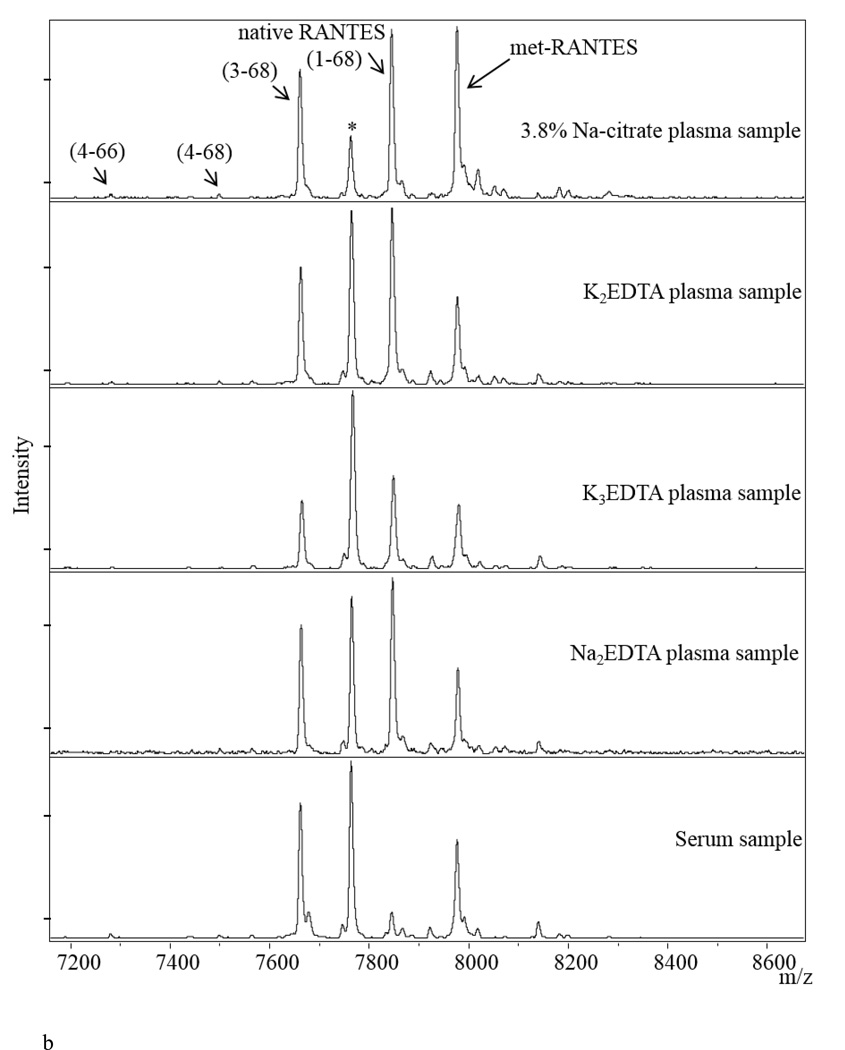
a) Representative mass spectra of RANTES from human plasma sample, showing signals from met-RANTES, native RANTES and several RANTES variants (here you have to list and name all the variants shown on the figure); b) RANTES MSIA mass spectra from Na-citrate, K3EDTA, K2EDTA, Na2EDTA plasma and serum samples obtained from a single individual. (*) denotes signal from a non-identified proteoform.
Testing different types of biological matrices is used to provide an evidence of the clinical utility of the assay [51]. Most of the assays utilized in routine clinical practice use plasma and/or serum samples for analyses. The choice of the “right” media for a certain assay can significantly influence the outcome of the analysis. RANTES is a protein that exhibits differences in its distribution between different sample collection matrices. It has been reported that heparin plasma exhibits higher RANTES concentrations then EDTA plasma [62]. We have confirmed this finding, but also go a step further and provide information for the concentration of the RANTES variants in various biological matrices (with different types of anticoagulants used) from a single individual (Figure 3b). The mass spectra show significant differences in the distribution of native RANTES and its proteoforms between the samples, primarily between native RANTES and variant (3–68). In addition, RANTES shows a significantly different profile in serum (very low native RANTES signal, and high DPP IV cleaved variant). This is somewhat expected, because RANTES is expressed during platelet activation and, therefore, blood enzymes will influence the variant distribution during the clotting process [63]. Based on these results, EDTA plasma collection matrix was used for subsequent assays in human samples.
RANTES protein profiling in clinical samples
To assess its application in larger cohort analysis, we used the optimized RANTES MSIA to determine the profile and concentration distribution of RANTES and its variants in human EDTA plasma samples obtained from 297 individuals with type 2 diabetes (no DPP IV inhibitor medication use). We calculated the total RANTES concentration in all samples by summing the ratios between all identified variants signals with the IRS and using standard curves equations. The concentration distribution was slightly higher than the reference levels for RANTES in normal plasma samples, which is possibly due to changes in inflammatory responses that are common in patients with abnormal glucose metabolism [64].
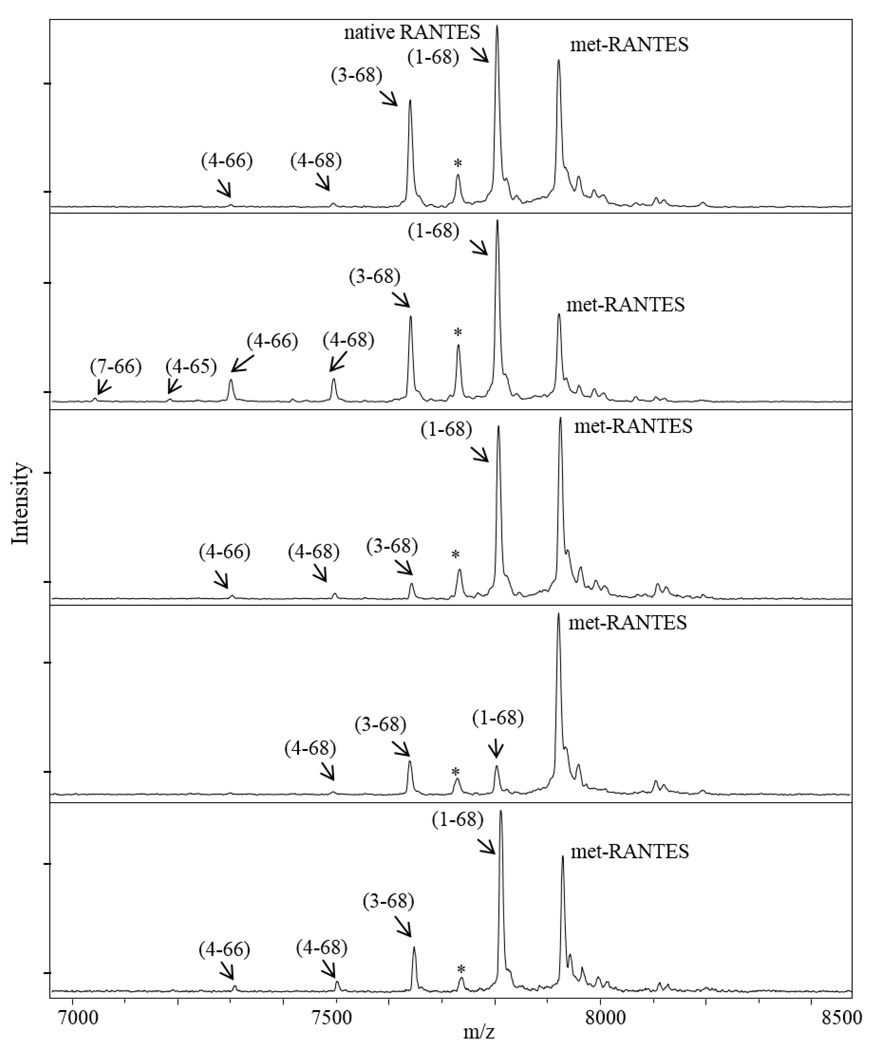
Furthermore, we determined the RANTES protein variants profile in the samples. Full length native RANTES and the cleaved (3–68) variant were detected in all samples. The concentration distribution of the native RANTES (1–68) was in the range of 1.92 – 137.8 ng/mL, whereas, the DPP IV cleavage product RANTES (3–68) was determined to be in a range of 0.138 – 34.4 ng/mL. The distribution of the other proteoforms, together with their frequency is summarized in Table 3. The majority of low abundant RANTES variants have concentrations that are lower than the LOQ. The concentrations of those variants were calculated as a percentage from the total RANTES concentration, using the variant/IRS signals ratio. The results indicate that there are significant differences in the RANTES profile between samples (Figure 4). Even though RANTES truncated variants are present in low concentrations, they may indicate physiological changes in RANTES metabolic pathways and, thus, deserve further investigation.
Table 3.
Quantitative distribution of RANTES and RANTES proteoforms in human plasma samples.
| Observed [M+H]+ |
Theoretical [M+H]+ |
RANTES species | c(RANTES) [ng/mL] (mean (range)) |
Count number of samples) |
Frequency (%) |
|---|---|---|---|---|---|
| total RANTES | 44.9 (2.15 – 163.8) | 297 | 100 | ||
| 7847.922 | 7847.975 | native RANTES | 37.4 (1.92 – 137.8) | 297 | 100 |
| 7663.894 | 7663.780 | (3–68) | 6.64 (0.138 – 34.4) | 297 | 100 |
| 7500.469 | 7500.605 | (4–68) | 0.940 (0.074 – 6.57) | 206 | 69.4 |
| 7282.792 | 7282.331 | (4–66) | 0.947 (0.042 – 5.14) | 87 | 29.3 |
| 6993.624 | 6993.086 | (7–66) | 0.210 (0.050 – 0.363) | 3 | 1.01 |
| 7040.634 | 7040.056 | (4–64) | 0.358 (0.054 – 2.15) | 13 | 4.38 |
| 7153.511 | 7153.215 | (4–65) | 0.157 (0.051 – 0.262) | 2 | 0.673 |
| 7212.998 | 7213.270 | (2–63) | 0.213 (0.034 – 1.47) | 15 | 5.05 |
| 7413.623 | 7413.507 | (2–65); (4–67); (5–68) | 0.135 (0.037 – 0.295) | 3 | 1.01 |
| 7445.706 | 7445.506 | (3–66) | 0.247 | 1 | 0.337 |
| 7576.552 | 7576.702 | (3–67) | 0.774 (0.034 – 4.57) | 7 | 2.36 |
Figure 4.
Representative RANTES MSIA mass spectra from several human plasma samples, indicating different RANTES variants profiles.
Conclusions
We have developed a MSIA method for quantitative analysis and profiling of the chemokine RANTES. The MSIA method was characterized and benchmarked against existing ELISA method. Moreover, the applicability in high-throughput assaying was tested by analyzing a cohort of human plasma samples. The method provides extensive information about the protein profile and concentration distribution of RANTES and its proteoforms. This assay can be used in future studies of RANTES properties in vivo and could further contribute to better understanding of its clinical significance.
Supplementary Material
Highlights.
We present a quantitative mass spectrometric immunoassay for analyzing RANTES and its variants.
The method was characterized and benchmarked against existing quantitative immunoassay.
The results provide quantitative data for RANTES and its posttranslational modifications.
The method is fast, efficient, and offers insight into the intrinsic protein characteristics.
The assay was applied in RANTES profiling in human plasma samples.
Significance.
In the last two decades, RANTES has been studied extensively due to its association with numerous clinical conditions, including kidney-related, autoimmune, cardiovascular, viral and metabolic pathologies. Although a single gene product, RANTES is expressed in a range of cells and tissues presenting with different endogenously produced variants and PTMs. The structural variety and population diversity that has been identified for RANTES necessitate developing advanced methodologies that can provide insight into the protein heterogeneity and its function and regulation in disease. In this work we present a simple, efficient and high-throughput mass spectrometric immunoassay (MSIA) method for analysis of RANTES proteoforms. RANTES MSIA can detect and analyze RANTES proteoforms and provide an insight into the endogenous protein modifications.
Acknowledgements
This work was supported in part by Award Numbers R01DK082542 and R24DK090958 from the National Institute of Diabetes and Digestive and Kidney Diseases. The content is solely the responsibility of the authors and does not necessarily represent the official views of the National Institute of Diabetes and Digestive and Kidney Diseases or the National Institutes of Health.
List of abbreviations
- RANTES
Regulated on Activation, Normal, T-cell Expressed and Secreted
- MSIA
Mass spectrometric immunoassay
- IRS
internal reference standard
Footnotes
Publisher's Disclaimer: This is a PDF file of an unedited manuscript that has been accepted for publication. As a service to our customers we are providing this early version of the manuscript. The manuscript will undergo copyediting, typesetting, and review of the resulting proof before it is published in its final citable form. Please note that during the production process errors may be discovered which could affect the content, and all legal disclaimers that apply to the journal pertain.
References
- 1.Carlson J, Baxter SA, Dréau D, Nesmelova IV. The heterodimerization of platelet-derived chemokines. Biochim Biophys Acta. 2013;1834:158–168. doi: 10.1016/j.bbapap.2012.09.010. [DOI] [PubMed] [Google Scholar]
- 2.Rossi D, Zlotnik A. The biology of chemokines and their receptors. Annu Rev Immunol. 2000;18:217–242. doi: 10.1146/annurev.immunol.18.1.217. [DOI] [PubMed] [Google Scholar]
- 3.Belperio JA, Keane MP, Arenberg DA, Addison CL, et al. CXC chemokines in angiogenesis. J Leukoc Biol. 2000;68:1–8. [PubMed] [Google Scholar]
- 4.Mackay CR. Chemokines: immunology's high impact factors. Nat Immunol. 2001;2:95–101. doi: 10.1038/84298. [DOI] [PubMed] [Google Scholar]
- 5.Youn BS, Mantel C, Broxmeyer HE. Chemokines, chemokine receptors and hematopoiesis. Immunol Rev. 2000;177:150–174. doi: 10.1034/j.1600-065x.2000.17701.x. [DOI] [PubMed] [Google Scholar]
- 6.Zlotnik A, Yoshie O. Chemokines: a new classification system and their role in immunity. Immunity. 2000;12:121–127. doi: 10.1016/s1074-7613(00)80165-x. [DOI] [PubMed] [Google Scholar]
- 7.Power CA, Meyer A, Nemeth K, Bacon KB, et al. Molecular cloning and functional expression of a novel CC chemokine receptor cDNA from a human basophilic cell line. J Biol Chem. 1995;270:19495–19500. doi: 10.1074/jbc.270.33.19495. [DOI] [PubMed] [Google Scholar]
- 8.Combadiere C, Ahuja SK, Tiffany HL, Murphy PM. Cloning and functional expression of CC CKR5, a human monocyte CC chemokine receptor selective for MIP-1(alpha), MIP-1(beta), and RANTES. J Leukoc Biol. 1996;60:147–152. doi: 10.1002/jlb.60.1.147. [DOI] [PubMed] [Google Scholar]
- 9.Neote K, Darbonne W, Ogez J, Horuk R, Schall TJ. Identification of a promiscuous inflammatory peptide receptor on the surface of red blood cells. J Biol Chem. 1993;268:12247–12249. [PubMed] [Google Scholar]
- 10.Niwa Y, Akamatsu H, Niwa H, Sumi H, et al. Correlation of tissue and plasma RANTES levels with disease course in patients with breast or cervical cancer. Clin Cancer Res. 2001;7:285–289. [PubMed] [Google Scholar]
- 11.Blanpain C, Doranz BJ, Vakili J, Rucker J, et al. Multiple charged and aromatic residues in CCR5 amino-terminal domain are involved in high affinity binding of both chemokines and HIV-1 Env protein. J Biol Chem. 1999;274:34719–34727. doi: 10.1074/jbc.274.49.34719. [DOI] [PubMed] [Google Scholar]
- 12.Brandt SM, Mariani R, Holland AU, Hope TJ, Landau NR. Association of chemokine-mediated block to HIV entry with coreceptor internalization. J Biol Chem. 2002;277:17291–17299. doi: 10.1074/jbc.M108232200. [DOI] [PubMed] [Google Scholar]
- 13.Lit LC, Wong CK, Tam LS, Li EK, Lam CW. Raised plasma concentration and ex vivo production of inflammatory chemokines in patients with systemic lupus erythematosus. Ann Rheum Dis. 2006;65:209–215. doi: 10.1136/ard.2005.038315. [DOI] [PMC free article] [PubMed] [Google Scholar]
- 14.Oran PE, Sherma ND, Borges CR, Jarvis JW, Nelson RW. Intrapersonal and populational heterogeneity of the chemokine RANTES. Clin Chem. 2010;56:1432–1441. doi: 10.1373/clinchem.2010.147884. [DOI] [PMC free article] [PubMed] [Google Scholar]
- 15.Ghanim H, Korzeniewski K, Sia CL, Abuaysheh S, et al. Suppressive effect of insulin infusion on chemokines and chemokine receptors. Diabetes Care. 2010;33:1103–1108. doi: 10.2337/dc09-2193. [DOI] [PMC free article] [PubMed] [Google Scholar]
- 16.Matter CM, Handschin C. RANTES (regulated on activation, normal T cell expressed and secreted), inflammation, obesity, and the metabolic syndrome. Circulation. 2007;115:946–948. doi: 10.1161/CIRCULATIONAHA.106.685230. [DOI] [PubMed] [Google Scholar]
- 17.Azenshtein E, Luboshits G, Shina S, Neumark E, et al. The CC chemokine RANTES in breast carcinoma progression: regulation of expression and potential mechanisms of promalignant activity. Cancer Res. 2002;62:1093–1102. [PubMed] [Google Scholar]
- 18.Winnik S, Klingenberg R, Matter CM. Plasma RANTES: a molecular fingerprint of the unstable carotid plaque? Eur Heart J. 2011;32:393–395. doi: 10.1093/eurheartj/ehq376. [DOI] [PubMed] [Google Scholar]
- 19.von Hundelshausen P, Weber C. Platelets as immune cells: bridging inflammation and cardiovascular disease. Circ Res. 2007;100:27–40. doi: 10.1161/01.RES.0000252802.25497.b7. [DOI] [PubMed] [Google Scholar]
- 20.Koenen RR, Weber C. Platelet-derived chemokines in vascular remodeling and atherosclerosis. Semin Thromb Hemost. 2010;36:163–169. doi: 10.1055/s-0030-1251500. [DOI] [PubMed] [Google Scholar]
- 21.Weber C. Chemokines in atherosclerosis, thrombosis, and vascular biology. Arterioscler Thromb Vasc Biol. 2008;28:1896. doi: 10.1161/ATVBAHA.108.177311. [DOI] [PubMed] [Google Scholar]
- 22.Saito T, Deskin RW, Casola A, Häeberle H, et al. Respiratory syncytial virus induces selective production of the chemokine RANTES by upper airway epithelial cells. J Infect Dis. 1997;175:497–504. doi: 10.1093/infdis/175.3.497. [DOI] [PubMed] [Google Scholar]
- 23.Hao X, Kim TS, Braciale TJ. Differential response of respiratory dendritic cell subsets to influenza virus infection. J Virol. 2008;82:4908–4919. doi: 10.1128/JVI.02367-07. [DOI] [PMC free article] [PubMed] [Google Scholar]
- 24.Matsukura S, Kokubu F, Kubo H, Tomita T, et al. Expression of RANTES by normal airway epithelial cells after influenza virus A infection. Am J Respir Cell Mol Biol. 1998;18:255–264. doi: 10.1165/ajrcmb.18.2.2822. [DOI] [PubMed] [Google Scholar]
- 25.Wareing MD, Lyon AB, Lu B, Gerard C, Sarawar SR. Chemokine expression during the development and resolution of a pulmonary leukocyte response to influenza A virus infection in mice. J Leukoc Biol. 2004;76:886–895. doi: 10.1189/jlb.1203644. [DOI] [PubMed] [Google Scholar]
- 26.Lim JK, Lu W, Hartley O, DeVico AL. N-terminal proteolytic processing by cathepsin G converts RANTES/CCL5 and related analogs into a truncated 4–68 variant. J Leukoc Biol. 2006;80:1395–1404. doi: 10.1189/jlb.0406290. [DOI] [PubMed] [Google Scholar]
- 27.Iwata S, Yamaguchi N, Munakata Y, Ikushima H, et al. CD26/dipeptidyl peptidase IV differentially regulates the chemotaxis of T cells and monocytes toward RANTES: possible mechanism for the switch from innate to acquired immune response. Int Immunol. 1999;11:417–426. doi: 10.1093/intimm/11.3.417. [DOI] [PubMed] [Google Scholar]
- 28.Lim JK, Burns JM, Lu W, DeVico AL. Multiple pathways of amino terminal processing produce two truncated variants of RANTES/CCL5. J Leukoc Biol. 2005;78:442–452. doi: 10.1189/jlb.0305161. [DOI] [PubMed] [Google Scholar]
- 29.Oravecz T, Pall M, Roderiquez G, Gorrell MD, et al. Regulation of the receptor specificity and function of the chemokine RANTES (regulated on activation, normal T cell expressed and secreted) by dipeptidyl peptidase IV (CD26)-mediated cleavage. J Exp Med. 1997;186:1865–1872. doi: 10.1084/jem.186.11.1865. [DOI] [PMC free article] [PubMed] [Google Scholar]
- 30.Delgado MB, Clark-Lewis I, Loetscher P, Langen H, et al. Rapid inactivation of stromal cell-derived factor-1 by cathepsin G associated with lymphocytes. Eur J Immunol. 2001;31:699–707. doi: 10.1002/1521-4141(200103)31:3<699::aid-immu699>3.0.co;2-6. [DOI] [PubMed] [Google Scholar]
- 31.Detheux M, Ständker L, Vakili J, Münch J, et al. Natural proteolytic processing of hemofiltrate CC chemokine 1 generates a potent CC chemokine receptor (CCR)1 and CCR5 agonist with anti-HIV properties. J Exp Med. 2000;192:1501–1508. doi: 10.1084/jem.192.10.1501. [DOI] [PMC free article] [PubMed] [Google Scholar]
- 32.Kaburagi Y, Shimada Y, Nagaoka T, Hasegawa M, et al. Enhanced production of CC-chemokines (RANTES, MCP-1, MIP-1alpha, MIP-1beta, and eotaxin) in patients with atopic dermatitis. Arch Dermatol Res. 2001;293:350–355. doi: 10.1007/s004030100230. [DOI] [PubMed] [Google Scholar]
- 33.Krastins B, Prakash A, Sarracino DA, Nedelkov D, et al. Rapid development of sensitive, high-throughput, quantitative and highly selective mass spectrometric targeted immunoassays for clinically important proteins in human plasma and serum. Clin Biochem. 2013;46:399–410. doi: 10.1016/j.clinbiochem.2012.12.019. [DOI] [PMC free article] [PubMed] [Google Scholar]
- 34.Parker CE, Borchers CH. Mass spectrometry based biomarker discovery, verification, and validation--quality assurance and control of protein biomarker assays. Mol Oncol. 2014;8:840–858. doi: 10.1016/j.molonc.2014.03.006. [DOI] [PMC free article] [PubMed] [Google Scholar]
- 35.Picotti P, Aebersold R. Selected reaction monitoring-based proteomics: workflows, potential, pitfalls and future directions. Nat Methods. 2012;9:555–566. doi: 10.1038/nmeth.2015. [DOI] [PubMed] [Google Scholar]
- 36.Kuhn E, Whiteaker JR, Mani DR, Jackson AM, et al. Interlaboratory evaluation of automated, multiplexed peptide immunoaffinity enrichment coupled to multiple reaction monitoring mass spectrometry for quantifying proteins in plasma. Mol Cell Proteomics. 2012;11 doi: 10.1074/mcp.M111.013854. M111 013854. [DOI] [PMC free article] [PubMed] [Google Scholar]
- 37.Weiß F, van den Berg BH, Planatscher H, Pynn CJ, et al. Catch and measure-mass spectrometry-based immunoassays in biomarker research. Biochim Biophys Acta. 2014;1844:927–932. doi: 10.1016/j.bbapap.2013.09.010. [DOI] [PubMed] [Google Scholar]
- 38.Issaq HJ, Veenstra TD, Conrads TP, Felschow D. The SELDI-TOF MS approach to proteomics: protein profiling and biomarker identification. Biochem Biophys Res Commun. 2002;292:587–592. doi: 10.1006/bbrc.2002.6678. [DOI] [PubMed] [Google Scholar]
- 39.Anderson NL, Anderson NG, Haines LR, Hardie DB, et al. Mass spectrometric quantitation of peptides and proteins using Stable Isotope Standards and Capture by Anti-Peptide Antibodies (SISCAPA) J Proteome Res. 2004;3:235–244. doi: 10.1021/pr034086h. [DOI] [PubMed] [Google Scholar]
- 40.Razavi M, Frick LE, LaMarr WA, Pope ME, et al. High-throughput SISCAPA quantitation of peptides from human plasma digests by ultrafast, liquid chromatography-free mass spectrometry. J Proteome Res. 2012;11:5642–5649. doi: 10.1021/pr300652v. [DOI] [PubMed] [Google Scholar]
- 41.Reid JD, Holmes DT, Mason DR, Shah B, Borchers CH. Towards the development of an immuno MALDI (iMALDI) mass spectrometry assay for the diagnosis of hypertension. J Am Soc Mass Spectrom. 2010;21:1680–1686. doi: 10.1016/j.jasms.2010.01.024. [DOI] [PubMed] [Google Scholar]
- 42.Mann M. Functional and quantitative proteomics using SILAC. Nat Rev Mol Cell Biol. 2006;7:952–958. doi: 10.1038/nrm2067. [DOI] [PubMed] [Google Scholar]
- 43.Nelson RW, Krone JR, Bieber AL, Williams P. Mass spectrometric immunoassay. Anal Chem. 1995;67:1153–1158. doi: 10.1021/ac00103a003. [DOI] [PubMed] [Google Scholar]
- 44.Trenchevska O, Nedelkov D. Targeted quantitative mass spectrometric immunoassay for human protein variants. Proteome Sci. 2011;9:19. doi: 10.1186/1477-5956-9-19. [DOI] [PMC free article] [PubMed] [Google Scholar]
- 45.Borges CR, Jarvis JW, Oran PE, Rogers SP, Nelson RW. Population studies of intact vitamin D binding protein by affinity capture ESI-TOF-MS. J Biomol Tech. 2008;19:167–176. [PMC free article] [PubMed] [Google Scholar]
- 46.Kiernan UA, Phillips DA, Trenchevska O, Nedelkov D. Quantitative mass spectrometry evaluation of human retinol binding protein 4 and related variants. PLoS One. 2011;6:e17282. doi: 10.1371/journal.pone.0017282. [DOI] [PMC free article] [PubMed] [Google Scholar]
- 47.Oran PE, Trenchevska O, Nedelkov D, Borges CR, et al. Parallel workflow for high-throughput (>1,000 samples/day) quantitative analysis of human insulin-like growth factor 1 using mass spectrometric immunoassay. PLoS One. 2014;9:e92801. doi: 10.1371/journal.pone.0092801. [DOI] [PMC free article] [PubMed] [Google Scholar]
- 48.Sherma ND, Borges CR, Trenchevska O, Jarvis JW, et al. Mass Spectrometric Immunoassay for the qualitative and quantitative analysis of the cytokine Macrophage Migration Inhibitory Factor (MIF) Proteome Sci. 2014;12:52. doi: 10.1186/s12953-014-0052-3. [DOI] [PMC free article] [PubMed] [Google Scholar]
- 49.Trenchevska O, Kamcheva E, Nedelkov D. Mass spectrometric immunoassay for quantitative determination of protein biomarker isoforms. J Proteome Res. 2010;9:5969–5973. doi: 10.1021/pr1007587. [DOI] [PMC free article] [PubMed] [Google Scholar]
- 50.Trenchevska O, Kamcheva E, Nedelkov D. Mass spectrometric immunoassay for quantitative determination of transthyretin and its variants. Proteomics. 2011;11:3633–3641. doi: 10.1002/pmic.201100023. [DOI] [PMC free article] [PubMed] [Google Scholar]
- 51.Carr SA, Abbatiello SE, Ackermann BL, Borchers C, et al. Targeted peptide measurements in biology and medicine: best practices for mass spectrometry-based assay development using a fit-for-purpose approach. Mol Cell Proteomics. 2014;13:907–917. doi: 10.1074/mcp.M113.036095. [DOI] [PMC free article] [PubMed] [Google Scholar]
- 52.Brun V, Dupuis A, Adrait A, Marcellin M, et al. Isotope-labeled protein standards: toward absolute quantitative proteomics. Mol Cell Proteomics. 2007;6:2139–2149. doi: 10.1074/mcp.M700163-MCP200. [DOI] [PubMed] [Google Scholar]
- 53.Niederkofler EE, Phillips DA, Krastins B, Kulasingam V, et al. Targeted selected reaction monitoring mass spectrometric immunoassay for insulin-like growth factor 1. PLoS One. 2013;8:e81125. doi: 10.1371/journal.pone.0081125. [DOI] [PMC free article] [PubMed] [Google Scholar]
- 54.Armbruster DA, Pry T. Limit of blank, limit of detection and limit of quantitation. Clin Biochem Rev. 2008;29(Suppl 1):S49–S52. [PMC free article] [PubMed] [Google Scholar]
- 55.Shah VP, Midha KK, Findlay JW, Hill HM, et al. Bioanalytical method validation--a revisit with a decade of progress. Pharm Res. 2000;17:1551–1557. doi: 10.1023/a:1007669411738. [DOI] [PubMed] [Google Scholar]
- 56.Passing H. Bablok, A new biometrical procedure for testing the equality of measurements from two different analytical methods. Application of linear regression procedures for method comparison studies in clinical chemistry, Part I. J Clin Chem Clin Biochem. 1983;21:709–720. doi: 10.1515/cclm.1983.21.11.709. [DOI] [PubMed] [Google Scholar]
- 57.Bland JM, Altman DG. Measuring agreement in method comparison studies. Stat Methods Med Res. 1999;8:135–160. doi: 10.1177/096228029900800204. [DOI] [PubMed] [Google Scholar]
- 58.Dossus L, Becker S, Achaintre D, Kaaks R, Rinaldi S. Validity of multiplex-based assays for cytokine measurements in serum and plasma from "non-diseased" subjects: comparison with ELISA. J Immunol Methods. 2009;350:125–132. doi: 10.1016/j.jim.2009.09.001. [DOI] [PubMed] [Google Scholar]
- 59.Aziz N, Nishanian P, Mitsuyasu R, Detels R, Fahey JL. Variables that affect assays for plasma cytokines and soluble activation markers. Clin Diagn Lab Immunol. 1999;6:89–95. doi: 10.1128/cdli.6.1.89-95.1999. [DOI] [PMC free article] [PubMed] [Google Scholar]
- 60.Mitchell BL, Yasui Y, Li CI, Fitzpatrick AL, Lampe PD. Impact of freeze-thaw cycles and storage time on plasma samples used in mass spectrometry based biomarker discovery projects. Cancer Inform. 2005;1:98–104. [PMC free article] [PubMed] [Google Scholar]
- 61.Borges CR, Rehder DS, Jensen S, Schaab MR, et al. Elevated plasma albumin and apolipoprotein A-I oxidation under suboptimal specimen storage conditions. Mol Cell Proteomics. 2014;13:1890–1899. doi: 10.1074/mcp.M114.038455. [DOI] [PMC free article] [PubMed] [Google Scholar]
- 62.Biancotto A, Feng X, Langweiler M, Young NS, McCoy JP. Effect of anticoagulants on multiplexed measurement of cytokine/chemokines in healthy subjects. Cytokine. 2012;60:438–446. doi: 10.1016/j.cyto.2012.05.019. [DOI] [PMC free article] [PubMed] [Google Scholar]
- 63.Mannello F. Serum or plasma samples? The "Cinderella" role of blood collection procedures: preanalytical methodological issues influence the release and activity of circulating matrix metalloproteinases and their tissue inhibitors, hampering diagnostic trueness and leading to misinterpretation. Arterioscler Thromb Vasc Biol. 2008;28:611–614. doi: 10.1161/ATVBAHA.107.159608. [DOI] [PubMed] [Google Scholar]
- 64.Herder C, Haastert B, Müller-Scholze S, Koenig W, et al. Association of systemic chemokine concentrations with impaired glucose tolerance and type 2 diabetes: results from the Cooperative Health Research in the Region of Augsburg Survey S4 (KORA S4) Diabetes. 2005;54(Suppl 2):S11–S17. doi: 10.2337/diabetes.54.suppl_2.s11. [DOI] [PubMed] [Google Scholar]
Associated Data
This section collects any data citations, data availability statements, or supplementary materials included in this article.


