

Abstract
Voriconazole (VRC) plasma trough concentrations (Cmin) are highly variable, and this could affect treatment efficacy and safety in patients undergoing allogeneic hematopoietic stem cell transplantation (AHSCT). We aimed to describe the intra- and interindividual variation of VRC Cmin throughout the course of VRC therapy and to identify the determinants of this variation. Clinical data, medications, and VRC Cmin (n = 308) of 33 AHSCT patients were retrospectively collected. Cytochrome P450 (CYP450) genotypes of CYP2C19, CYP3A4, and CYP3A5 patients were retrospectively determined before allografting, and a combined genetic score was calculated for each patient. The higher the genetic score, the faster the metabolism of the patient. The VRC Cmin inter- and intraindividual coefficients of variation were 84% and 68%, respectively. The VRC dose (D) was correlated to VRC Cmin (r = 0.412, P < 0.0001) only for oral administration. The administration route and the genetic score significantly affected the initial VRC Cmin. Considering oral therapy, patients with a genetic score of <2 had higher initial VRC Cmin/D than patients with a genetic score of >2 (P = 0.009). Subsequent VRC Cmin remained influenced by the genetic score (P = 0.004) but were also affected by pump proton inhibitor comedication (P < 0.0001). The high variability of VRC Cmin in AHSCT patients is partially explained by the route of administration, treatment with pump proton inhibitors, and the combined genetic score. This study suggests the interest in combined genetic score determination to individualize a priori the VRC dose and underlines the need for longitudinal therapeutic drug monitoring to adapt subsequent doses to maintain the VRC Cmin within the therapeutic range.
INTRODUCTION
Recipients of allogeneic hematopoietic stem cell transplants (AHSCT) are at high risk of developing invasive fungal infections (IFIs), in particular invasive aspergillosis (IA). Voriconazole (VRC) is a broad-spectrum triazole antifungal used as the first-line treatment of IA. Despite adequate care, mortality due to IA remains very high, reaching 56% in AHSCT patients (1). One possible explanation for this high rate of treatment failure could be insufficient exposure to treatment. Indeed, several studies performed in heterogeneous cohorts of patients with underlying hematological malignancy, solid organ transplantation, surgery, or various chronic diseases have suggested an association between low plasma trough concentrations (Cmin) and treatment failure. For example, the lack of response to VRC therapy was more frequent in patients with a VRC Cmin of ≤1 mg/liter (46%) than in those with a VRC Cmin of >1 mg/liter (12%) (2). Similarly, VRC Cmin in patients failing to respond to VRC therapy were lower than those in successfully treated patients (3). Finally, a median VRC Cmin of >2.2 mg/liter was found to be a strong predictor of microbiological or clinical success (4). Thus, a therapeutic target of between 1 and 4 to 6 mg/liter for VRC Cmin has recently been proposed by the British Society for Medical Mycology (5). However, the VRC Cmin is frequently below this efficacy threshold in patients suffering from hematologic malignancies (6, 7), notably in AHSCT patients (8).
The VRC Cmin exhibits large inter- and intraindividual variabilities (4, 9, 10) that could be related in part to nonlinear pharmacokinetics, metabolization via cytochrome P450 (CYP450), and drug-drug interactions (3, 11). Younger age (3, 6, 12), oral administration of VRC (3), and concomitant medication with enzyme inducers like phenytoin, rifampin, or glucocorticoids (3, 13) are associated with decreased VRC Cmin. In this context, therapeutic drug monitoring (TDM) of VRC is of particular interest. A prospective randomized study has recently demonstrated the interest in VRC TDM, since an improvement of treatment response and a decrease of drug discontinuation due to adverse effects was obtained in patients benefiting from TDM (14). Nevertheless, TDM allows dose adjustment a posteriori, whereas it seems crucial to obtain an adequate VRC Cmin as soon as possible after the start of treatment (4, 15). Indeed, an initial VRC Cmin of ≤0.35 mg/liter appeared to be a strong predictor of mortality (4). Since VRC is extensively metabolized by CYP450 (16), it could be hypothesized that genetics affecting CYP450 have also a strong influence on initial VRC Cmin, in addition to drug-drug interactions (3, 11, 13) and route of administration (3). Thus, identification of relevant genetic polymorphisms could be useful when proposing a priori dose adjustment and to reach an adequate VRC Cmin from the first determination. The CYPs 2C19, 3A4, 3A5, and to a lesser extent, 2C9, are involved in VRC metabolism (16–18); all of these CYPs exhibit a number of clinically relevant polymorphisms. Genetic studies focusing on the CYP2C19 genotype have already demonstrated a link between the gain-of-function allele *17 and an insufficient VRC Cmin (19) or between alleles *2 and *3 and an increased VRC Cmin (20). The impact of the CYP2C19 genotype on VRC pharmacokinetics was later confirmed by several population pharmacokinetic studies (13, 21). Moreover, the presence of a CYP2C19 polymorphism has been associated with a higher frequency of out-of-range VRC Cmin in lung transplant cystic fibrosis patients (22). Conversely, the variability of CYP3A activity on VRC pharmacokinetics has been less studied. In healthy subjects, cotreatment with a CYP3A inhibitor increased VRC exposure, particularly in poor metabolizers of CYP2C19 (23, 24), and CYP3A5 variants did not influence VRC single-dose pharmacokinetics (25). More recently, the T allele of the rs4646437 polymorphism located in an intronic area of the CYP3A4 was associated with higher VRC levels in Chinese patients (26). However, the impact of the new variant CYP3A4*22 (conferring decreased CYP3A4 activity) (27) on VRC pharmacokinetics has never been investigated.
The intraindividual variability of VRC Cmin is also considerable (4, 9, 10), requiring regular VRC Cmin determinations throughout the duration of VRC treatment (5). Some authors reported no correlation between the first and subsequent VRC Cmin (9), whereas others showed that initial and subsequent VRC Cmin were correlated only when the initial VRC Cmin was greater than 2 mg/liter (10).
This retrospective study aimed to describe the variations of VRC Cmin throughout the course of VRC therapy in a cohort of AHSCT patients and to identify the determinants of the variability in the first and subsequent VRC Cmin.
MATERIALS AND METHODS
Patients.
This study was conducted in Grenoble University Hospital Center, France. Adult (>18 years old) patients who had received an AHSCT, were treated with VRC, and underwent TDM of VRC between January 2011 and July 2013 were eligible. VRC Cmin determined before the allograft or before VRC pharmacokinetics reached a steady state and patients with less than three VRC Cmin determinations were excluded. After treatment initiation (without loading dose) or dose adjustment, a 3-day period was considered necessary to obtain a VRC Cmin steady state (23). Demographic, biological (transaminase levels), clinical data, records concerning VRC therapy (Cmin, daily dose, and route of administration), and concomitant medications were retrospectively collected. All patients gave written informed consent for genetic analysis, sample collection, and use of their data. This retrospective study was performed on residual samples stored in a biological sample collection (DRC-2013-1983) and was approved by the regional Ethics Committee.
Classification of invasive aspergillosis.
IFIs were classified as possible, probable, or proven according to guidelines from the European Organization for Research and Treatment of Cancer/European Invasive Infections Cooperative Group and the criteria of the National Institute of Allergy and Infectious Diseases-Mycoses Study Group (EORTC/MSG) (28).
Measurement of plasma VRC trough concentration.
The plasma VRC trough concentration was determined on samples handled just before the subsequent VRC administration. VRC Cmin were measured by a validated liquid chromatography-tandem mass spectrometry method (29). Briefly, after protein precipitation, samples were injected into a 2-dimensional chromatographic system. In the first step, samples were cleaned in a perfusion chromatography column before being eluted and transferred to an analytical column. Finally, compounds were detected by tandem mass spectrometry. The plasma drug standard curve ranged from 0.1 to 20 mg/liter. The therapeutic range was between 1 and 5 mg/liter.
Genotyping.
Genotyping was performed retrospectively on residual samples from routine biological analyses collected before the allograft. DNA was extracted from white blood cells using Macherey-Nagel NucleoSpin Blood L kit (Macherey-Nagel, Hoerd, France). The quality and quantity of DNA were checked with the NanoDrop 2000 spectrophotometer (Thermo Scientific, Illkirch, France).
CYP2C19 genotyping.
CYP2C19 genotyping was performed by direct sequencing after DNA amplification using specific primers for the *2, *3 (associated with low CYP2C19 activity), and *17 (associated with increased CYP2C19 activity) alleles (see Table S1 in the supplemental material). The presence of the wild-type allele CYP2C19*1 was inferred in the absence of CYP2C19*2, CYP2C19*3, and CYP2C19*17. Patients were classified as ultrarapid (URM), extensive (EM), or intermediate (IM) metabolizers according to the established genotype-phenotype relationships proposed by Mega and colleagues (see Table S2 in the supplemental material) (30).
CYP3A genotyping.
The CYP3A4*22 allele (associated with low CYP3A4 activity) and the CYP3A5*1 allele (associated with CYP3A5 expression) were studied using the TaqMan allelic discrimination assay (Life Technologies, Illkirch, France). Patients were classified as intermediate metabolizers (IM) if they had the *22 allele and extensive metabolizers (EM) if they did not.
Determination of genetic score.
To evaluate the impact of both CYP2C19 and CYP3A genotypes, a combined genetic score was calculated for each patient.
First, a specific genetic score was separately attributed to each CYP2C19 and CYP3A genotype cluster, as previously proposed by Goutelle et al. (31) and Moes et al. (32), and both specific scores were then added to obtain the combined genetic score (see Table 2). Briefly, the specific genetic score for each cytochrome was determined as follows: the absence of any polymorphism (genotype *1/*1 for CYP2C19, absence of CYP3A4*22 and presence of CYP3A5*3/*3 for CYP3A) conferred a score equal to 1, whereas the presence of a gain- or a loss-of-function allele inferred, respectively, an increase or a decrease in the genetic score. The fluctuation of the genetic score was ±0.5 when the gain- or the loss-of-function allele was heterozygous or ±1 when the gain- or the loss-of-function allele was homozygous.
TABLE 2.
Calculated combined genetic scores according to CYP2C19 and CYP3A genotypes
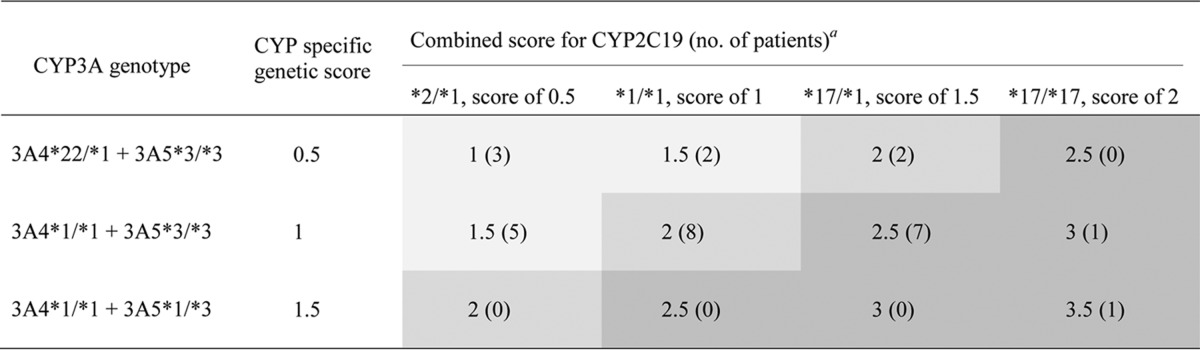
The 3 genetic score categories are indicated as follows: a genetic score of <2 is indicated by light gray shading, a genetic score equal to 2 is indicated by medium gray shading, and a genetic score of >2 is indicated by dark gray shading.
The combined genetic score was calculated to reflect the hepatic clearance (ClH) of VRC expressed as follows: ClH = Cl VRC N-oxidation + Cl VRC hydroxylation (33). VRC N-oxidation depends on CYP2C19 and CYP3A activities, which exhibited similar Km values in an in vitro study (17), while VRC hydroxylation depends on only the activity of CYP3A isoforms (17). Thus, the same weight was attributed to CYP2C19 and to CYP3A4.
The combined genetic score was expressed in arbitrary units. Patients were classified into three categories of combined genetic score: <2, 2, and >2. A combined genetic score equal to 2 corresponds to normal CYP2C19 and CYP3A activities (or the association of one gain-of-function allele and one loss-of-function allele), whereas a combined genetic score of <2 or >2 reflects diminished or increased CYP2C19 and CYP3A activities, respectively.
Data analysis.
Statistical analyses were performed using Statview software, version 5.0 (SAS Institute, Cary, NC). Quantitative data are expressed as median and 10th and 90th percentiles. Statistical analyses were performed separately on the initial VRC Cmin and on the subsequent VRC Cmin. Comparisons between groups (male versus female, intravenous [i.v.] therapy versus oral therapy, CYP2C19 and CYP3A phenotypes, and categories of genetic score) were performed with nonparametric tests (Mann-Whitney test to compare 2 groups or Kruskal-Wallis test followed by Bonferroni adjusted t test to compare at least 3 groups). A Wilcoxon rank test was used for the comparison of pairwise series. As the numbers of VRC Cmin determinations varied among patients, the frequency of a VRC Cmin of ≤1 mg/liter was calculated for each patient. The percentages of VRC Cmin of ≤1 mg/liter according to the combined genetic score groups were compared using Fisher's test at the first VRC Cmin determination and using the Mann-Whitney test for subsequent VRC Cmin. A Spearman test was used to study the correlation between two quantitative variables. The Hardy-Weinberg equilibrium was tested for each polymorphism by the online method of Rodriguez et al. (34). Univariate and multivariate linear regression analyses were used to identify the determinants contributing to the variability of VRC Cmin. A P value of <0.05 was considered statistically significant.
RESULTS
Population characteristics.
Thirty-three AHSCT patients were included in our study. Table 1 summarizes their demographic characteristics, hematological diagnoses, and conditioning regimens. All patients received VRC therapy for secondary prophylaxis of IFI. The classification of IFI is detailed in Table 1, but for 2 patients, IFI could not be retrospectively classified.
TABLE 1.
Demographic and clinical characteristics of 33 allogeneic hematopoietic stem cell transplantation patients who experienced therapeutic drug monitoring of voriconazole
| Characteristic | Value for characteristic |
|---|---|
| Demographics | |
| Age, yra | 52.2 (35.1–60.1) |
| Male, no. (%) | 20 (61) |
| BMI, kg/m2a | 22.5 (16.6–31.4) |
| Classification of IFI, no. (%)b | |
| Proven | 2 (6) |
| Probable | 15 (46) |
| Possible | 14 (42) |
| NDc | 2 (6) |
| Hematological diagnoses, no. (%) | |
| Acute myeloid leukemia | 22 (67) |
| Acute lymphoblastic leukemia | 5 (15) |
| Non-Hodgkin lymphoma | 3 (9) |
| Chronic lymphocytic leukemia | 2 (6) |
| Myelodysplastic syndrome | 1 (3) |
| Conditioning regimens, no. (%) | |
| Myeloablative | 8 (24) |
| Non-myeloablative | 25 (76) |
| Matching, no. (%) | |
| Yes | 22 (67) |
| No | 11 (33) |
These data are expressed as median (10th to 90th percentiles).
IFI, invasive fungal infection. All patients were treated for invasive pulmonary aspergillosis, except one patient who had invasive Candida infection.
ND, not determined.
CYP450 polymorphisms.
Genotyping was performed for 88% of patients (n = 29) (blood samples before the allograft were not available for the other patients). The proportions of the CYP2C19 and -3A genotypes are described in Tables S2 and S3 in the supplemental material. For CYP2C19, 37% (n = 11), 34% (n = 10), and 28% (n = 8) of patients were classified as URM, EM, and IM, respectively. All patients classified as IM for CYP2C19 expressed the *2 allele, while no *3 allele was detected in our cohort. The CYP3A4*22 polymorphism was detected in 24% (n = 7) of patients, and a single patient expressed CYP3A5. The Hardy-Weinberg equilibrium was respected for each allele (CYP2C19*2, χ2 = 0.74, P = 0.39; CYP2C19*17, χ2 = 0.34, P = 0.56; CYP3A4*22, χ2 = 0.55, P = 0.46), and no linkage disequilibrium was detected between the CYP3A4 and CYP2C19 genotypes (P = 0.46). Concerning the combined genetic score, 34% of patients (n = 10) had a genetic score of <2, 34% (n = 10) had a genetic score equal to 2, and 31% (n = 9) had a genetic score of >2 (Table 2).
VRC therapeutic drug monitoring.
A total of 308 VRC Cmin were analyzed (Table 3), representing a median of 9 dosages per patient (range, 3 to 25 dosages) for a median follow-up duration of VRC Cmin TDM of 94 days (range, 14 to 269 days). The median delay between two VRC Cmin determinations was 7 days (range, 4 to 21 days). The descriptions of VRC Cmin, proportions of oral VRC therapy, and comedications are detailed in Table 3. The interindividual coefficient of variation (CV) was 84%, whereas the median intraindividual CV was 68% (range, 14 to 185%). Forty-two percent of VRC Cmin were out of the therapeutic range, and 85% (n = 28) of patients had at least one inadequate VRC Cmin during their course of treatment. Figure 1a illustrates this high intra- and interindividual variability.
TABLE 3.
Voriconazole plasma trough concentrations and concomitant treatments
| Parametera | Result for VRC Cmin determinations |
||
|---|---|---|---|
| All (n = 308) | Initial (n = 33) | Subsequent (n = 275) | |
| VRC Cmin, mg/liter | |||
| Mean | 1.6 | 1.9 | 1.6 |
| Median | 1.3 | 1.4 | 1.3 |
| Range | <0.1–9.7 | <0.1–9.7 | <0.1–8.1 |
| VRC Cmin level, % | |||
| ≤1 mg/liter | 40 | 33 | 36 |
| >5 mg/liter | 2 | 6 | 1 |
| Frequency of VRC oral therapy, %b | 82 | 58 | 85 |
| Determination during hospitalization, % | 29 | 64 | 25 |
| VRC dosing, mg/dayc | 400 (400–600) | 400 (400–617) | 400 (400–600) |
| Concomitant treatment, % | |||
| Cyclosporine/tacrolimus/otherd | 47/13/40 | 73/9/18 | 44/14/42 |
| Enzyme inhibitor(s)e | 41 | 15 | 44 |
| Glucocorticoid(s)f | 29 | 18 | 30 |
| Esomeprazole/pantoprazole/rabeprazole/no PPI | 40/55/3/2 | 42/49/3/6 | 40/55/3/2 |
VRC, voriconazole; Cmin, trough concentration; PPI, pump proton inhibitor.
Only the tablet form was used for oral VRC therapy.
These data are expressed as median (10th to 90th percentiles).
“Other” included immunosuppressive therapy with mycophenolate or everolimus or the absence of immunosuppressive therapy.
Enzyme inhibitors included dihydropyridines, macrolides, verapamil, amiodarone, amitriptyline, citalopram, and metronidazole (all of these drugs are CYP2C19 and/or CYP3A inhibitors).
The glucocorticoids used were prednisone, prednisolone, and methylprednisolone.
FIG 1.

Variability of voriconazole plasma trough concentrations. (a) Serial voriconazole plasma trough concentrations determined in 33 post-AHSCT patients. All patients had at least 3 voriconazole concentration determinations, including several similar voriconazole concentrations for patients 7 and 23. The area shaded in gray represents the therapeutic range. (b) Relationships between voriconazole dose (expressed as mg per day) and plasma trough concentration for both routes of administration. Data are presented as interquartile range (boxes), data range (whiskers), and median (horizontal line). Numbers are indicated above boxes.
During the course of treatment of the 33 patients, 30 VRC dose adjustments for 16 patients were performed, representing 11% of 275 follow-up VRC Cmin for 48% of patients. Seventy percent (n = 21) of these dose modifications were realized without changing the VRC route of administration, while 27% (n = 8) resulted from an i.v.-to-oral switch, and 3% (n = 1) were discontinuations of VRC therapy due to an overdose.
Figure 1b shows the relationships between VRC daily dose (expressed in mg per day) and VRC Cmin for both routes of administration. Considering oral administration, the VRC Cmin presented a CV of 72% and was weakly correlated to the VRC daily dose (r = 0.412, P < 0.0001), while i.v. administration led to a VRC Cmin CV of 101%, and no correlation was found with the daily dose (r = 0.096, P = 0.5).
Initial VRC trough concentrations.
The description of the initial VRC Cmin is detailed in Table 3. Thirty-nine percent of initial VRC Cmin were out of the therapeutic range, with the majority under the lower therapeutic limit: 33% were ≤1 mg/liter, and 6% were >5 mg/liter. VRC i.v. administration was associated with a higher initial VRC Cmin compared to oral treatment (i.v., 1.7 mg/liter [range, 0.3 to 5.9 mg/liter], versus oral, 1.0 mg/liter [range, 0.1 to 2.9 mg/liter]; P = 0.03). Sex, age, body mass index (BMI), and proton pump inhibitor (PPI) treatment or enzymatic inhibitor treatment as well as transaminase levels had no impact on the initial VRC Cmin (data not shown).
Influence of CYP450 polymorphisms on initial VRC trough concentrations.
The influence of CYP450 polymorphisms was studied on the initial VRC Cmin adjusted on VRC dose (VRC Cmin/D) to overcome the influence of VRC dose. After oral administration, the CYP2C19 phenotype affected the initial VRC Cmin/D (Kruskal Wallis test, P = 0.04), with a higher initial VRC Cmin/D in IM compared to URM patients (post hoc test, P = 0.007) (Fig. 2a). Similarly, the presence of the *22 allele for CYP3A4 was associated with a statistically significant increased VRC Cmin/D (Fig. 2c). When patients were stratified on CYP2C19 phenotype, expression of CYP3A4*22 was associated with increased initial VRC Cmin/D whatever the CYP2C19 phenotype (see Fig. S1 in the supplemental material). In univariate analysis, the combined genetic score was significantly correlated to VRC Cmin/D (r = −0.748; P = 0.002). As shown in Fig. 2, a genetic score of >2 was associated with a lower VRC Cmin/D compared to a genetic score of <2 (post hoc test, P = 0.009) (Fig. 2e).
FIG 2.

Influence of CYP450 polymorphisms on initial voriconazole plasma trough concentrations adjusted on the dose (VRC Cmin/D). (a and b) Influence of CYP2C19 phenotypes on initial VRC Cmin/D ratio obtained during VRC oral treatment (PO) (a) and on all initial VRC Cmin/D ratios (oral and i.v. [PO + IV]) (b). (c and d) Influence of CYP3A phenotypes on the initial VRC Cmin/D ratio obtained during VRC oral treatment (c) and on all initial VRC Cmin/D ratios (d). (e and f) Influence of the combined genetic score on the initial VRC Cmin/D ratio obtained during VRC oral treatment (e) and on all initial VRC Cmin/D ratios (f). Data are presented as interquartile range (boxes), data range (whiskers), and median (horizontal line). Only the significant P value obtained for the post hoc Bonferroni test (<0.0167) is shown. Abbreviations: VRC, voriconazole; CYP, cytochrome; PO, per os; IV, intravenous; URM, ultrarapid metabolizer; EM, extensive metabolizer; IM, intermediate metabolizer.
Studying all initial VRC Cmin independently of the VRC route of administration provided similar results: a trend toward an influence of the CYP2C19 phenotype (Kruskal-Wallis test, P = 0.08) (Fig. 2b) and the *22 allele (Mann-Whitney test, P = 0.05) (Fig. 2d) as well as the combined genetic score (Kruskal-Wallis test, P = 0.05) (Fig. 2f) on the first VRC Cmin/D.
None of the patients having a combined genetic score of <2 presented an initial VRC Cmin of ≤1 mg/liter, while 47% of the patients having a combined genetic score of ≥2 had an initial VRC Cmin of ≤1 mg/liter (Fisher's test, P = 0.01).
In a multiple linear regression model integrating the VRC route of administration, initial VRC dose, and combined genetic score, the combined genetic score remained an independent predictor of initial VRC Cmin (r2 = 0.33; P = 0.04).
Subsequent VRC trough concentrations.
Longitudinal TDM of VRC Cmin is detailed in Table 3. Thirty-seven percent of the subsequent VRC Cmin were outside the therapeutic range, with 36% at ≤1 mg/liter and 1% at >5 mg/liter. The route of administration had no impact on follow-up VRC Cmin (i.v., 0.9 mg/liter [range, 0.3 to 4.8 mg/liter], versus oral, 1.4 mg/liter [range, 0.2 to 3.3 mg/liter]; P = 0.9). As observed for initial VRC Cmin, age, BMI, and transaminase levels were not related to subsequent VRC Cmin (data not shown).
Influence of CYP450 polymorphisms on subsequent VRC trough concentrations.
The combined genetic score influenced the subsequent VRC Cmin or subsequent VRC Cmin/D (Fig. 3a and b) (Kruskal-Wallis test, P = 0.004 and P < 0.0001, respectively). The subsequent VRC Cmin of patients having a combined genetic score of >2 were lower than those of patients with a combined genetic score of <2 (post hoc test, P = 0.002).
FIG 3.

Influence of the genetic score on follow-up voriconazole plasma trough concentrations. Shown are the follow-up VRC Cmin (a) or Cmin/D ratio (b) according to the combined genetic score. Data are presented as interquartile range (boxes), data range (whiskers), and median (horizontal line), and only the significant P value obtained for the post hoc Bonferroni test (<0.0167 for three groups) is shown. (c) Temporal evolution of VRC trough concentrations throughout longitudinal TDM according to the combined genetic score. The area shaded in gray represents the therapeutic range. Solid circles, triangles, and squares represent the mean (± standard deviation) VRC Cmin for patients having genetic scores of <2, equal to 2, and >2, respectively. The asterisk indicates a P value of <0.05 for the Kruskal-Wallis test. Second, third, fourth, and fifth determinations of VRC Cmin were obtained after median periods of 7 (range, 2.8 to 28), 14 (range, 7.0 to 36), 35 (range, 11 to 59), and 53 (range, 20 to 87) days after the first determination.
Figure 3c shows the evolution of VRC Cmin during repeated TDM in patients stratified according to the combined genetic score. As previously shown in Fig. 2c, the initial VRC Cmin was significantly affected by the combined genetic score (Kruskal-Wallis test, P = 0.03), while at each subsequent TDM VRC Cmin measurement, the VRC Cmin was not significantly different between the combined genetic score categories.
The frequency of VRC Cmin of ≤1 mg/liter was higher (P = 0.05) in patients having a combined genetic score of ≥2 (50% [range, 0 to 100%]) than in those with a combined genetic score of <2 (21% [range, 0 to 56%]).
Influence of diarrhea on subsequent VRC trough concentrations.
Clinical events contemporary with VRC Cmin measurements were available for 77% of subsequent VRC Cmin (n = 212). Since diarrhea could impact VRC Cmin by reducing VRC absorption, the effect of diarrhea was investigated during per os VRC therapy. Among the 235 VRC Cmin obtained during oral VRC treatment, clinical events were available for 193 VRC Cmin. Eleven episodes of diarrhea were reported by 9 different patients (i.e., a frequency of 6%). VRC Cmin was not influenced by diarrhea (VRC Cmin with and without diarrhea, 1.6 mg/liter [range, 0.3 to 3.8 mg/liter] versus 1.3 mg/liter [range, 0.2 to 2.9 mg/liter]; P = 0.2). The influence of gastrointestinal graft versus host disease (GVHD) or mucositis could not be tested in our cohort because only two episodes of gastrointestinal GVHD and one of mucositis were reported during the course of VRC oral treatment.
Influence of concomitant medication on subsequent VRC trough concentrations.
Data on concomitant treatments were available for 95% of VRC Cmin (n = 259). Ninety-four percent (n = 244) of the subsequent VRC Cmin were determined while the patient was on PPI treatment; esomeprazole and pantoprazole were the most frequently used PPIs (Table 3). Each PPI influenced the VRC Cmin differently (Kruskal-Wallis test, P < 0.0001) (Fig. 4). Post hoc analysis revealed a higher VRC Cmin when the PPI was esomeprazole compared to pantoprazole (P < 0.0001), whereas there was no statistically significant difference between rabeprazole and esomeprazole or pantoprazole. This difference was also observed after stratification of patients according to combined genetic scores (data not shown).
FIG 4.
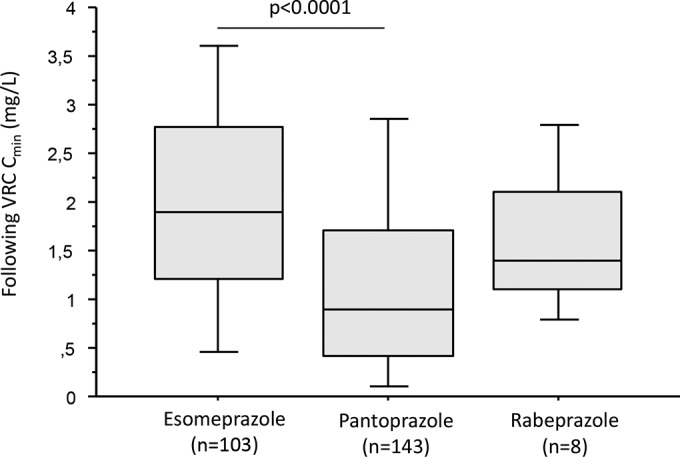
Influence of pump proton inhibitor treatment on voriconazole plasma trough concentrations. Data are presented as interquartile range (boxes), data range (whiskers), and median (horizontal line).
Treatment with glucocorticoids had no impact on VRC Cmin (1.3 mg/liter [range, 0.1 to 3.2 mg/liter] with treatment versus 1.4 mg/liter [range, 0.3 to 3.4 mg/liter] without; P = 0.2). Since a multicenter study recently reported an interaction between glucocorticoids and VRC (3), a pairwise patient analysis was performed to further explore this drug-drug interaction. Patients who benefited from VRC Cmin determinations with and without concomitant treatment by corticoids for at least 7 days were selected (n = 10). For each patient, the mean VRC Cmin with or without glucocorticoid treatment was calculated. To overcome the influence of the route of administration, only VRC Cmin obtained during oral therapy were used. Comparison of VRC Cmin in these paired series confirmed the absence of any effect of glucocorticoid treatment on VRC Cmin (see Fig. S2 in the supplemental material).
A possible interaction between PPI and steroid use was excluded since the frequencies of steroid use during esomeprazole and pantoprazole treatment were similar (36% of steroid use during esomeprazole treatment versus 29% for pantoprazole; χ2 test, P = 0.4).
Immunosuppressive therapies, including calcineurin inhibitors, mycophenolate, or everolimus, had no effect on subsequent VRC Cmin. Similarly, the subsequent VRC Cmin was not influenced by comedication with various CYP2C19 and/or CYP3A enzyme inhibitors (data not shown).
DISCUSSION
The present study demonstrates that in a homogeneous cohort of AHSCT patients, the VRC Cmin exhibits high inter- and intraindividual variability, resulting in almost half of the VRC Cmin being out of the therapeutic range. On the whole, this variability could be partially explained by a combined genetic score that takes into account both CYP2C19 and 3A genotypes, the VRC route of administration, and any comedication with PPI.
Early optimal antifungal therapy improves the clinical outcome in patients with IFI (35, 36), and an initial VRC Cmin of ≤0.35 mg/liter is a strong predictor of mortality (4). These studies suggested the importance of adjusting the VRC dose right from the first administration to reach the VRC Cmin within the therapeutic range early on. Our study demonstrates for the first time that a genetic score combining both CYP2C19 and -3A4 genotypes is an independent predictor of initial VRC Cmin. The impact of a CYP2C19 phenotype on the initial VRC Cmin was already suggested by a study on a Korean cohort of patients with hematological diseases, without reaching statistical significance (37). In our cohort, CYP2C19 IM patients had a statistically significantly higher initial VRC Cmin/D than CYP2C19 URM patients, confirming the importance of CYP2C19 polymorphisms on the variability of the initial VRC Cmin. In addition to CYP2C19, VRC is also metabolized through the CYP3A pathway (16), which also exhibits clinically relevant polymorphisms. Our study provides the first demonstration that the CYP3A4*22 polymorphism also significantly influences the VRC Cmin in AHSCT patients, since it was associated with a higher initial VRC Cmin/D. Recently, the rs4646437 polymorphism of the CYP3A4 gene was also associated with higher VRC levels in Chinese patients (26). These genetic data, combined with several studies focusing on drug-drug interaction (23, 24), suggest the importance of CYP3A4 activity in VRC metabolism.
Since the frequencies of CYP2C19 and CYP3A single nucleotide polymorphisms were independent of one another, it was therefore of interest to calculate a combined genetic score integrating both CYP genotypes. Interestingly, a combined genetic score of <2 was associated with a higher VRC Cmin/D compared to a combined genetic score of >2. Moreover, none of the patients having a combined genetic score of <2 presented an initial VRC Cmin inferior to the efficacy threshold fixed at 1 mg/liter, while 47% of the patients with a combined genetic score of ≥2 had a subtherapeutic initial VRC Cmin. These data suggest that this combined genetic score could help to individualize the VRC dose from the first administration onwards, as recently suggested for CYP2C19 (13, 38), and reduce the risk of out-of-range VRC Cmin at the first determination.
Throughout VRC treatment, repeated adequate sustained VRC Cmin measurements, rather than a single VRC Cmin determination, have been shown to ensure treatment success (4, 12, 39). However, few studies have focused on longitudinal VRC TDM (4, 10, 12, 22), even though it is recommended to repeat VRC Cmin determinations during therapy (5) in view of the large VRC intraindividual variability (4, 7), especially in AHSCT patients (10).
Follow-up VRC Cmin remained influenced by the combined genetic score, despite dose adjustment being made during longitudinal TDM. However, this finding could be explained by the low frequency of dose adjustments in our cohort; in fact, VRC dose adjustments were made for only 16% of patients, while 85% of patients had at least one VRC Cmin outside the therapeutic range and would be likely to need a VRC dose adjustment. Nevertheless, the genetics-related variability of VRC Cmin was slightly reduced during TDM, notably after 5 VRC Cmin measurements, although VRC Cmin variability remained high.
Concomitant treatments are known to affect VRC Cmin, notably drugs able to influence VRC metabolism by competition at the CYP catalytic site, such as PPIs (3, 7), or by induction of protein expression, such as phenytoin (3). In our cohort, PPIs were used widely, and pantoprazole was associated with lower VRC Cmin than esomeprazole. Consistent with these findings, an in vitro study on human liver microsomes has demonstrated that pantoprazole has a lower inhibitory potency on CYP2C19 activity than esomeprazole and to a lesser extent rabeprazole (40). Conversely, PPIs exhibited no inhibition of CYP3A activity at concentrations in the same order of magnitude as the plasma levels encountered in vivo (40). Thus, the reduced VRC Cmin in patients treated with pantoprazole we observed could be explained by its lower inhibitory potency on CYP2C19 activity. However, the effect of PPIs, especially pantoprazole on the VRC Cmin, is far from fully understood since clinical studies investigating VRC pharmacokinetics have demonstrated either increased (3) or decreased (6, 41) VRC Cmin in patients treated with pantoprazole compared to those in untreated PPI patients. Since it is well known that PPIs competitively inhibit CYP2C19 (3, 7, 40), taken together, these results suggest that PPI treatment significantly contributes to the variability of VRC Cmin.
Another drug-drug interaction, between VRC and glucocorticoids, leading to reduced VRC Cmin has been suggested by a single study (3) and has been proposed to be the result of CYP induction by glucocorticoids. However, our data and those from other studies (6, 42) did not support such an interaction, and in the present study, steroid use induced no significant change in VRC Cmin both in the overall analysis performed with all VRC Cmin and in the pairwise patient analysis. These conflicting results could be explained by the heterogeneity of the studied populations and the type and dose of the glucocorticoid. Indeed, AHSCT patients in our study preferentially received prednisone, prednisolone, and/or methylprednisolone at low and decreasing doses, whereas the effect of glucocorticoids was previously demonstrated in a heterogeneous population, including patients suffering from autoimmune diseases for whom dexamethasone treatment was more frequent and glucocorticoid doses were higher (3).
In our cohort, sex, age, and BMI had no impact on VRC Cmin, whereas previous studies have identified age (3, 6, 12) and BMI (3, 6) as factors influencing VRC Cmin. However, the patients in the latter studies were much older and had a higher BMI than those of our cohort, which could contribute to explaining these discrepancies.
There are several limitations of our study. First, this study was retrospective, performed in a single center and on a small number of patients: thus, the influence of the combined genetic score on VRC efficacy and safety could not be evaluated. Second, we have arbitrarily chosen to attribute similar weights to CYP2C19 and CYP3A since (i) VRC N-oxidation results from the simultaneous action of CYP2C19 and CYP3A (17, 18), both CYPs exhibiting similar Km values (17), and (ii) VRC oxidation depends on only CYP3A isoforms (17). However, we acknowledge that the relative contributions of each CYP and relationships between CYP polymorphisms and activities remain to be further defined.
In conclusion, our data confirm the influence of CYP2C19 and provide strong evidence that CYP3A genotypes also influence VRC exposure in AHSCT patients. In this regard, the determination of a genetic score taking into account both CYP genotypes could be of clinical interest to adjust a priori the first VRC doses. Our data provide the groundwork for a multicenter prospective trial to confirm the clinical benefit of VRC first-dose adjustment for the combined genetic score, route of administration, and comedications and adaptation of the following doses according to longitudinal TDM.
Supplementary Material
ACKNOWLEDGMENTS
We thank Christel Roche, Karine Scalabrino, and Cécile Girard for excellent technical assistance, Alison Foote for editing the manuscript, and Martine Chauvet, Dominique Leroux, Céline Suchaud, Marion Stabile, Dominique Masson, and Beatrice Bardy for collaboration.
No conflicts of interest are declared.
Footnotes
Supplemental material for this article may be found at http://dx.doi.org/10.1128/AAC.04838-14.
REFERENCES
- 1.Lortholary O, Gangneux JP, Sitbon K, Lebeau B, de Monbrison F, Le Strat Y, Coignard B, Dromer F, Bretagne S, French Mycosis Study Group . 2011. Epidemiological trends in invasive aspergillosis in France: the SAIF Network (2005-2007). Clin Microbiol Infect 17:1882–1889. doi: 10.1111/j.1469-0691.2011.03548.x. [DOI] [PubMed] [Google Scholar]
- 2.Pascual A, Calandra T, Bolay S, Buclin T, Bille J, Marchetti O. 2008. Voriconazole therapeutic drug monitoring in patients with invasive mycoses improves efficacy and safety outcomes. Clin Infect Dis 46:201–211. doi: 10.1086/524669. [DOI] [PubMed] [Google Scholar]
- 3.Dolton MJ, Ray JE, Chen SC, Ng K, Pont LG, McLachlan AJ. 2012. Multicenter study of voriconazole pharmacokinetics and therapeutic drug monitoring. Antimicrob Agents Chemother 56:4793–4799. doi: 10.1128/AAC.00626-12. [DOI] [PMC free article] [PubMed] [Google Scholar]
- 4.Miyakis S, van Hal SJ, Ray J, Marriott D. 2010. Voriconazole concentrations and outcome of invasive fungal infections. Clin Microbiol Infect 16:927–933. doi: 10.1111/j.1469-0691.2009.02990.x. [DOI] [PubMed] [Google Scholar]
- 5.Ashbee HR, Barnes RA, Johnson EM, Richardson MD, Gorton R, Hope WW. 2014. Therapeutic drug monitoring (TDM) of antifungal agents: guidelines from the British Society for Medical Mycology. J Antimicrob Chemother 69:1162–1176. doi: 10.1093/jac/dkt508. [DOI] [PMC free article] [PubMed] [Google Scholar]
- 6.Hoenigl M, Duettmann W, Raggam RB, Seeber K, Troppan K, Fruhwald S, Prueller F, Wagner J, Valentin T, Zollner-Schwetz I, Wölfler A, Krause R. 2013. Potential factors for inadequate voriconazole plasma concentrations in intensive care unit patients and patients with hematological malignancies. Antimicrob Agents Chemother 57:3262–3267. doi: 10.1128/AAC.00251-13. [DOI] [PMC free article] [PubMed] [Google Scholar]
- 7.Racil Z, Winterova J, Kouba M, Zak P, Malaskova L, Buresova L, Toskova M, Lengerova M, Kocmanova I, Weinbergerova B, Timilsina S, Rolencova M, Cetkovsky P, Mayer J. 2012. Monitoring trough voriconazole plasma concentrations in haematological patients: real life multicentre experience. Mycoses 55:483–492. doi: 10.1111/j.1439-0507.2012.02186.x. [DOI] [PubMed] [Google Scholar]
- 8.Trifilio S, Ortiz R, Pennick G, Verma A, Pi J, Stosor V, Zembower T, Mehta J. 2005. Voriconazole therapeutic drug monitoring in allogeneic hematopoietic stem cell transplant recipients. Bone Marrow Transplant 35:509–513. doi: 10.1038/sj.bmt.1704828. [DOI] [PubMed] [Google Scholar]
- 9.Miyakis S, van Hal SJ, Solvag CJ, Ray J, Marriott D. 2010. Clinician ordering practices for voriconazole therapeutic drug monitoring: experiences of a referral laboratory. Ther Drug Monit 32:661–664. doi: 10.1097/FTD.0b013e3181ea3de6. [DOI] [PubMed] [Google Scholar]
- 10.Trifilio SM, Yarnold PR, Scheetz MH, Pi J, Pennick G, Mehta J. 2009. Serial plasma voriconazole concentrations after allogeneic hematopoietic stem cell transplantation. Antimicrob Agents Chemother 53:1793–1796. doi: 10.1128/AAC.01316-08. [DOI] [PMC free article] [PubMed] [Google Scholar]
- 11.Nivoix Y, Levêque D, Herbrecht R, Koffel JC, Beretz L, Ubeaud-Sequier G. 2008. The enzymatic basis of drug-drug interactions with systemic triazole antifungals. Clin Pharmacokinet 47:779–792. doi: 10.2165/0003088-200847120-00003. [DOI] [PubMed] [Google Scholar]
- 12.Mitsani D, Nguyen MH, Shields RK, Toyoda Y, Kwak EJ, Silveira FP, Pilewski JM, Crespo MM, Bermudez C, Bhama JK, Clancy CJ. 2012. Prospective, observational study of voriconazole therapeutic drug monitoring among lung transplant recipients receiving prophylaxis: factors impacting levels of and associations between serum troughs, efficacy, and toxicity. Antimicrob Agents Chemother 56:2371–2377. doi: 10.1128/AAC.05219-11. [DOI] [PMC free article] [PubMed] [Google Scholar]
- 13.Dolton MJ, Mikus G, Weiss J, Ray JE, McLachlan AJ. 2014. Understanding variability with voriconazole using a population pharmacokinetic approach: implications for optimal dosing. J Antimicrob Chemother 69:1633–1641. doi: 10.1093/jac/dku031. [DOI] [PubMed] [Google Scholar]
- 14.Park WB, Kim NH, Kim KH, Lee SH, Nam WS, Yoon SH, Song KH, Choe PG, Kim NJ, Jang IJ, Oh MD, Yu KS. 2012. The effect of therapeutic drug monitoring on safety and efficacy of voriconazole in invasive fungal infections: a randomized controlled trial. Clin Infect Dis 55:1080–1087. doi: 10.1093/cid/cis599. [DOI] [PubMed] [Google Scholar]
- 15.Andes D, Lepak A. 2012. Editorial commentary: antifungal therapeutic drug monitoring progress: getting it right the first time. Clin Infect Dis 55:391–393. doi: 10.1093/cid/cis446. [DOI] [PubMed] [Google Scholar]
- 16.Hyland R, Jones BC, Smith DA. 2003. Identification of the cytochrome P450 enzymes involved in the N-oxidation of voriconazole. Drug Metab Dispos 31:540–547. doi: 10.1124/dmd.31.5.540. [DOI] [PubMed] [Google Scholar]
- 17.Murayama N, Imai N, Nakane T, Shimizu M, Yamazaki H. 2007. Roles of CYP3A4 and CYP2C19 in methyl hydroxylated and N-oxidized metabolite formation from voriconazole, a new anti-fungal agent, in human liver microsomes. Biochem Pharmacol 73:2020–2026. doi: 10.1016/j.bcp.2007.03.012. [DOI] [PubMed] [Google Scholar]
- 18.Yanni SB, Annaert PP, Augustijns P, Ibrahim JG, Benjamin DK, Thakker DR. 2010. In vitro hepatic metabolism explains higher clearance of voriconazole in children versus adults: role of CYP2C19 and flavin-containing monooxygenase 3. Drug Metab Dispos 38:25–31. doi: 10.1124/dmd.109.029769. [DOI] [PMC free article] [PubMed] [Google Scholar]
- 19.Hassan A, Burhenne J, Riedel KD, Weiss J, Mikus G, Haefeli WE, Czock D. 2011. Modulators of very low voriconazole concentrations in routine therapeutic drug monitoring. Ther Drug Monit 33:86–93. doi: 10.1097/FTD.0b013e31820530cd. [DOI] [PubMed] [Google Scholar]
- 20.Narita A, Muramatsu H, Sakaguchi H, Doisaki S, Tanaka M, Hama A, Shimada A, Takahashi Y, Yoshida N, Matsumoto K, Kato K, Kudo K, Furukawa-Hibi Y, Yamada K, Kojima S. 2013. Correlation of CYP2C19 phenotype with voriconazole plasma concentration in children. J Pediatr Hematol Oncol 35:e219–e223. doi: 10.1097/MPH.0b013e3182880eaa. [DOI] [PubMed] [Google Scholar]
- 21.Wang T, Chen S, Sun J, Cai J, Cheng X, Dong H, Wang X, Xing J, Dong W, Yao H, Dong Y. 2014. Identification of factors influencing the pharmacokinetics of voriconazole and the optimization of dosage regimens based on Monte Carlo simulation in patients with invasive fungal infections. J Antimicrob Chemother 69:463–470. doi: 10.1093/jac/dkt369. [DOI] [PubMed] [Google Scholar]
- 22.Berge M, Guillemain R, Trégouet DA, Amrein C, Boussaud V, Chevalier P, Lillo-Lelouet A, Le Beller C, Laurent-Puig P, Beaune PH, Billaud EM, Loriot MA. 2011. Effect of cytochrome P450 2C19 genotype on voriconazole exposure in cystic fibrosis lung transplant patients. Eur J Clin Pharmacol 67:253–260. doi: 10.1007/s00228-010-0914-2. [DOI] [PubMed] [Google Scholar]
- 23.Mikus G, Schöwel V, Drzewinska M, Rengelshausen J, Ding R, Riedel KD, Burhenne J, Weiss J, Thomsen T, Haefeli WE. 2006. Potent cytochrome P450 2C19 genotype-related interaction between voriconazole and the cytochrome P450 3A4 inhibitor ritonavir. Clin Pharmacol Ther 80:126–135. doi: 10.1016/j.clpt.2006.04.004. [DOI] [PubMed] [Google Scholar]
- 24.Shi HY, Yan J, Zhu WH, Yang GP, Tan ZR, Wu WH, Zhou G, Chen XP, Ouyang DS. 2010. Effects of erythromycin on voriconazole pharmacokinetics and association with CYP2C19 polymorphism. Eur J Clin Pharmacol 66:1131–1136. doi: 10.1007/s00228-010-0869-3. [DOI] [PMC free article] [PubMed] [Google Scholar]
- 25.Weiss J, Ten Hoevel MM, Burhenne J, Walter-Sack I, Hoffmann MM, Rengelshausen J, Haefeli WE, Mikus G. 2009. CYP2C19 genotype is a major factor contributing to the highly variable pharmacokinetics of voriconazole. J Clin Pharmacol 49:196–204. doi: 10.1177/0091270008327537. [DOI] [PubMed] [Google Scholar]
- 26.He HR, Sun JY, Ren XD, Wang TT, Zhai YJ, Chen SY, Dong YL, Lu J. 17 December 2014. Effects of CYP3A4 polymorphisms on the plasma concentration of voriconazole. Eur J Clin Microbiol Infect Dis. doi: 10.1007/s10096-014-2294-5. [DOI] [PubMed] [Google Scholar]
- 27.Wang D, Guo Y, Wrighton SA, Cooke GE, Sadee W. 2011. Intronic polymorphism in CYP3A4 affects hepatic expression and response to statin drugs. Pharmacogenomics J 11:274–286. doi: 10.1038/tpj.2010.28. [DOI] [PMC free article] [PubMed] [Google Scholar]
- 28.De Pauw B, Walsh TJ, Donnelly JP, Stevens DA, Edwards JE, Calandra T, Pappas PG, Maertens J, Lortholary O, Kauffman CA, Denning DW, Patterson TF, Maschmeyer G, Bille J, Dismukes WE, Herbrecht R, Hope WW, Kibbler CC, Kullberg BJ, Marr KA, Muñoz P, Odds FC, Perfect JR, Restrepo A, Ruhnke M, Segal BH, Sobel JD, Sorrell TC, Viscoli C, Wingard JR, Zaoutis T, Bennett JE, European Organization for Research and Treatment of Cancer/Invasive Fungal Infections Cooperative Group, National Institute of Allergy and Infectious Diseases Mycoses Study Group (EORTC/MSG) Consensus Group . 2008. Revised definitions of invasive fungal disease from the European Organization for Research and Treatment of Cancer/Invasive Fungal Infections Cooperative Group and the National Institute of Allergy and Infectious Diseases Mycoses Study Group (EORTC/MSG) Consensus Group. Clin Infect Dis 46:1813–1821. doi: 10.1086/588660. [DOI] [PMC free article] [PubMed] [Google Scholar]
- 29.Jourdil JF, Tonini J, Stanke-Labesque F. 2013. Simultaneous quantitation of azole antifungals, antibiotics, imatinib, and raltegravir in human plasma by two-dimensional high-performance liquid chromatography-tandem mass spectrometry. J Chromatogr B Analyt Technol Biomed Life Sci 919-920:1–9. doi: 10.1016/j.jchromb.2012.12.028. [DOI] [PubMed] [Google Scholar]
- 30.Mega JL, Close SL, Wiviott SD, Shen L, Hockett RD, Brandt JT, Walker JR, Antman EM, Macias W, Braunwald E, Sabatine MS. 2009. Cytochrome P-450 polymorphisms and response to clopidogrel. N Engl J Med 360:354–362. doi: 10.1056/NEJMoa0809171. [DOI] [PubMed] [Google Scholar]
- 31.Goutelle S, Bourguignon L, Bleyzac N, Berry J, Clavel-Grabit F, Tod M. 2013. In vivo quantitative prediction of the effect of gene polymorphisms and drug interactions on drug exposure for CYP2C19 substrates. AAPS J 15:415–426. doi: 10.1208/s12248-012-9431-9. [DOI] [PMC free article] [PubMed] [Google Scholar]
- 32.Moes DJ, Swen JJ, den Hartigh J, van der Straaten T, van der Heide JJ, Sanders JS, Bemelman FJ, de Fijter JW, Guchelaar HJ. 2014. Effect of CYP3A4*22, CYP3A5*3, and CYP3A combined genotypes on cyclosporine, everolimus, and tacrolimus pharmacokinetics in renal transplantation. CPT Pharmacometrics Syst Pharmacol 3:e100. doi: 10.1038/psp.2013.78. [DOI] [PMC free article] [PubMed] [Google Scholar]
- 33.Rostami-Hodjegan A, Tucker GT. 2007. Simulation and prediction of in vivo drug metabolism in human populations from in vitro data. Nat Rev Drug Discov 6:140–148. doi: 10.1038/nrd2173. [DOI] [PubMed] [Google Scholar]
- 34.Rodriguez S, Gaunt TR, Day IN. 2009. Hardy-Weinberg equilibrium testing of biological ascertainment for Mendelian randomization studies. Am J Epidemiol 169:505–514. doi: 10.1093/aje/kwn359. [DOI] [PMC free article] [PubMed] [Google Scholar]
- 35.Kollef M, Micek S, Hampton N, Doherty JA, Kumar A. 2012. Septic shock attributed to Candida infection: importance of empiric therapy and source control. Clin Infect Dis 54:1739–1746. doi: 10.1093/cid/cis305. [DOI] [PubMed] [Google Scholar]
- 36.Morrell M, Fraser VJ, Kollef MH. 2005. Delaying the empiric treatment of Candida bloodstream infection until positive blood culture results are obtained: a potential risk factor for hospital mortality. Antimicrob Agents Chemother 49:3640–3645. doi: 10.1128/AAC.49.9.3640-3645.2005. [DOI] [PMC free article] [PubMed] [Google Scholar]
- 37.Kim SH, Lee DG, Kwon JC, Lee HJ, Cho SY, Park C, Kwon EY, Park SH, Choi SM, Choi JH, Yoo JH. 2013. Clinical impact of cytochrome P450 2C19 genotype on the treatment of invasive aspergillosis under routine therapeutic drug monitoring of voriconazole in a Korean population. Infect Chemother 45:406–414. doi: 10.3947/ic.2013.45.4.406. [DOI] [PMC free article] [PubMed] [Google Scholar]
- 38.Owusu Obeng A, Egelund EF, Alsultan A, Peloquin CA, Johnson JA. 2014. CYP2C19 polymorphisms and therapeutic drug monitoring of voriconazole: are we ready for clinical implementation of pharmacogenomics? Pharmacotherapy 34:703–718. doi: 10.1002/phar.1400. [DOI] [PMC free article] [PubMed] [Google Scholar]
- 39.Neely M, Rushing T, Kovacs A, Jelliffe R, Hoffman J. 2010. Voriconazole pharmacokinetics and pharmacodynamics in children. Clin Infect Dis 50:27–36. doi: 10.1086/648679. [DOI] [PMC free article] [PubMed] [Google Scholar]
- 40.Li XQ, Andersson TB, Ahlström M, Weidolf L. 2004. Comparison of inhibitory effects of the proton pump-inhibiting drugs omeprazole, esomeprazole, lansoprazole, pantoprazole, and rabeprazole on human cytochrome P450 activities. Drug Metab Dispos 32:821–827. doi: 10.1124/dmd.32.8.821. [DOI] [PubMed] [Google Scholar]
- 41.Johnson HJ, Han K, Capitano B, Blisard D, Husain S, Linden PK, Marcos A, Kwak EJ, Potoski B, Paterson DL, Romkes M, Venkataramanan R. 2010. Voriconazole pharmacokinetics in liver transplant recipients. Antimicrob Agents Chemother 54:852–859. doi: 10.1128/AAC.00429-09. [DOI] [PMC free article] [PubMed] [Google Scholar]
- 42.Chu HY, Jain R, Xie H, Pottinger P, Fredricks DN. 2013. Voriconazole therapeutic drug monitoring: retrospective cohort study of the relationship to clinical outcomes and adverse events. BMC Infect Dis 13:105. doi: 10.1186/1471-2334-13-105. [DOI] [PMC free article] [PubMed] [Google Scholar]
Associated Data
This section collects any data citations, data availability statements, or supplementary materials included in this article.