Abstract
Successful drug and gene delivery across cellular membranes can lead to improved therapeutic outcomes. Recent studies have suggested that sonoporation may enhance drug and gene delivery across cellular membranes. The enhancement may be due to transient permeation of the membrane from cavitation or microstreaming effects of microbubbles exposed to ultrasound. Given limited acoustic pressure calibration and beam profile characterization of the Sonitron ultrasound systems in cellular bioeffects studies previously published, the objective of this work was to calibrate the acoustic output and explore the potential for standing waves in a cell-well plate. In this study three 1-MHz transducers driven by Sonitron ultrasound systems, which have been used in a number of sonoporation studies, were calibrated. Transducers with 10-mm, 6-mm and 20-mm diameter apertures (Sonitron 1000 and 2000, Rich-Mar, Inola, OK) were calibrated using PVDF needle hydrophones. Axial and transverse beam profiles were obtained, and the pressures were measured as a function of Sonitron intensity dial setting and duty cycle. The acoustic intensity was calculated and compared to the Sonitron intensity dial setting for duty cycles from 10 to 100%. Standing waves caused by reflections from the hydrophone holder were detected for each transducer. This observation may also have implications for in vitro sonoporation studies. Acoustic field characterization is an important first step in understanding the mechanisms of sonoporation and drug delivery across biomembranes.
Keywords: Sonoporation, Drug and Gene delivery, Transducer Calibration
INTRODUCTION
The effectiveness of many therapeutic agents depends on successful delivery across cellular membranes. Treatment of conditions such as thrombosis, atherosclerosis, or cancer may be improved by increased delivery of drugs or genes across cellular membranes (Frenkel, 2008; Huang, 2008; Hynynen, 2008; Mayer and Bekeredjian, 2008; Sboros, 2008). Sonoporation has been investigated as a non-invasive means of delivering therapeutics to cells (Tachibana, 2004; Zhou, et al., 2009). Studies have suggested that microbubbles exposed to ultrasound may nucleate cavitation and promote concomitant microstreaming, which can transiently permeate nearby cellular membranes with acceptable rates of cell viability (Mehier-Humbert, et al., 2005; Prentice, et al., 2005; van Wamel, et al., 2006). Increased drug and gene delivery to cells increases the potential for improvement of therapeutic outcomes.
Several ultrasound parameters can affect the efficacy of sonoporation and drug delivery studies in vitro. These parameters include frequency, duty cycle, exposure time, beamwidth of the ultrasound field, and in situ pressure or intensity (Sboros, 2008). The Sonitron 1000 and Sonitron 2000 ultrasound systems have been used in a number of sonoporation and drug delivery studies (Buchanan, et al., 2009; Huang and MacDonald, 2004; Lee, et al., 2005; Mehier-Humbert and Guy, 2005; Mizuno, et al., 2005; Shimamura, et al., 2005; Sonoda, et al., 2006; Tiukinhoy-Laing, et al., 2007a; Tiukinhoy-Laing, et al., 2007b; Tomizawa, et al., 2001; Tsunoda, et al., 2005; Yamashita, et al., 2009; Yamashita, et al., 2007). However, in most of these studies, careful calibrations of the transducer output were not reported. Calibrations can be costly and tedious but are necessary to report the ultrasound parameters used in the study. The aim of this investigation was to demonstrate calibrations of the Sonitron 1000 and Sonitron 2000 ultrasound systems. The implications of the results will be discussed.
MATERIALS AND METHODS
The Sonitron 1000 and Sonitron 2000 ultrasound systems (Rich-Mar Corp, Inola, OK) were calibrated using 0.2 mm- and 0.5 mm-diameter polyvinylidene fluoride (PVDF) needle hydrophones (Precision Acoustics, Dorchester, England). Both hydrophones have an uncertainty of +/− 14% at 1 MHz according to the manufacturer specifications. Three 1-MHz transducers with aperture diameters of 10 mm (Sonitron 1000), 6 mm (Sonitron 2000), and 20 mm (Sonitron 2000) were each calibrated once. The settings used for the calibrations, shown in Table 1, were selected to replicate settings from the published studies previously mentioned. Calibration measurements were performed in a water-filled acrylic tank at room temperature (21.5 ± 1.5 °C). The Sonitron transducer was submerged using a rigidly supported positioner. The PVDF needle hydrophone was mounted on a motorized three-axis translation system (Velmex NF90 Series, Velmex Inc, Bloomfield, NY) and aligned with the transducer. The hydrophone was inserted through a 2.0 cm × 3.5 cm slab of acoustic absorber material (Precision Acoustics, Dorchester, England) in order to minimize standing wave interference from the positioner surface. Hydrophone measurements were digitized using a digital oscilloscope that was triggered by the hydrophone signal (LT584 WaveRunner-2, LeCroy Corp, Chestnut Ridge, NY) and transferred to a desktop computer (Power Mac G5, Apple, Cupertino, CA). All calibration measurements were automated and controlled with a collection of visual interface programs written in LabVIEW (National Instruments, Austin, TX) on the desktop computer. The beam profiles were characterized and plotted in the axial and transverse planes using MATLAB (Mathworks Inc, Natick, MA). The spatial-average temporal-average intensity (ISATA) was calculated using the methods described by Harris (1985). Pressure measurements were acquired in free field for all three transducers. In addition, the 10-mm transducer (Sonitron 1000) was placed at the entrance of a single 20-mm deep well within a polystyrene 24-well plate (Corning Inc., Corning, NY) immersed in water. The pressure amplitude was measured using a 0.2-mm PVDF needle hydrophone (Precision Acoustics, Dorchester, England) inserted through a hole drilled into the bottom of the cell well and placed 10 mm from the Sonitron transducer face.
Table 1.
Sonitron settings for calibration of 10-mm transducer (Sonitron 1000) and 6- and 20-mm transducers (Sonitron 2000).
| Transducer Aperture (mm) | Frequency (MHz) | Duty Cycle (%) | Intensity Dial Settings (W/cm2) |
|---|---|---|---|
| 10 | 1 | 10, 50, 100 | 0.1–2.0 |
| 6 | 1 | 100 | 0.2–10.0 |
| 20 | 1 | 100 | 0.2–4.0 |
RESULTS
Representative axial and transverse ultrasound beam profiles for the 10-mm (Sonitron 1000), 6-mm (Sonitron 2000), and 20-mm (Sonitron 2000) 1.0-MHz transducers are shown in Figures 1, 2, and 3 respectively. These beam profiles were acquired with a Sonitron intensity dial setting of either 1.0 or 2.0 W/cm2 and a duty cycle of 100%. The measured -3 dB beamwidths and focal depths of each transducer are listed in Table 2.
Figure 1.
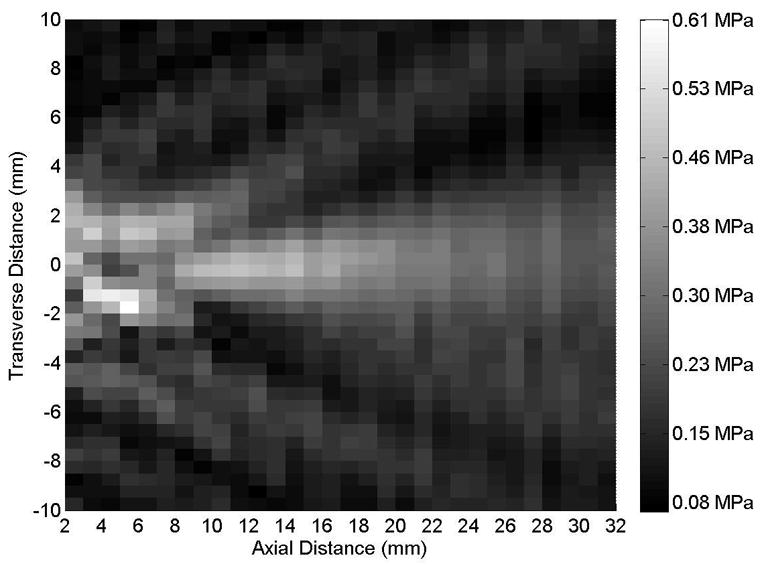
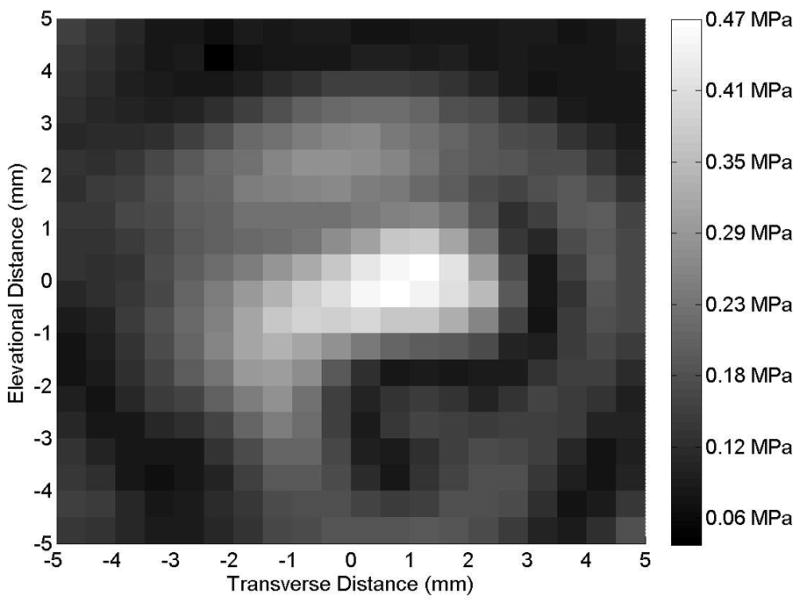
(A) Axial and (B) transverse beam profiles for 10-mm transducer (Sonitron 1000 ultrasound system), calibrated with a PVDF needle hydrophone. Transverse profile measured at an axial distance of 10 mm from the transducer. Sonitron intensity dial setting of 2.0 W/cm2 and duty cycle of 100%.
Figure 2.
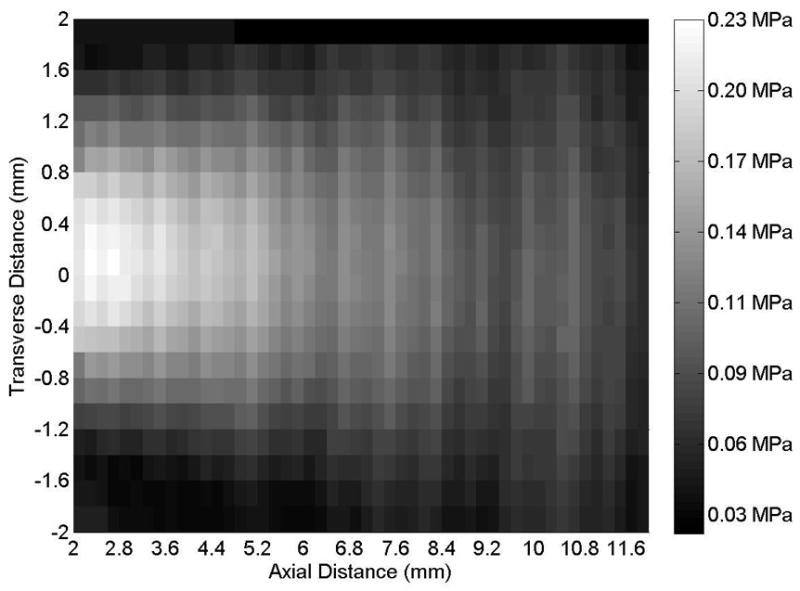
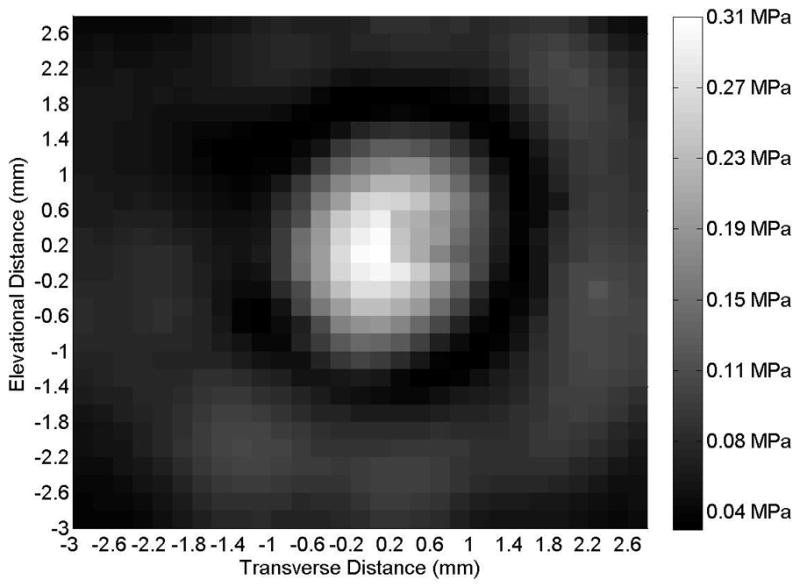
(A) Axial and (B) transverse beam profiles for 6-mm transducer (Sonitron 1000 ultrasound system), calibrated with a PVDF needle hydrophone. Sonitron intensity dial setting of 1.0 W/cm2 and duty cycle of 100%. Transverse profile measured at an axial distance of 2 mm from the transducer.
Figure 3.
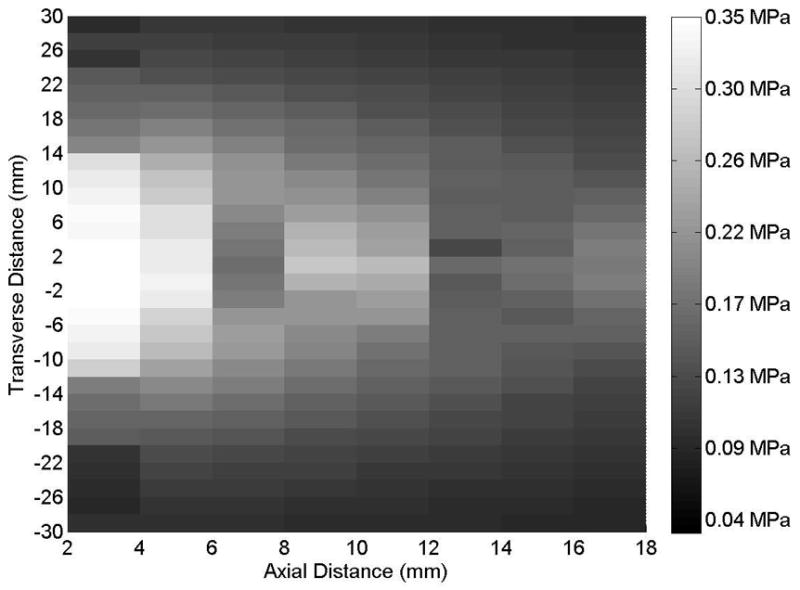
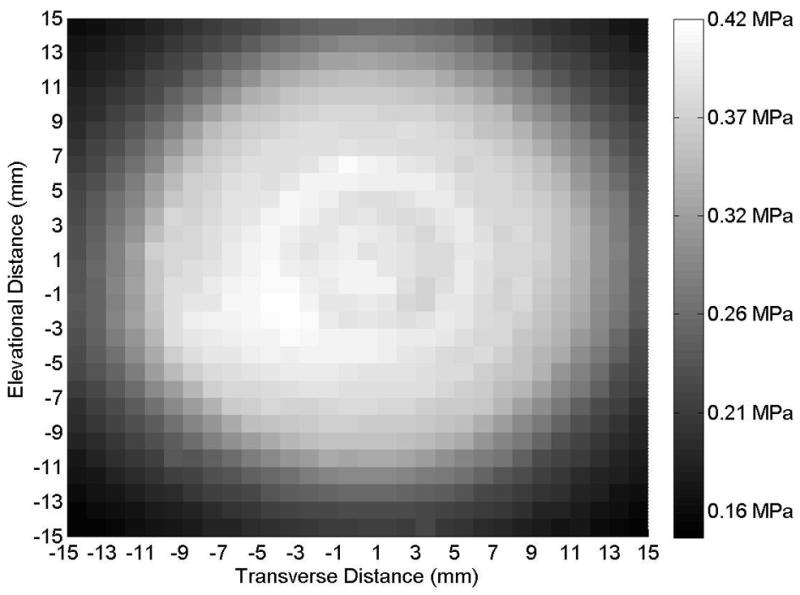
(A) Axial and (B) transverse beam profiles for 20-mm transducer (Sonitron 1000 ultrasound system), calibrated with a PVDF needle hydrophone. Transverse profile measured at an axial distance of 2 mm from the transducer. Sonitron intensity dial setting of 1.0 W/cm2 and duty cycle of 100%.
Table 2.
Measured focal depths and -3 dB beamwidths of 10-mm transducer (Sonitron 1000) and 6- and 20-mm transducers (Sonitron 2000).
| Transducer Aperture (mm) | Focal Depth (cm) | Transverse Beamwidth (cm) | Axial Beamwidth (cm) |
|---|---|---|---|
| 10 | 1.0 | 0.3 | 0.1 |
| 6 | 0.2 | 0.1 | 0.4 |
| 20 | 0.2 | 2.4 | 0.8 |
The measured free-field acoustic pressure at the focus is plotted as a function of Sonitron intensity dial setting for the 10-mm (Sonitron 1000), 6-mm (Sonitron 2000), and 20-mm (Sonitron 2000), 1.0-MHz transducers in Figures 4, 5, and 6, respectively, with a duty cycle of 100%. Also shown in each figure is a second-order polynomial least squares fit to the data (R2 > 0.98 for each transducer). In Figure 7 the measured acoustic pressure at the focus is plotted as a function of duty cycle at four different intensity dial settings for the 10-mm transducer driven by the Sonitron 1000 system. The pressure is approximately the same for each duty cycle setting. In addition, the pressure measured inside a polystyrene cell well with the 10-mm transducer (Sonitron 1000) is plotted in Figure 8.
Figure 4.
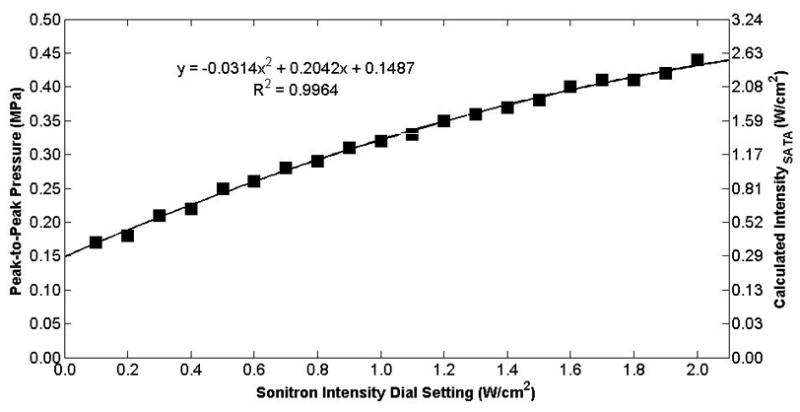
Peak-to-peak acoustic pressure and calculated intensity (ISATA) measured at the hydrophone as a function of the Sonitron intensity dial setting for the 10-mm transducer (Sonitron 1000) at a 100% duty cycle. The hydrophone was positioned at the focus (10 mm from the transducer).
Figure 5.
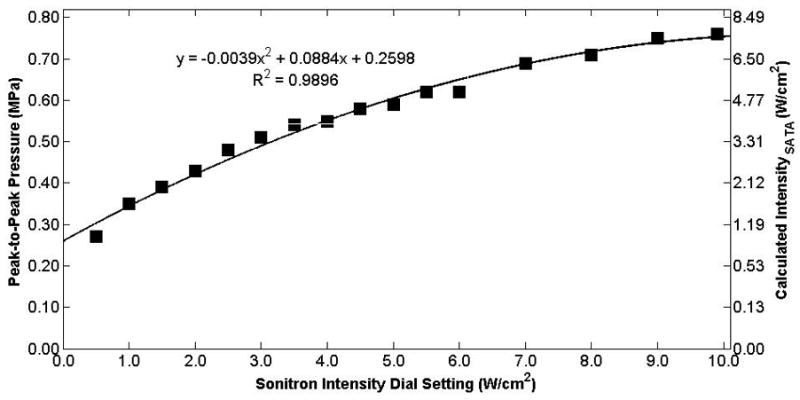
Peak-to-peak acoustic pressure and calculated intensity (ISATA) measured at the hydrophone as a function of the Sonitron intensity dial setting for the 6-mm transducer (Sonitron 2000) at a 100% duty cycle. The hydrophone was positioned at the focus (2 mm from the transducer).
Figure 6.
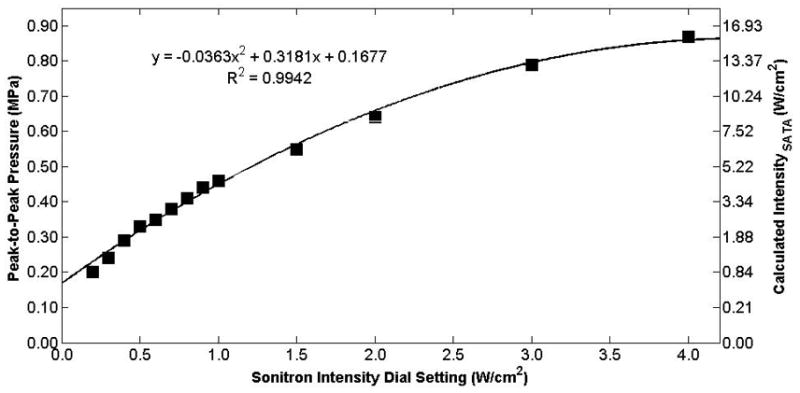
Peak-to-peak acoustic pressure and calculated intensity (ISATA) measured at the hydrophone as a function of the Sonitron intensity dial setting for the 20-mm transducer (Sonitron 2000) at a 100% duty cycle. The hydrophone was positioned at the focus (2 mm from the transducer).
Figure 7.
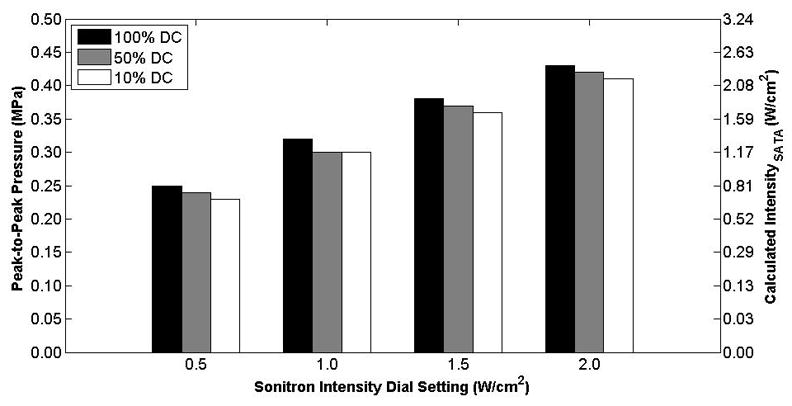
Peak-to-peak acoustic pressure measured at the hydrophone as a function of the duty cycle for the 10-mm transducer (Sonitron 1000) with Sonitron intensity dial settings between 0.5–2.0 W/cm2. The hydrophone was positioned at the focus (10 mm from the transducer).
Figure 8.
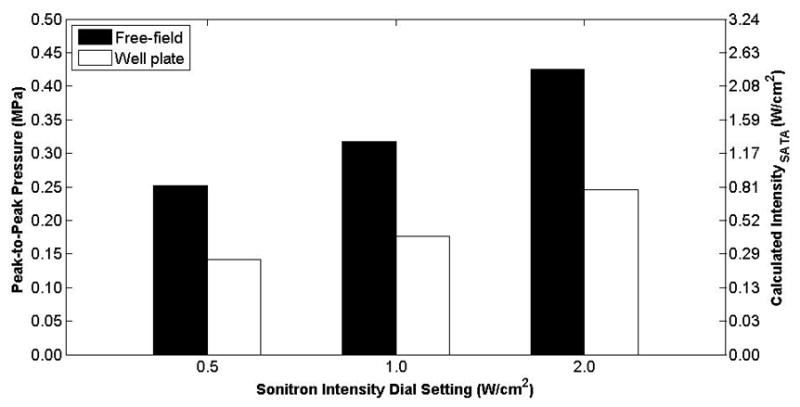
Peak-to-peak pressure measured inside a polystyrene cell well at Sonitron intensity dial settings of 0.5, 1.0, and 2.0 W/cm2 and a 100% duty cycle using the 10-mm 1.0-MHz transducer (Sonitron 1000) placed 10 mm from the hydrophone.
DISCUSSION
Most published sonoporation and drug delivery studies utilizing the Sonitron system have not described calibrations of the transducer output or characterization of the ultrasound beam profile. The purpose of this study was to calibrate the transducer output and appreciate the effects of a cell-well plate for subsequent bioeffects or cellular experiments. Surprizingly, the Sonitron 2000 has no output at a Sonitron intensity dial setting of 10.0 W/cm2, thus the setting of 9.9 W/cm2 is the maximum usable intensity dial setting. At other settings, however, the measured acoustic pressure as a function of the Sonitron intensity dial setting exhibits a second-order polynomial trend, as expected.
Standing wave interference was observed during the calibrations, most notably for the 20-mm transducer (Sonitron 2000). Acoustic absorber material was used to reduce the standing wave interference during the calibrations. It is important to note that when the Sonitron transducers are placed in cell wells, standing waves may occur. Constructive and destructive interference can cause the pressure to vary significantly over the distance of one wavelength (1.5 mm at 1 MHz). It is proposed that constructive interference accounts for the difference between the measured pressures in the free-field and in a cell well, see Figure 8. Figure 9 shows a standing wave interference pattern that was observed with no acoustic absorber material on the hydrophone holder (20-mm transducer, Sonitron 2000, 100% duty cycle). It is noted that the local pressure maxima and minima occur at intervals of the wavelength (1.5 mm at 1 MHz). This presents problems when trying to translate in vitro sonoporation results to in vivo experiments where standing waves are less likely to occur, as has been discussed previously (Kinoshita and Hynynen, 2007). This difference underlies the importance of both accurate calibration of the transducer and characterization of the acoustic field and output. Transducer calibration can improve interpretation of in vitro sonoporation and drug delivery results and translation to applications in vivo.
Figure 9.
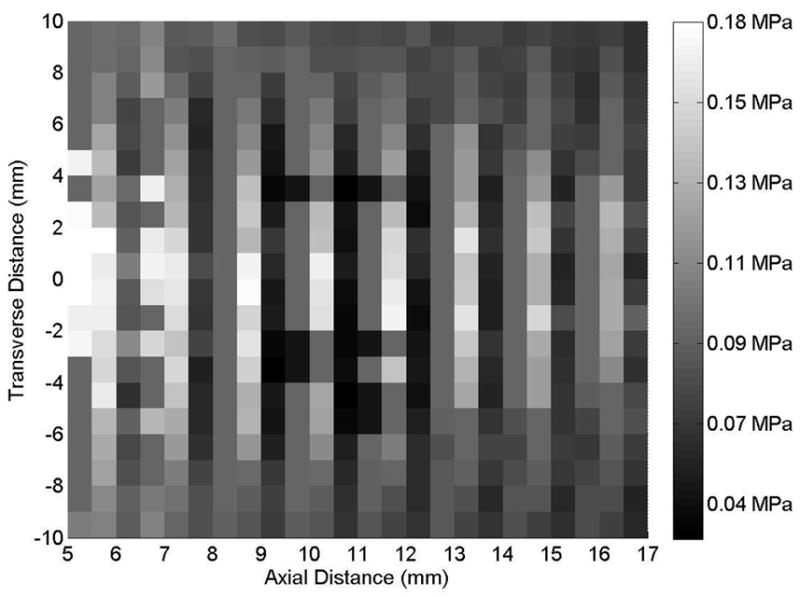
Axial beam profile of the 20-mm transducer (Sonitron 2000), with acoustic absorber material removed to observe a standing wave at a Sonitron intensity dial setting of 2.0 W/cm2 and a 100% duty cycle.
Acknowledgments
This work was funded from the National Institute of Health grants HL74002 and HL59586.
Footnotes
Publisher's Disclaimer: This is a PDF file of an unedited manuscript that has been accepted for publication. As a service to our customers we are providing this early version of the manuscript. The manuscript will undergo copyediting, typesetting, and review of the resulting proof before it is published in its final citable form. Please note that during the production process errors may be discovered which could affect the content, and all legal disclaimers that apply to the journal pertain.
References
- Buchanan KD, Huang SL, Kim H, McPherson DD, Macdonald RC. Encapsulation of NF-kappaB decoy oligonucleotides within echogenic liposomes and ultrasound-triggered release. J Control Release. 2009 doi: 10.1016/j.jconrel.2009.09.017. [DOI] [PMC free article] [PubMed] [Google Scholar]
- Frenkel V. Ultrasound mediated delivery of drugs and genes to solid tumors. Adv Drug Deliv Rev. 2008;60(10):1193–208. doi: 10.1016/j.addr.2008.03.007. [DOI] [PMC free article] [PubMed] [Google Scholar]
- Harris GR. A discussion of procedures for ultrasonic intensity and power calculations from miniature hydrophone measurements. Ultrasound Med Biol. 1985;11(6):803–17. doi: 10.1016/0301-5629(85)90074-2. [DOI] [PubMed] [Google Scholar]
- Huang SL. Liposomes in ultrasonic drug and gene delivery. Adv Drug Deliv Rev. 2008;60(10):1167–76. doi: 10.1016/j.addr.2008.03.003. [DOI] [PubMed] [Google Scholar]
- Huang SL, MacDonald RC. Acoustically active liposomes for drug encapsulation and ultrasound-triggered release. Biochim Biophys Acta. 2004;1665(1–2):134–41. doi: 10.1016/j.bbamem.2004.07.003. [DOI] [PubMed] [Google Scholar]
- Hynynen K. Ultrasound for drug and gene delivery to the brain. Adv Drug Deliv Rev. 2008;60(10):1209–17. doi: 10.1016/j.addr.2008.03.010. [DOI] [PMC free article] [PubMed] [Google Scholar]
- Kinoshita M, Hynynen K. Key factors that affect sonoporation efficiency in in vitro settings: the importance of standing wave in sonoporation. Biochem Biophys Res Commun. 2007;359(4):860–5. doi: 10.1016/j.bbrc.2007.05.153. [DOI] [PMC free article] [PubMed] [Google Scholar]
- Lee JM, Takahashi M, Mon H, Koga K, Kawaguchi Y, Kusakabe T. Efficient gene transfer into silkworm larval tissues by a combination of sonoporation and lipofection. Cell Biol Int. 2005;29(11):976–9. doi: 10.1016/j.cellbi.2005.07.007. [DOI] [PubMed] [Google Scholar]
- Mayer CR, Bekeredjian R. Ultrasonic gene and drug delivery to the cardiovascular system. Adv Drug Deliv Rev. 2008;60(10):1177–92. doi: 10.1016/j.addr.2008.03.004. [DOI] [PubMed] [Google Scholar]
- Mehier-Humbert S, Bettinger T, Yan F, Guy RH. Plasma membrane poration induced by ultrasound exposure: implication for drug delivery. J Control Release. 2005;104(1):213–22. doi: 10.1016/j.jconrel.2005.01.007. [DOI] [PubMed] [Google Scholar]
- Mehier-Humbert S, Guy RH. Physical methods for gene transfer: improving the kinetics of gene delivery into cells. Adv Drug Deliv Rev. 2005;57(5):733–53. doi: 10.1016/j.addr.2004.12.007. [DOI] [PubMed] [Google Scholar]
- Mizuno Y, Iwata H, Takagi H, Yoshikawa S, Umeda Y, Matsuno Y, Mori Y, Takemura H. Sonoporation with doxorubicin enhances suppression of intimal hyperplasia in a vein graft model. J Surg Res. 2005;124(2):312–7. doi: 10.1016/j.jss.2004.11.001. [DOI] [PubMed] [Google Scholar]
- Prentice P, Cuschieri A, Dholakia K, Prausnitz M, Campbell P. Membrane disruption by optically controlled microbubble cavitation. Nature Physics. 2005;1:107–110. [Google Scholar]
- Sboros V. Response of contrast agents to ultrasound. Adv Drug Deliv Rev. 2008;60(10):1117–36. doi: 10.1016/j.addr.2008.03.011. [DOI] [PubMed] [Google Scholar]
- Shimamura M, Sato N, Taniyama Y, Kurinami H, Tanaka H, Takami T, Ogihara T, Tohyama M, Kaneda Y, Morishita R. Gene transfer into adult rat spinal cord using naked plasmid DNA and ultrasound microbubbles. J Gene Med. 2005;7(11):1468–74. doi: 10.1002/jgm.793. [DOI] [PubMed] [Google Scholar]
- Sonoda S, Tachibana K, Uchino E, Okubo A, Yamamoto M, Sakoda K, Hisatomi T, Sonoda KH, Negishi Y, Izumi Y, Takao S, Sakamoto T. Gene transfer to corneal epithelium and keratocytes mediated by ultrasound with microbubbles. Invest Ophthalmol Vis Sci. 2006;47(2):558–64. doi: 10.1167/iovs.05-0889. [DOI] [PubMed] [Google Scholar]
- Tachibana K. Emerging technologies in therapeutic ultrasound: thermal ablation to gene delivery. Hum Cell. 2004;17(1):7–15. doi: 10.1111/j.1749-0774.2004.tb00015.x. [DOI] [PubMed] [Google Scholar]
- Tiukinhoy-Laing SD, Buchanan K, Parikh D, Huang S, MacDonald RC, McPherson DD, Klegerman ME. Fibrin targeting of tissue plasminogen activator-loaded echogenic liposomes. J Drug Target. 2007a;15(2):109–14. doi: 10.1080/10611860601140673. [DOI] [PubMed] [Google Scholar]
- Tiukinhoy-Laing SD, Huang S, Klegerman M, Holland CK, McPherson DD. Ultrasound-facilitated thrombolysis using tissue-plasminogen activator-loaded echogenic liposomes. Thromb Res. 2007b;119(6):777–84. doi: 10.1016/j.thromres.2006.06.009. [DOI] [PMC free article] [PubMed] [Google Scholar]
- Tomizawa M, Ebara M, Saisho H, Sakiyama S, Tagawa M. Irradiation with ultrasound of low output intensity increased chemosensitivity of subcutaneous solid tumors to an anti-cancer agent. Cancer Lett. 2001;173(1):31–5. doi: 10.1016/s0304-3835(01)00687-5. [DOI] [PubMed] [Google Scholar]
- Tsunoda S, Mazda O, Oda Y, Iida Y, Akabame S, Kishida T, Shin-Ya M, Asada H, Gojo S, Imanishi J, Matsubara H, Yoshikawa T. Sonoporation using microbubble BR14 promotes pDNA/siRNA transduction to murine heart. Biochem Biophys Res Commun. 2005;336(1):118–27. doi: 10.1016/j.bbrc.2005.08.052. [DOI] [PubMed] [Google Scholar]
- van Wamel A, Kooiman K, Harteveld M, Emmer M, ten Cate FJ, Versluis M, de Jong N. Vibrating microbubbles poking individual cells: drug transfer into cells via sonoporation. J Control Release. 2006;112(2):149–55. doi: 10.1016/j.jconrel.2006.02.007. [DOI] [PubMed] [Google Scholar]
- Yamashita T, Ohtsuka H, Arimura N, Sonoda S, Kato C, Ushimaru K, Hara N, Tachibana K, Sakamoto T. Sonothrombolysis for intraocular fibrin formation in an animal model. Ultrasound Med Biol. 2009;35(11):1845–53. doi: 10.1016/j.ultrasmedbio.2009.05.023. [DOI] [PubMed] [Google Scholar]
- Yamashita T, Sonoda S, Suzuki R, Arimura N, Tachibana K, Maruyama K, Sakamoto T. A novel bubble liposome and ultrasound-mediated gene transfer to ocular surface: RC-1 cells in vitro and conjunctiva in vivo. Exp Eye Res. 2007;85(6):741–8. doi: 10.1016/j.exer.2007.08.006. [DOI] [PubMed] [Google Scholar]
- Zhou Y, Kumon RE, Cui J, Deng CX. The Size of Sonoporation Pores on the Cell Membrane. Ultrasound Med Biol. 2009 doi: 10.1016/j.ultrasmedbio.2009.05.012. [DOI] [PMC free article] [PubMed] [Google Scholar]


