Abstract
MicroRNAs (miRNAs) are a class of small RNA molecules that are implicated in post-transcriptional regulation of gene expression during development. The discovery and understanding of miRNAs has revolutionized the traditional view of gene expression. Alport syndrome (AS) is an inherited disorder of type IV collagen, which most commonly leads to glomerulonephritis and kidney failure. Patients with AS inevitably reach end-stage renal disease and require renal replacement therapy, starting in young adulthood. In this study, Solexa sequencing was used to identify and quantitatively profile small RNAs from an AS family. We identified 30 known miRNAs that showed a significant change in expression between two individuals. Nineteen miRNAs were up-regulated and eleven were down-regulated. Forty-nine novel miRNAs showed significantly different levels of expression between two individuals. Gene target predictions for the miRNAs revealed that high ranking target genes were implicated in cell, cell part and cellular process categories. The purine metabolism pathway and mitogen-activated protein kinase (MAPK) signaling pathway were enriched by the largest number of target genes. These results strengthen the notion that miRNAs and their target genes are involved in AS and the data advance our understanding of miRNA function in the pathogenesis of AS.
Keywords: Alport syndrome, miRNA, Gene Ontology, Kyoto Encyclopedia of Genes and Genomes (KEGG) pathway, Induced pluripotent stem cells (iPSCs), Solexa sequencing
1. Introduction
Alport syndrome (AS) is a progressive, hereditary disease that affects the kidney and is characterized by hematuria, sensorineural loss, and ocular lesions, with structural defects in the glomerular basement membrane (GBM) (Tryggvason et al., 1993; Gehrs et al., 1995). The prevalence of the disease is estimated at approximately 1 in 5000. In total, 85% of patients have the X-linked form and affected males develop renal failure by the age of 20 years (Colville and Savige, 1997; Hertz, 2009). Patients with AS commonly require renal replacement in the second or third decade of life (Temme et al., 2012).
The syndrome is genetically heterogeneous and arises from mutations in genes that encode basement type IV collagen (Kashtan, 1999). The COL4A5 gene is located on chromosome Xq22 and has been shown to give six genetically distinct chains of type IV collagen. It is responsible for X-linked AS. In contrast, the COL4A3 and COL4A4 genes are located “head to head” on chromosome 2 and are involved in the rarer autosomal forms of the disease (Gubler et al., 2007).
The diagnosis of AS relies on patient history, physical examination, detailed family history, urinalyses, immunohistochemical analysis of basement membrane type IV collagen expression, and examination of renal biopsy specimens by electron microscopy (Kashtan, 1993; Pohl et al., 2013). Since AS leads to end-stage renal disease, the need for early diagnosis and treatment is becoming more and more important (Gross et al., 2003; 2012). The biomarker combinations in the urine (Pohl et al., 2013) and ocular features (Zhang et al., 2008) are sensitive and specific for the diagnosis of AS, but early diagnosis remains difficult. Both the X-linked and autosomal types of AS are considered to be genetic diseases of the GBM, which involves the collagen type IV network (Thorner, 2007).
In this study, we sequenced and characterized the microRNA (miRNA) expression profiles from an AS family using high-throughput Illumina sequencing technology. We detected differentially expressed miRNAs and analyzed their target genes. The target genes were subjected to Gene Ontology (GO) annotation and Kyoto Encyclopedia of Genes and Genomes (KEGG) pathway analysis. The research revealed a large difference in molecular markers between the AS and normal control (NC) individuals. These data can be used to gain an insight into the pathogenesis of AS and could provide a potential diagnostic biomarker for early stage AS.
2. Materials and methods
2.1. Clinical sample collection
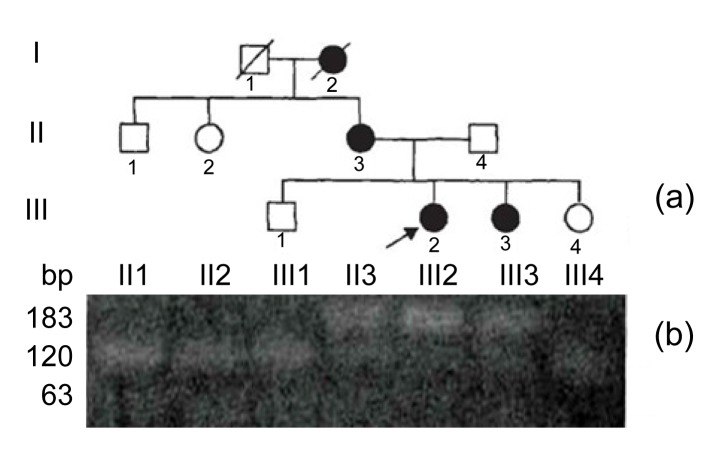
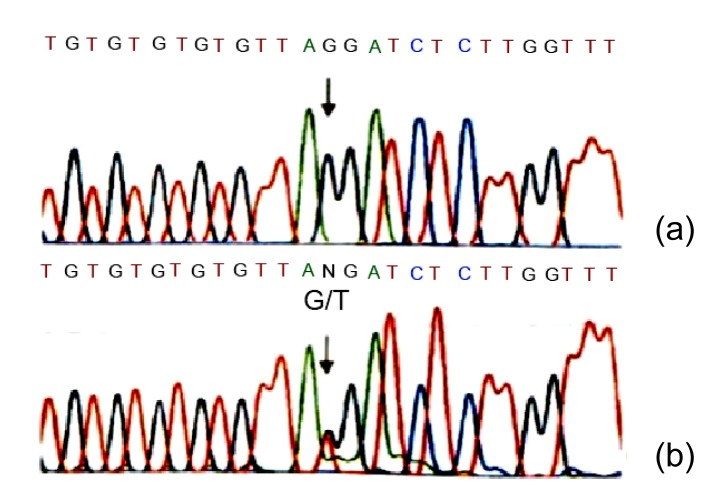
We have clinically identified AS family in three genograms (Fig. 1). The propositus (III2) who is female and 26 years old was clinically observed with gross hematuria and albuminuria. She was diagnosed with AS in the Second Clinical Medical College of Jinan University (Shenzhen, China) in 2013. The propositus’s grandmother (I2) was also diagnosed with AS and passed away from kidney failure. The propositus’s mother (II3) had AS symptoms, including kidney failure, gross hematuria, albuminuria, sensorineural hearing loss, and pathognomonic ocular lesions. The propositus’s sister (III3) was also clinically observed with mild gross hematuria and albuminuria. The AS family has four AS patients and six healthy people (Table 1). There was no genetic transfer from male to male and the observed as X-linked. Eight members from the AS family participated in our molecular research. In our previous research, in order to confirm the diagnosis of AS and find the COL4A5 gene mutation, DNA sequence analysis of the entire coding region and exon-intron boundaries of the COL4A5 gene was performed. This sequence included 51 exons and the junction parts of exons and introns. The result turned out to be base alteration from G to T on the acceptor splicing site of the 22nd intron (c. 1517-I G>T acceptor splicing site mutation, GenBank ID: NM-033380). Base G closed mutation was also the first base of the 23rd intron on COL4A5 (Fig. 2). We also used restriction fragment length polymorphism (RFLP) to confirm c. 1517-I G>T acceptor splicing site mutation on COL4A5. We found that all the healthy people contain only 120 and 63 bp straps. However, the propositus (III2) and her mother (II3) and sister (III3) contained exceptional 183 bp strap (Fig. 1).
Fig. 1.
X-linked Alport system pedigree chart and the result of restriction fragment length polymorphism
(a) X-linked Alport syndrome pedigree chart; (b) Healthy subjects showed only 120 and 63 bp bands, whereas AS patients showed the additional 183 bp band. Boxes and circles stand for male and female, respectively. Darks and blanks stand for the members who are ill and health, respectively. Arrow points to propositus. Diagonal in box or circle stands for the member has passed away
Table 1.
Alport system family existing member blood routine examination, blood biochemistry, and general situation
| Patient | Gender | Age (year) | BLO | PRO | Urea nitrogen (mmol/L) | Inosine (μmol/L) | TP (g/L) | ALB (g/L) | CHOL (mmol/L) | Hearing loss | Vision loss (L/R) |
| III2 | Female | 26 | ++ | + | 6.6 | 121 | 57 | 35 | 5.76 | + | 0.2/1.0 |
| III3 | Female | 23 | + | + | 3.9 | 110 | 71 | 45 | 4.45 | + | 0.4/1.0 |
| II3 | Female | 51 | ++ | ++ | 3.5 | 231 | 70 | 43 | 4.68 | + | 0.2/0.8 |
| II1 | Male | 54 | – | – | 3.1 | 46 | 80 | 47 | 3.19 | – | 1.5/1.5 |
| II2 | Female | 58 | – | + | 3.5 | 53 | 86 | 48 | 4.02 | – | 1.0/1.0 |
| II4 | Male | 53 | – | – | 3.0 | 55 | 75 | 52 | 3.81 | – | 1.0/1.0 |
| III1 | Male | 21 | – | – | 3.2 | 56 | 66 | 45 | 4.61 | – | 1.5/1.0 |
| III4 | Female | 17 | – | – | 3.2 | 50 | 75 | 43 | 4.98 | – | 1.2/1.1 |
BLO: occult blood; PRO: urinary protein; TP: total protein; ALB: albumin; CHOL: cholesterol; L/R: left/right
Fig. 2.
Identification of c. 1517-I GT acceptor splicing site mutation on gene C0L4A5
(a) The sequence of healthy subject; (b) The mutation site, c. 1517-I G>T in C0L4A5 gene (arrow), base alteration from G to T on the acceptor splicing site of the 22nd intron. Base G closed mutation was also found at the 1st base of the 23rd intron in COL4A5
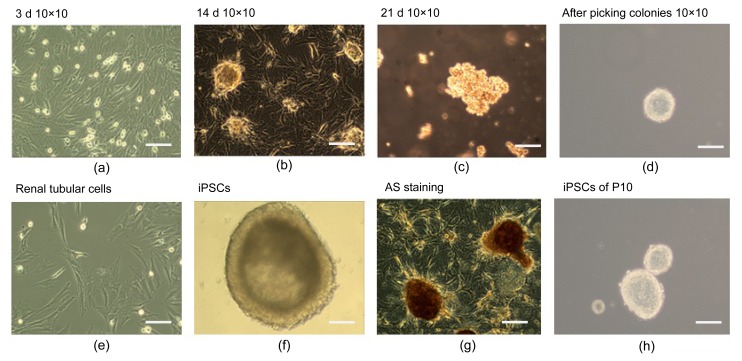
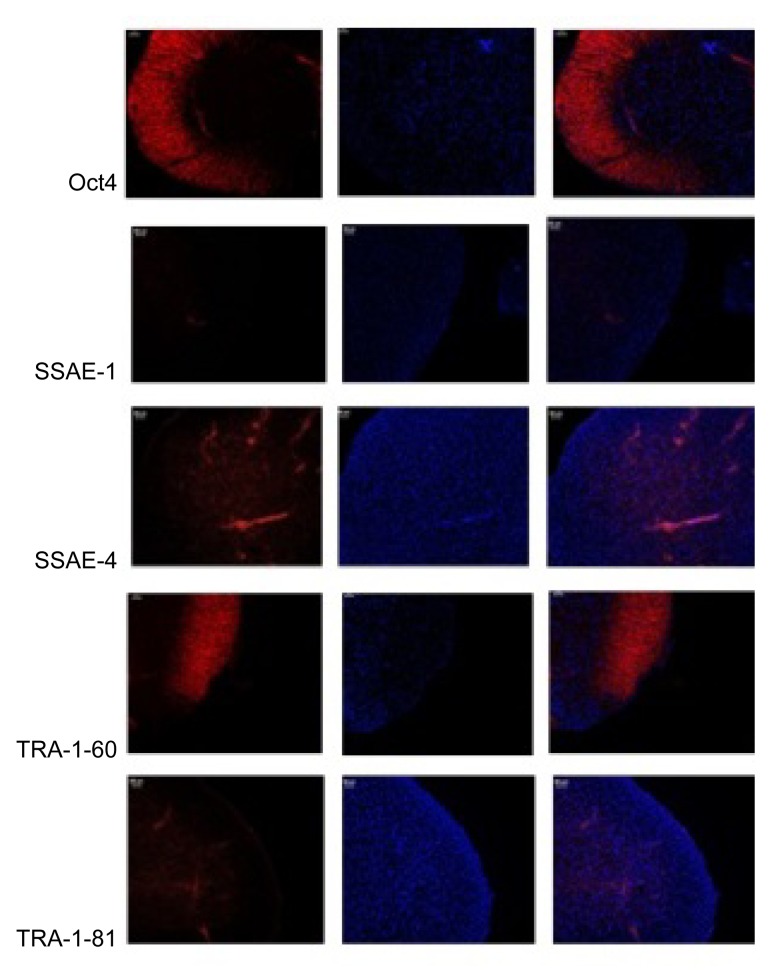
After the AS family analysis, we selected 6 members (3 AS patients and 3 healthy people) from the AS family for further research. Propositus (III2), her mother (II3), and her sister (III3) acted as the experimental group (AS). Her sister (III4), her brother (III1), and her father (II4) acted as the NC. Aseptic middle stream of the micturition was collected in the morning from each participant and was bottled into glass vials, which had been freeze-dried, c-irradiated, and filled with 5 ml penicillin-streptomycin antibiotics in temperature. Then, we separated out the renal tubular cells from the urine. The renal tubular cells were reprogrammed to generate human induced pluripotent stem cells (iPSCs) (Fig. 3). Immunocytochemistry confirmed that iPSCs expressed several human embryonic stem cell (hESC)-specific marker proteins (Oct4, SSAE-4, TRA-1-60, and TRA-1-81). However, the iPSCs were negative for SSAE-1 expression (Fig. 4). The key procedure was completed at the South China Institute for Stem Cell Biology and Regeneration Medicine, Chinese Academy of Sciences (business category). The iPSCs generation method followed that of Chen Y. et al. (2013) for the generation of systemic lupus erythematosus-specific iPSCs from urine. The iPSCs were our ultimate specimen that was used for the research.
Fig. 3.
Schematic diagram of renal tubular cells reprogramming procedure
(a‒d) Step-wise process of reprogramming renal tubular cells; (e) Renal tubular cells; (f) iPSCs; (g) iPSCs with AS staining; (h) iPSCs clones of 10 generations. Bars are 50 μm
Fig. 4.
Immunohistochemical analysis of iPSCs
2.2. Small RNA library
Total RNA was extracted from the iPSCs using Trizol (Invitrogen, USA), in accordance with the manufacturer’s instructions. The RNA quantity and quality were confirmed using a bioanalyzer (Agilent 2100; Agilent, Santa Clara, CA, USA). All RNA was pooled in each same sample group respectively, with equal amounts of RNA from each group. The small RNA library was constructed as described by Hafner et al. (2008). In brief, poly(A) RNA was extracted from 200 μl of total RNA using the Oligotex Kit (Qiagen). A 5' RNA adapter, which contained an Mmel recognition site, was ligated to the 5'-phosphate of the poly(A) RNA using T4 RNA ligase (Ambion). The ligated products were repurified using the Oligotex Kit. Five polymerase chain reaction (PCR) cycles were then performed to amplify the reverse transcription products. The PCR products were digested with Mmel and ligated to a 3' double DNA adapter. The ligation products were amplified by 20 PCR cycles and the gel-synthesis method (HiSeq 2000, Illumina), which is a parallel sequencing technology (BGI, Shenzhen, China).
2.3. Bioinformatic analysis of sequencing data
The sequence tags from the HiSeq sequencing were cleaned to eliminate the low quality reads and several types of contaminants (Table 2). The length distributions of the clean reads are summarized in Fig. 5. The peak of the distribution was used to analyze the composition of the small RNA. Over all, the aim was to align small RNA to the miRNA precursor of corresponding species in the miRBase database to obtain the miRNA count. It must meet two conditions: (1) alignment of the tags to the miRNA precursor in the miRBase database with no mismatch; (2) based on the first condition, the tags align to the mature miRNA-allowed dislocation, but there are at least 16 bases covered, covering parts with no mismatch. Those miRNAs that satisfy both the above conditions will be counted to obtain the expression of identified miRNAs. The specific methods were shown as follows. First, it was necessary to summarize the common and specific tags of sequence libraries, as well as the unique and total tags. We calculated the sequencing frequency of each unique small RNA sequence and the number of reads for each sequence, which reflected relative abundance. Second, the unique RNA sequences were mapped to the human reference genome (National Center for Biotechnology Information (NCBI) Build 37.1) and the Rfam 9.1 database (http://www.sanger.ac.uk/resources/databases/rfam.html) using SOAP2. miRNA sequences that matched noncoding ribosomal RNA (rRNA), transfer RNA (tRNA), small nuclear RNA (snRNA) and small nucleolar RNA (snoRNA) in the NCBI and the Rfam 9.1 database were removed. Repeated overlapping sequences were annotated as repeated-associated small RNAs, and sequences that overlapped with predicted exons and introns were filtered. Third, in order to identify known miRNA sequences in iPSCs, the remaining unique small RNA sequences were compared to the miRNA database (miRBase 18.0). Only perfectly matched sequences were considered to be conserved miRNAs. The remaining sequences, which could not be matched to any category, were considered as candidate novel miRNAs.
Table 2.
Data cleaning process
| Type | AS |
NC |
||
| Count | Percent (%) | Count | Percent (%) | |
| Total reads | 14 432 099 | 14 694 442 | ||
| High quality | 14 378 062 | 100.00 | 14 642 018 | 100.00 |
| 3' adapter null | 9203 | 0.06 | 7110 | 0.05 |
| Insert null | 82 755 | 0.58 | 78 776 | 0.54 |
| 5' adapter contaminants | 803 564 | 5.59 | 826 226 | 5.64 |
| Smaller than 18 nt | 221 014 | 1.54 | 125 141 | 0.85 |
| Poly(A) | 4330 | 0.03 | 3288 | 0.02 |
| Clean reads | 13 257 196 | 92.20 | 13 601 477 | 92.89 |
Fig. 5.
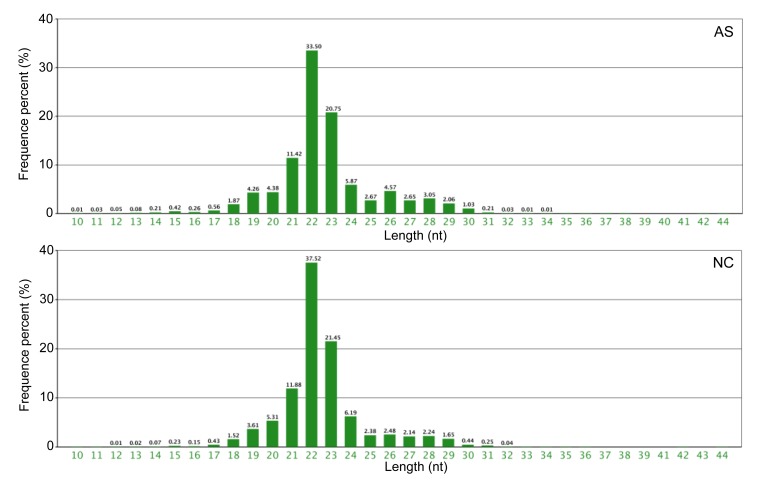
Length distribution of small RNAs in AS and NC individuals
2.4. Novel miRNA prediction
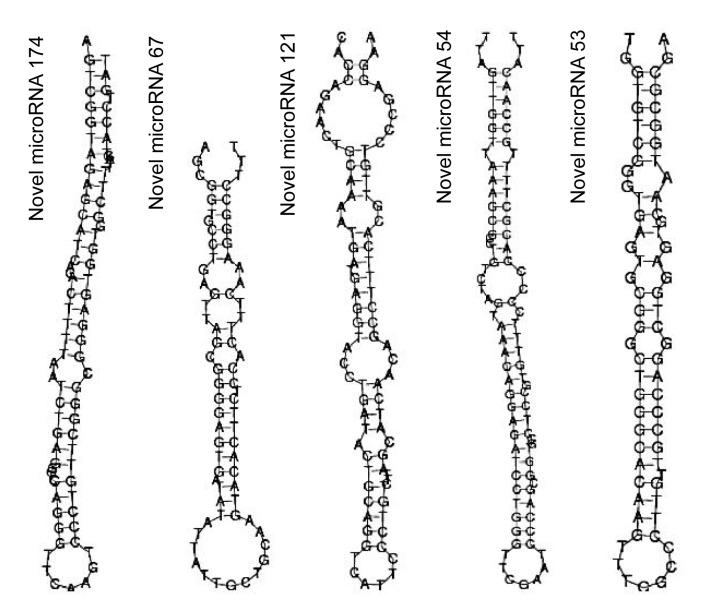
The prediction of novel miRNAs came from small RNA that could not be matched to the NCBI and the miRNA database. The characteristic hairpin structure of a miRNA precursor can be used to predict novel miRNAs (Fig. 6). The miRNA hairpins are mostly located in intergenic regions, introns or a reverse repeat sequence of a coding sequence. The MIREAP pipeline was then used to analyze the structural features to identify novel miRNA candidates. The prediction software was developed by BGI (http://sourceforge.net/projects/mireap/), and the procedure of the software MIREAP work on the novel miRNA prediction was conducted as described by Chen Y.H. et al. (2013). In brief, (1) the tags used to predict novel miRNA are from the unannotated tags which can match to the reference genome, from the tags which can align to the intron region, and from the tags which can align to the antisense exon region. (2) Those genes whose sequences and structures satisfied the two criteria, i.e. that hairpin miRNAs can fold secondary structures and mature miRNAs are present in one arm of the hairpin precursors, will be considered as candidate miRNA genes. (3) The mature miRNA strand and its complementary strand (miRNA*) present 2-nucleotide 3' overhangs. (4) Hairpin precursors lack large internal loops or bulges. (5) The secondary structures of the hairpins are steady, with the free energy of hybridization lower than or equal to −18 kcal/mol (1 kcal/mol=4.182 kJ/mol). (6) The number of mature miRNA with predicted hairpin must be no fewer than 5 in the alignment result. MPred (http://www.bioinf.seu.edu.cn/miRNA) was used to judge whether the candidates were real miRNA precursors. Pseudo miRNA precursors were removed.
Fig. 6.
Region of the stem loop that corresponds to the predicted novel miRNA
2.5. Differential expression analysis of miRNAs
The frequency of the miRNAs in the two libraries was normalized to one million against the total number of miRNAs observed in each sample (normalized expression=actual miRNA count/total count of clean reads×1 000 000). For each library, if the normalized expression of an individual miRNA was zero, its expression value was modified to 0.01. If the miRNA expression level in the two samples was less than one, it could not be included in the following differential expression analysis. The statistical significance (P-value) was inferred using the Bayesian method, which was developed for analysis of digital gene expression profiles and can account for the sampling of tags with low counts (Anders and Huber, 2010). Fold-change (AS/NC) was used to detect the differentially expressed miRNAs. In the normalized sequence counts, a fold-change of greater than two and P≤0.01 were considered to be significant.
2.6. Target prediction of differentially expressed miRNAs using GO terms and KEGG pathway analysis
The target genes for each differentially expressed miRNAs were predicted using TargetScan (http://www.targetscan.org). As miRNA target prediction often suffers from a high level of false positives, the miRNA target interactions were predicted using at least three arbitrary target prediction programs. The GO terms and KEGG pathways of the target genes were annotated using the DAVID gene annotation tool (http://david.abcc.ncifcrf.gov). The GO terms and KEGG pathways were defined as significantly enriched in target gene candidates when using a corrected P-value of ≤0.01. This analysis was able to recognize the main biological functions and pathways, in which target gene candidates are involved.
2.7. Validation of miRNA and novel miRNA by quantitative reverse transcriptase PCR (qRT-PCR)
To validate the expression level of the different-expression miRNA and novel miRNA determined by deep sequencing, qRT-PCR was selected and designed for three miRNAs (hsa-miR-1179, hsa-miR-4461, hsa-miR-4651) and three novel miRNAs (novel-miR-202, novel-miR-81, novel-miR-185) that differentially expressed between AS and NC. Three miRNAs and three novel miRNAs were selected for validation by qRT-PCR using the miScript Reverse Transcription and miScript SYBR GREEN PCR Kits according to the manufacturer’s protocol (Qiagen, Germany) and U6 RNA was used as the internal control. The conditions for PCR amplification were as follows: polymerase activation at 95 °C for 2 min, followed by 40 cycles of 94 °C for 10 s, 59 °C for 10 s and 72 °C for 40 s. RNA was reverse transcribed to complementary DNA (cDNA) with a miRNA specific stem-loop like RT primer and the expression of each miRNA relative to NC was determined using the 2−∆∆CT method. Comparative qRT-PCR was performed in triplicate. All of the primers, which were designed by Primer Express Software V2.0 (ABI, America), are listed in Table S1.
3. Results
3.1. Small RNA length distribution and annotation
To identify miRNAs, Solexa sequencing was used on the libraries of small RNAs from the AS and NC individuals. A total of 14 432 099 and 14 694 442 reads were obtained from the AS and NC libraries, respectively. After removal of the adaptor sequences, low quality reads, contaminated reads, and short RNA (<18 nt), 13 257 196 and 13 601 477 clean reads remained from the AS and NC libraries, respectively (Table 2). In both libraries, the proportion of clean reads was greater than 90%. The length distribution of the clean reads is summarized in Fig. 5. The most abundant small RNAs were 22 nt long in both the AS and NC libraries. The percentages of small RNAs of this size were approximately 33.50% and 37.52% in the AS and NC groups, respectively. The length distribution in the two libraries ranged from 18 to 30 nt and the majority of small RNAs were 19 to 29 nt long. The peak of the length distribution was used to analyze the composition of the samples, such as miRNA (concentrated at 21 or 22 nt), small interfering RNA (siRNA; 24 nt), and piwi-interacting RNA (piRNA; 29‒30 nt). The length distribution varies between plants and animals. The peak of the plant distribution is often located at 21 or 24 nt, while in animals it is at 22 nt. The above data and information were used to make an initial judgment.
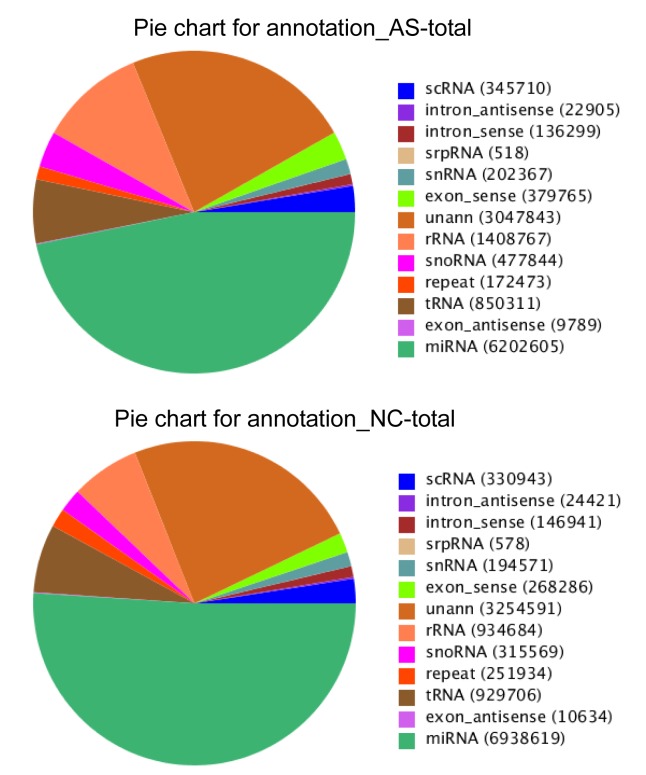
The high quality clean reads longer than 18 nt, from both libraries, were selected to be mapped to the human genome (NCBI Build 37.1) (Li et al., 2009). This gave 13 257 196 mapped reads from the AS group and 10 672 377 mapped reads from the NC group. These small RNA sequences were annotated as known miRNA, noncoding RNAs (snRNAs, piRNAs, small cytoplasmic RNAs (scRNAs), snoRNA and signal recognition particle RNA (srpRNAs)), genomic repeated miRNA or unclassified. As expected, the most abundant RNA category from the two libraries was known miRNA, with 6 202 605 reads for the AS library and 6 938 619 reads for the NC library (Fig. 7). All the sequences were submitted to NCBI and assigned the accession number of SRP041435.
Fig. 7.
Annotation of small RNAs in the AS and NC libraries
3.2. Novel miRNAs
We identified 211 and 329 novel miRNAs in the AS and NC libraries, respectively. The top ten novel miRNAs are shown in Table 3. The most abundant novel miRNA was novel miRNA-174, which was expressed in both the AS and NC libraries. Of the top ten novel miRNAs in each library, eight (novel miRNA-174, novel miRNA-67, novel miRNA-121, novel miRNA-54, novel miRNA-53, novel miRNA-19, novel miRNA-35, and novel miRNA-122) were the same. The number of novel miRNAs was fewer than the number of known miRNAs and most were expressed at a very low level.
Table 3.
Top ten novel miRNAs predicted from the AS and NC libraries
| Novel miRNA name | Novel miRNA sequence (5'‒3') | Count | Chromosome location |
| AS group | |||
| Novel-miR-174 | TCGGGCGGGAGTGGTGGCTTTT | 69 364 | chr6:28918819:28918903:+ |
| Novel-miR-67 | GAGTTAGCGGGGAGTGATATATT | 1825 | chr17:8042708:8042779:− |
| Novel-miR-121 | GCAAAATGATGAGGTACCTGATA | 1328 | chr20:3194750:3194836:+ |
| Novel-miR-54 | CCGTGTTTCCCCCACGCTTT | 1191 | chr17:8090489:8090581:+ |
| Novel-miR-53 | TGAGTGCGGGCTGGGCACAAGT | 621 | chr17:6347800:6347869:+ |
| Novel-miR-19 | TGGGAGGAACAAGTATGCATT | 311 | chr11:16984501:16984581:− |
| Novel-miR-35 | AGCTGGGGATGGAAGCTGAAGCC | 305 | chr13:111102941:111103018:+ |
| Novel-miR-122 | TGCCCGGCGGTGTGCGGCCACA | 175 | chr20:17486149:17486232:+ |
| Novel-miR-26 | AGGGGCGCGGCCCAGGAGCTCAGA | 169 | chr11:125757934:125758033:− |
| Novel-miR-136 | AAGGAGAGAGAACAGGCTGAGGT | 156 | chr22:42519489:42519568:− |
| NC group | |||
| Novel-miR-174 | TCGGGCGGGAGTGGTGGCTTTT | 85 185 | chr6:28918819:28918903:+ |
| Novel-miR-121 | GCAAAATGATGAGGTACCTGATA | 1535 | chr20:3194750:3194836:+ |
| Novel-miR-67 | GAGTTAGCGGGGAGTGATATATT | 1442 | chr17:8042708:8042779:− |
| Novel-miR-53 | TGAGTGCGGGCTGGGCACAAGT | 930 | chr17:6347800:6347869:+ |
| Novel-miR-54 | CCGTGTTTCCCCCACGCTTT | 893 | chr17:8090489:8090581:+ |
| Novel-miR-35 | AGCTGGGGATGGAAGCTGAAGCC | 799 | chr13:111102941:111103018:+ |
| Novel-miR-19 | TGGGAGGAACAAGTATGCATT | 373 | chr11:16984501:16984581:− |
| Novel-miR-232 | AGGGGCGCGGCCCAGGAGCTCAG | 257 | chr12:122460217:122460310:− |
| Novel-miR-177 | TCGGGGAGATGAGAGACGTGTT | 227 | chr6:42071607:42071696:− |
| Novel-miR-122 | TGCCCGGCGGTGTGCGGCCACA | 182 | chr20:17486149:17486232:+ |
3.3. Differentially expressed miRNAs in the AS and NC libraries
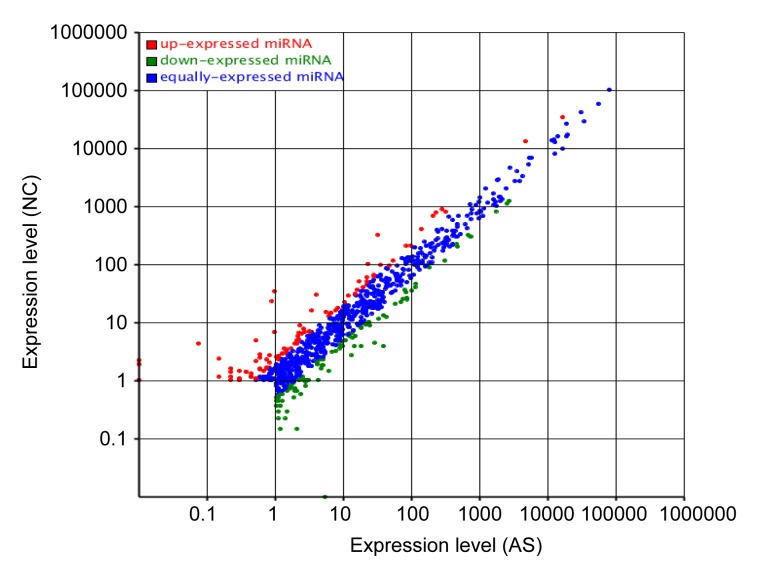
In order to identify differences in expression, the normalized expression of miRNAs was compared between the AS and NC libraries. Fold changes and P-values are presented in Table 4. Nineteen miRNAs were up-regulated and 11 were down-regulated. The most up-regulated miRNA was hsa-miR-3117-3p, which showed an increase in expression of approximately 7-fold (log2ratio) in the AS library compared with the NC library. The most down-regulated miRNA was hsa-miR-544b, which showed a decrease in expression of approximately 9-fold (log2ratio). The miRNA differential expression scatter plot (Fig. 8) showed that most of the miRNAs were expressed at an equal level, when the AS library was compared with the NC library. There were very few remaining miRNAs that showed significant levels of expression.
Table 4.
Differentially expressed miRNAs in the AS and NC libraries
| miRNA name | NC-std | AS-std | Fold-change (log2(AS/NC)) | P-value | Mode |
| hsa-miR-3117-3p | 0.0100 | 2.2056 | 7.78502736 | 0.0000 | Up |
| hsa-miR-3161 | 0.0100 | 1.9116 | 7.57863686 | 0.0000 | Up |
| hsa-miR-6821-5p | 0.0100 | 1.0293 | 6.68551972 | 0.0001 | Up |
| hsa-miR-3131 | 0.0754 | 4.3378 | 5.84625520 | 0.0000 | Up |
| hsa-miR-3679-5p | 0.9806 | 34.5551 | 5.13909008 | 0.0000 | Up |
| hsa-miR-4467 | 0.9052 | 23.3798 | 4.69088219 | 0.0000 | Up |
| hsa-miR-582-5p | 0.1509 | 2.3527 | 3.96265266 | 0.0000 | Up |
| hsa-miR-219a-2-3p | 32.5861 | 324.4501 | 3.31566801 | 0.0000 | Up |
| hsa-miR-1179 | 0.5280 | 4.8524 | 3.20008865 | 0.0000 | Up |
| hsa-miR-6763-5p | 0.1509 | 1.1763 | 2.96259134 | 0.0009 | Up |
| hsa-miR-219a-5p | 3.9978 | 30.2173 | 2.91809655 | 0.0000 | Up |
| hsa-miR-519e-3p | 0.2263 | 1.6175 | 2.83745722 | 0.0001 | Up |
| hsa-miR-1228-5p | 0.9806 | 6.7640 | 2.78613999 | 0.0000 | Up |
| hsa-miR-7-2-3p | 0.2263 | 1.3969 | 2.62592026 | 0.0006 | Up |
| hsa-miR-4461 | 0.6034 | 2.7938 | 2.21104214 | 0.0000 | Up |
| hsa-miR-675-5p | 3.4698 | 15.9541 | 2.20100281 | 0.0000 | Up |
| hsa-miR-335-5p | 23.3081 | 102.7830 | 2.14069836 | 0.0000 | Up |
| hsa-miR-518d-3p | 0.6034 | 2.4997 | 2.05056836 | 0.0001 | Up |
| hsa-miR-4651 | 0.5280 | 2.1321 | 2.01366527 | 0.0003 | Up |
| hsa-miR-3609 | 6.1099 | 1.4704 | −2.05494010 | 0.0000 | Down |
| hsa-miR-1264 | 4.2996 | 1.0293 | −2.06253892 | 0.0000 | Down |
| hsa-miR-3690 | 18.4805 | 3.8966 | −2.24571604 | 0.0000 | Down |
| hsa-miR-142-5p | 13.4267 | 2.7203 | −2.30326710 | 0.0000 | Down |
| hsa-miR-3659 | 1.5086 | 0.2941 | −2.35883164 | 0.0007 | Down |
| hsa-miR-370-5p | 1.4332 | 0.2206 | −2.69973525 | 0.0004 | Down |
| hsa-miR-299-5p | 29.0408 | 4.4113 | −2.71880541 | 0.0000 | Down |
| hsa-miR-494-5p | 1.2069 | 0.1470 | −3.03741808 | 0.0006 | Down |
| hsa-miR-146a-5p | 39.0731 | 3.8966 | −3.32588797 | 0.0000 | Down |
| hsa-miR-495-5p | 2.1121 | 0.1470 | −3.84479008 | 0.0000 | Down |
| hsa-miR-544b | 5.4310 | 0.0100 | −9.08507408 | 0.0000 | Down |
Fig. 8.
Differential expression scatter plot (control: x; treatment: y)
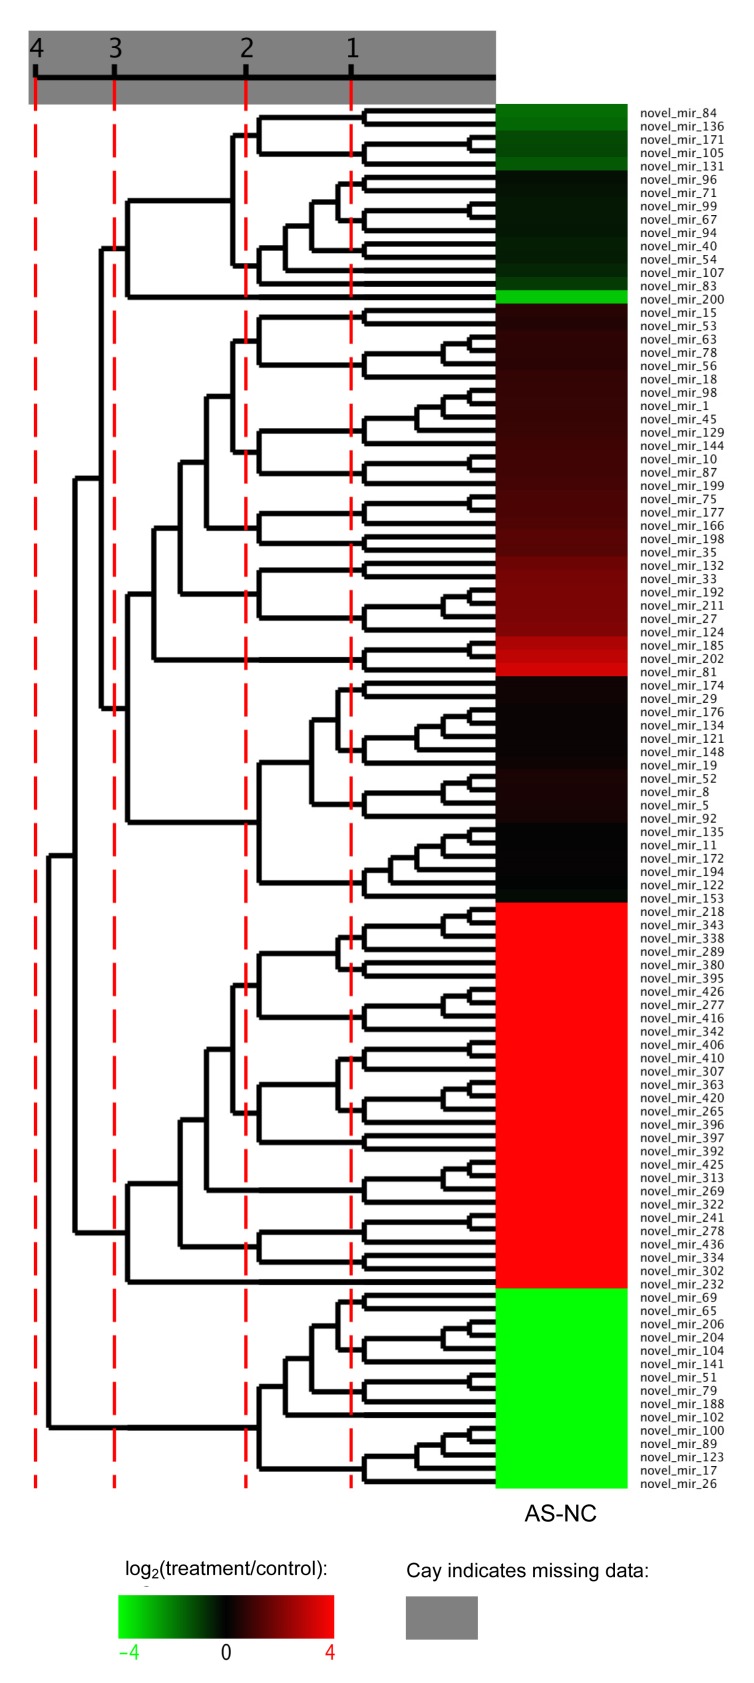
Forty-nine novel miRNAs were identified as differentially expressed. Thirty-three were up-regulated and 16 were down-regulated (Table 5). Most exhibited a significantly high fold-change (log2ratio) of ≥6 or ≤−6. These datasets indicated that a set of novel miRNAs showed a clear difference in level of expression between the AS and NC libraries. The differential expression model cluster analysis (Fig. 9) also showed that most novel miRNAs had significantly different levels of expression. To confirm the differential expression of the miRNAs and novel miRNAs, the expressions of three miRNAs and three novel miRNAs were analyzed using qRT-PCR. The expression level of each miRNA in the AS and NC had the same expression pattern as those in the sequencing data (Table 6). All of the three miRNAs and novel miRNAs were up-regulated, and the result was consistent with the result of a microarray test.
Table 5.
Novel miRNAs that showed differential expression in the AS and NC libraries
| Novel miRNA name | NC-std | AS-std | Fold-change (log2(AS/NC)) | P-value | Mode |
| Novel-miR-232 | 0.0100 | 18.8950 | 10.88378880 | 0.0000 | Up |
| Novel-miR-436 | 0.0100 | 7.9403 | 9.63304971 | 0.0000 | Up |
| Novel-miR-278 | 0.0100 | 7.5727 | 9.56466397 | 0.0000 | Up |
| Novel-miR-241 | 0.0100 | 7.3521 | 9.52201258 | 0.0000 | Up |
| Novel-miR-334 | 0.0100 | 6.2493 | 9.28755079 | 0.0000 | Up |
| Novel-miR-302 | 0.0100 | 5.7347 | 9.16357421 | 0.0000 | Up |
| Novel-miR-322 | 0.0100 | 3.7496 | 8.55059289 | 0.0000 | Up |
| Novel-miR-269 | 0.0100 | 3.1614 | 8.30441978 | 0.0000 | Up |
| Novel-miR-313 | 0.0100 | 2.7203 | 8.08762195 | 0.0000 | Up |
| Novel-miR-425 | 0.0100 | 2.6468 | 8.04810537 | 0.0000 | Up |
| Novel-miR-342 | 0.0100 | 1.9116 | 7.57863686 | 0.0000 | Up |
| Novel-miR-416 | 0.0100 | 1.7645 | 7.46311562 | 0.0000 | Up |
| Novel-miR-277 | 0.0100 | 1.6910 | 7.40173285 | 0.0000 | Up |
| Novel-miR-426 | 0.0100 | 1.6910 | 7.40173285 | 0.0000 | Up |
| Novel-miR-380 | 0.0100 | 1.6175 | 7.33762190 | 0.0000 | Up |
| Novel-miR-395 | 0.0100 | 1.5439 | 7.27043550 | 0.0000 | Up |
| Novel-miR-289 | 0.0100 | 1.3969 | 7.12608494 | 0.0000 | Up |
| Novel-miR-218 | 0.0100 | 1.3234 | 7.04810537 | 0.0000 | Up |
| Novel-miR-338 | 0.0100 | 1.3234 | 7.04810537 | 0.0000 | Up |
| Novel-miR-343 | 0.0100 | 1.3234 | 7.04810537 | 0.0000 | Up |
| Novel-miR-265 | 0.0100 | 1.1763 | 6.87811224 | 0.0000 | Up |
| Novel-miR-363 | 0.0100 | 1.1763 | 6.87811224 | 0.0000 | Up |
| Novel-miR-396 | 0.0100 | 1.1763 | 6.87811224 | 0.0000 | Up |
| Novel-miR-420 | 0.0100 | 1.1763 | 6.87811224 | 0.0000 | Up |
| Novel-miR-307 | 0.0100 | 1.1028 | 6.78502736 | 0.0000 | Up |
| Novel-miR-406 | 0.0100 | 1.1028 | 6.78502736 | 0.0000 | Up |
| Novel-miR-410 | 0.0100 | 1.1028 | 6.78502736 | 0.0000 | Up |
| Novel-miR-392 | 0.0100 | 1.0293 | 6.68551972 | 0.0001 | Up |
| Novel-miR-397 | 0.0100 | 1.0293 | 6.68551972 | 0.0001 | Up |
| Novel-miR-81 | 1.1315 | 11.3223 | 3.32285857 | 0.0000 | Up |
| Novel-miR-202 | 0.9052 | 7.2786 | 3.00735249 | 0.0000 | Up |
| Novel-miR-185 | 0.4526 | 2.9409 | 2.69994924 | 0.0000 | Up |
| Novel-miR-124 | 0.5280 | 2.1321 | 2.01366527 | 0.0003 | Up |
| Novel-miR-200 | 10.2586 | 1.1763 | −3.12450591 | 0.0000 | Down |
| Novel-miR-141 | 1.1315 | 0.0100 | −6.82209277 | 0.0000 | Down |
| Novel-miR-104 | 1.2069 | 0.0100 | −6.91516234 | 0.0000 | Down |
| Novel-miR-204 | 1.2069 | 0.0100 | −6.91516234 | 0.0000 | Down |
| Novel-miR-206 | 1.2069 | 0.0100 | −6.91516234 | 0.0000 | Down |
| Novel-miR-65 | 1.4332 | 0.0100 | −7.16309615 | 0.0000 | Down |
| Novel-miR-69 | 1.5086 | 0.0100 | −7.23706653 | 0.0000 | Down |
| Novel-miR-188 | 1.7349 | 0.0100 | −7.43870869 | 0.0000 | Down |
| Novel-miR-79 | 1.8103 | 0.0100 | −7.50008499 | 0.0000 | Down |
| Novel-miR-51 | 1.8858 | 0.0100 | −7.55903286 | 0.0000 | Down |
| Novel-miR-102 | 2.7155 | 0.0100 | −8.08507404 | 0.0000 | Down |
| Novel-miR-100 | 3.3944 | 0.0100 | −8.40701275 | 0.0000 | Down |
| Novel-miR-89 | 3.3944 | 0.0100 | −8.40701275 | 0.0000 | Down |
| Novel-miR-123 | 4.1487 | 0.0100 | −8.69651554 | 0.0000 | Down |
| Novel-miR-17 | 6.2608 | 0.0100 | −9.29020318 | 0.0000 | Down |
| Novel-miR-26 | 12.7478 | 0.0100 | −10.31603254 | 0.0000 | Down |
Fig. 9.
Novel miRNA differential expression model cluster analysis
Table 6.
qRT-PCR confirmation data
| Group | CT | CT mean | CTU6 mean | ∆C T | NC ∆C T | ∆∆C T | 2−∆∆CT |
| hsa-miR-1179 | |||||||
| AS | 29.807 | 30.090 | 22.855 | 7.235 | 7.790 | −0.555 | 1.469 |
| AS | 29.937 | 30.090 | 22.855 | 7.235 | 7.790 | −0.555 | 1.469 |
| AS | 30.527 | 30.090 | 22.855 | 7.235 | 7.790 | −0.555 | 1.469 |
| NC | 31.033 | 30.833 | 23.043 | 7.790 | 7.790 | 0.000 | 1.000 |
| NC | 30.743 | 30.833 | 23.043 | 7.790 | 7.790 | 0.000 | 1.000 |
| NC | 30.723 | 30.833 | 23.043 | 7.790 | 7.790 | 0.000 | 1.000 |
| hsa-miR-4461 | |||||||
| AS | 26.902 | 27.317 | 22.855 | 4.461 | 11.719 | −7.258 | 153.045 |
| AS | 27.758 | 27.317 | 22.855 | 4.461 | 11.719 | −7.258 | 153.045 |
| AS | 27.290 | 27.317 | 22.855 | 4.461 | 11.719 | −7.258 | 153.045 |
| NC | 34.766 | 34.762 | 23.043 | 11.719 | 11.719 | 0.000 | 1.000 |
| NC | 34.910 | 34.762 | 23.043 | 11.719 | 11.719 | 0.000 | 1.000 |
| NC | 34.611 | 34.762 | 23.043 | 11.719 | 11.719 | 0.000 | 1.000 |
| hsa-miR-4651 | |||||||
| AS | 22.085 | 22.050 | 22.855 | −0.805 | 0.965 | −1.770 | 3.411 |
| AS | 22.182 | 22.050 | 22.855 | −0.805 | 0.965 | −1.770 | 3.411 |
| AS | 21.882 | 22.050 | 22.855 | −0.805 | 0.965 | −1.770 | 3.411 |
| NC | 25.018 | 24.008 | 23.043 | 0.965 | 0.965 | 0.000 | 1.000 |
| NC | 24.549 | 24.008 | 23.043 | 0.965 | 0.965 | 0.000 | 1.000 |
| NC | 24.756 | 24.008 | 23.043 | 0.965 | 0.965 | 0.000 | 1.000 |
| Novel-miR-22 | |||||||
| AS | 21.190 | 21.139 | 22.855 | −1.717 | 1.839 | −3.556 | 11.760 |
| AS | 21.069 | 21.139 | 22.855 | −1.717 | 1.839 | −3.556 | 11.760 |
| AS | 21.157 | 21.139 | 22.855 | −1.717 | 1.839 | −3.556 | 11.760 |
| NC | 24.813 | 24.882 | 23.043 | 1.839 | 1.839 | 0.000 | 1.000 |
| NC | 24.925 | 24.882 | 23.043 | 1.839 | 1.839 | 0.000 | 1.000 |
| NC | 24.910 | 24.882 | 23.043 | 1.839 | 1.839 | 0.000 | 1.000 |
| Novel-miR-81 | |||||||
| AS | 22.867 | 22.866 | 22.855 | 0.011 | 6.399 | −6.388 | 83.754 |
| AS | 22.703 | 22.866 | 22.855 | 0.011 | 6.399 | −6.388 | 83.754 |
| AS | 23.029 | 22.866 | 22.855 | 0.011 | 6.399 | −6.388 | 83.754 |
| NC | 29.244 | 29.442 | 23.043 | 6.399 | 6.399 | 0.000 | 1.000 |
| NC | 29.778 | 29.442 | 23.043 | 6.399 | 6.399 | 0.000 | 1.000 |
| NC | 29.305 | 29.442 | 23.043 | 6.399 | 6.399 | 0.000 | 1.000 |
| Novel-miR-185 | |||||||
| AS | 31.310 | 31.149 | 22.855 | 8.294 | 10.029 | −1.735 | 3.329 |
| AS | 31.173 | 31.149 | 22.855 | 8.294 | 10.029 | −1.735 | 3.329 |
| AS | 30.964 | 31.149 | 22.855 | 8.294 | 10.029 | −1.735 | 3.329 |
| NC | 32.942 | 33.072 | 23.043 | 10.029 | 10.029 | 0.000 | 1.000 |
| NC | 33.463 | 33.072 | 23.043 | 10.029 | 10.029 | 0.000 | 1.000 |
| NC | 32.811 | 33.072 | 23.043 | 10.029 | 10.029 | 0.000 | 1.000 |
∆C T=CT mean−CTU6 mean; ∆∆C T=∆C T−NC ∆C T
3.4. GO and KEGG pathway analysis of targets
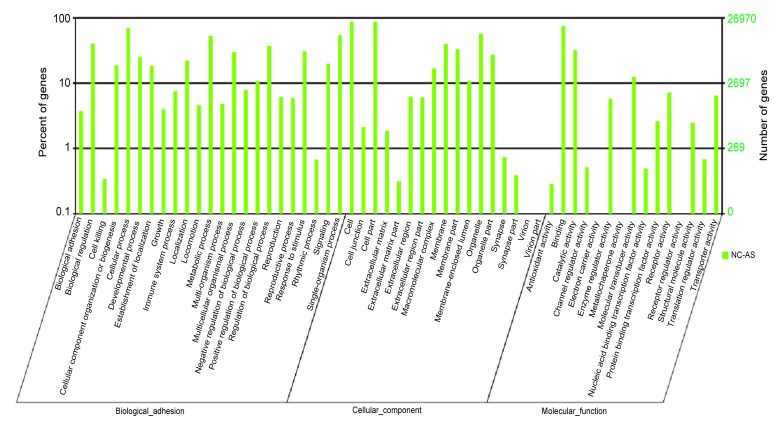
The targets of 30 miRNAs, which displayed significantly different levels of expression between the AS and NC libraries, were predicted by miRNA miRecords to elucidate the pathological relevance. To evaluate target gene functions, we annotated the predicted targets with GO using DAVID. The targets populated many major GO categories and for some categories the number of gene targets was significantly enriched, using P<0.05 to indicate significance. Three ontologies, i.e. molecular function, cellular component, and biological process, were found to be associated with the pathogenesis of AS (Fig. 10). On the basis of the biological process, the genes were classified into 23 categories. The top three over-represented GO terms were cellular process, metabolic process, and single-organism process. The genes were also grouped into 17 categories based on cellular components. The largest groups were cell, cell part and organelle. When the genes were grouped by molecular function, there were 15 categories. The most enriched molecular function categories were binding, catalytic activity, and molecular transducer activity.
Fig. 10.
GO annotation and analysis of miRNAs that showed differential expression between the two libraries
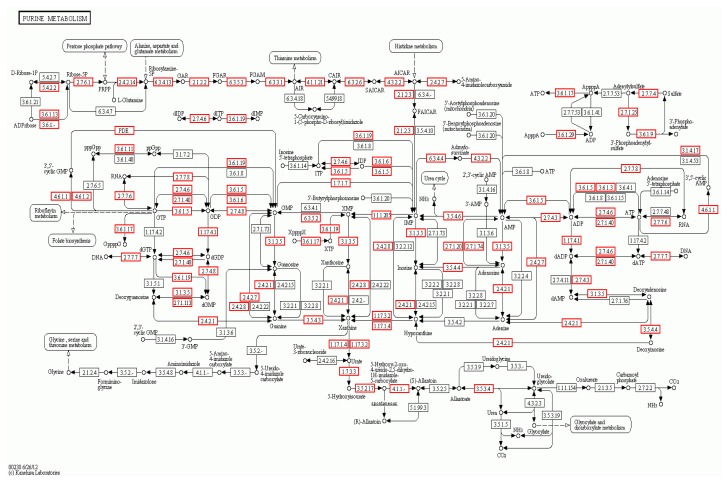
To determine whether specific pathways were enriched with the target genes, we mapped the genes to the KEGG pathway database using GenMAPPv2.1. A statistical test was performed to identify the enriched metabolic pathways, using P<0.05 to indicate significance. The top 20 KEGG pathways are shown in Table 7. The pathway that was most enriched by the target genes was purine metabolism. We found that 7.35% of target genes could be assigned to this pathway. The purine metabolism KEGG pathway analysis is shown in Fig. 11, which shows the genes that are targets of the differentially expressed miRNAs.
Table 7.
KEGG analysis to show the differentially expressed pathways in the AS and NC libraries
| Pathway | Target genes with pathway annotation (%) | P value |
| Purine metabolism | 7.35 | 0.04830 |
| MAPK signaling pathway | 3.33 | 0.04310 |
| Vascular smooth muscle contraction | 2.53 | 0.04988 |
| HTLV-I infection | 2.52 | 0.01069 |
| Olfactory transduction | 2.22 | 0.00589 |
| Calcium signaling pathway | 2.15 | 0.03431 |
| Chemokine signaling pathway | 2.05 | 0.02732 |
| Neurotrophin signaling pathway | 1.94 | 0.02137 |
| Huntington’s disease | 1.91 | 0.01267 |
| Viral myocarditis | 1.91 | 0.04788 |
| Influenza A | 1.80 | 0.02810 |
| Protein processing in endoplasmic reticulum | 1.80 | 0.04100 |
| Microbial metabolism in diverse environments | 1.72 | 0.01988 |
| Insulin signaling pathway | 1.61 | 0.03908 |
| Osteoclast differentiation | 1.49 | 0.01848 |
| Spliceosome | 1.48 | 0.00932 |
| Alcoholism | 1.46 | 0.04890 |
| GnRH signaling pathway | 1.34 | 0.04159 |
| ErbB signaling pathway | 1.26 | 0.01710 |
| NF-κB signaling pathway | 1.26 | 0.03109 |
Fig. 11.
Purine metabolism signaling KEGG pathway, which shows the differentially expressed genes in the AS and NC libraries
The red borders indicate the genes that are targets of the differentially expressed miRNAs (Note: for interpretation of the references to color in this figure legend, the reader is referred to the web version of this article)
4. Discussion
For the past 30 years, high-throughput sequencing technologies have opened up new opportunities in biomedicine (Ansorge, 2009). They enable the comprehensive analysis of genome sequence, target sequence, and RNA expression (Morozova and Marra, 2008). In this study, we analyzed miRNAs and their target genes in the AS and NC libraries from an AS family, using high-throughput sequencing.
In previous studies, peripheral blood and tissue specimens have been used as experimental samples to investigate the pathogenesis of disease. This is the first use of iPSCs as the experimental sample to analyze miRNAs in the pathogenesis of nephropathy. They are characterized by their ability to self-renew and differentiate into any cell type. Recent studies have begun to clarify the specific role of miRNA in regulatory circuitries that control self-renewal and pluripotency of iPSCs (Jia et al., 2013), as highlighted by Pfaff et al. (2012). In this study, the iPSCs were induced from renal tubular cells from kidney tissue. The iPSCs were expected to give more accurate data on kidney disease than traditional samples and are particularly significant for the analysis of miRNA and their target genes, which play a role in their generation.
We identified 30 differentially expressed miRNAs, of which 19 were up-regulated and 11 were down-regulated. Other studies have shown that levels of miRNAs could be used as a potential biomarker for kidney disease (Chung et al., 2013). For example, miRNA-21 expression was elevated in both the glomerular and tubulointerstitial area, where renal fibrosis occurs (He et al., 2013). Reduction of miRNA-192 expression correlated with glomerular filtration rate (GFR) in diabetic nephropathy (Putta et al., 2012). Dai et al. (2009) predicted that miRNA-223 was down-regulated and specific to lupus nephritis. The miRNA-29 family (miR-29a, miR-29b, miR-29c) consists of downstream inhibitors that can reduce the risk of renal fibrosis (Qin et al., 2011). In contrast, the significantly different levels of expression of the miRNAs in this study were not reported elsewhere. We hypothesized that this is a consequence of AS being a genetically inherited disease, which is characterized by sensorineural deafness and glomerulonephritis that progresses to end-stage renal failure. The pathological changes observed in other types of kidney disease have different causes, particularly those that involve the GBM (Miner, 2011).
Among the 30 differentially expressed miRNAs, hsa-miR-3117-3p was the most significantly different up-regulated expression miRNA with a fold-change of 7.785. hsa-miR-544b was the most significantly different down-regulated expression miRNA with a fold-change of −9.085. However, other differentially expressed miRNAs are also involved in genetic diseases. For example, hsa-miR-150-5p probably could serve as a novel serum biomarker in myasthenia gravis as well as in the prediction of disease severity (Punga et al., 2014). Due to the importance of miRNA in mediating the translation of target miRNA into protein, hsa-miR-1228-5p could be used to differentiate hepatocellular carcinoma patients from healthy subjects and cirrhosis patients (Tan et al., 2014). hsa-miR-142-5p has been widely researched and most scholars acknowledge that it is a predictor of disease progression to tumor, including pancreatic cancer, gastric cancer, and retinoblastoma (Jo et al., 2011; Zhang et al., 2011). We suspected that we could not find any miRNAs that regulated the pathogenesis in a single one. The 30 differentially expressed miRNAs should be regulated as a whole, and the interaction between them determines the pathogenesis of AS. Trionfini et al. (2015) pointed out that miRNA, according to available evidence, served as integration involved in all kinds of kidney physiologies and diseases.
The GO analysis showed that most target genes enriched the cell, cell part, cellular process, and binding categories. This indicated that, in the molecular function, cellular component, and biological process ontologies, most of the miRNA targets were related to cell function. These findings, both computational and experimental, provided valuable information for the further functional characterization of the pathogenesis of AS. Steenhard et al. (2012) used an animal model to confirm that overexpression of mesangial integrin α1, podocyte vimentin, and integrin α3 is an important feature of AS. These proteins may affect cell-signaling, cell shape, and cellular adhesion to the GBM. Abrahamson et al. (2003; 2009) reported that glomerular endothelial cells and podocytes synthesize the different laminin isoforms at appropriate stages of glomerular development. They are also able to stimulate re-expression of laminin in the absence of the α3, α4, and α5 network in the Alport mouse. We hypothesize that the target genes play an important role in the development, function, pathological and molecular genetics of the GBM in AS patients.
The top KEGG pathway was the purine metabolism signal pathway. However, there have been few reports that illustrate disorder of purine metabolism in AS patients. The main symptoms of AS do not include hyperuricaemia or gout, which are caused by problems with purine metabolism. However, a terminal product of purine catabolism can cause hyperuricaemia. This product is increasingly being linked with kidney disease and the hyperuricaemia levels rise as glomerular filtration declines (Murea, 2012). Elevated hyperuricaemia could be a marker for decrease in renal function and an important indicator for the progression of renal failure (Kang and Nakagawa, 2005). However, further studies are necessary to provide more insight into the pathways of purine metabolism. The mitogen activated protein kinase (MAPK) signal pathway was also highlighted in the KEGG analysis of our study. It has important functions in many types of mammalian cells. The MAPKs are serine and threonine protein kinases, which can be activated by phosphorylation, in response to extracellular stimuli such as mitogens, growth factors, cytokines, and osmotic stress (de Luca et al., 2012). The activation of the MAPK pathway has been shown to be a potential mechanism involved in kidney disease. Kidney disease can be ameliorated if the MAPK signal pathway is inhibited (Pengal et al., 2011; O'Connell et al., 2012). Our results demonstrated that the MAPK pathway is abnormal in AS patients, which provides an experimental basis for further studies into AS pathogenesis.
We obtained the differential expression profiles from an AS family. The differentially expressed miRNAs were subjected to GO-enriched and KEGG pathway analysis. Our study demonstrated that the differential expression miRNA, the target gene from differential expression miRNA enrichment and functional pathway may present an area of research into the pathogenesis of AS. These data will also serve as a reference to lay a foundation for us to better understand the genetic mutation of AS at the genetic level. However, there are many unanswered questions surrounding AS. Further investigation is needed.
Acknowledgments
We are grateful to the AS patients and the healthy persons who participated in this study. We thank the team of the Clinical Medical Research Center of Shenzhen People’s Hospital, the Second Clinical Medical College of Jinan University, Shenzhen, China.
List of electronic supplementary materials
Table S1.
qRT-PCR primers used in the validation assays
| Primer name | Sequences 5' to 3' | Melting temperature, Tm (°C) |
| mir-4461-RT | GTCGTATCCAGTGCGTGTCGTGGAGTCGG | |
| CAATTGCACTGGATACGACTATGGC | ||
| mir-4461-F | TATGTACGTAGTCTAGGCC | 55 |
| mir-1179-RT | GTCGTATCCAGTGCGTGTCGTGGAGTCGG | |
| CAATTGCACTGGATACGACACCAAC | ||
| mir-1179-F | AAGCATTCTTTCATTGGTTGG | 55 |
| mir-4651-RT | GTCGTATCCAGTGCGTGTCGTGGAGTCGG | |
| CAATTGCACTGGATACGACCCCACC | ||
| mir-4651-F | CGGCGACGGCGGGGT | 55 |
| Novel-mir-81-RT | GTCGTATCCAGTGCGTGTCGTGGAGTCGG | |
| CAATTGCACTGGATACGACGCCACG | ||
| Novel-mir-81-F | GGGGATGGGGAGGGGC | 55 |
| Novel-mir-202-RT | GTCGTATCCAGTGCGTGTCGTGGAGTCGG | |
| CAATTGCACTGGATACGACAAGTGT | ||
| Novel-mir-202-F | TATGAATGTTGATGGGTACAC | 55 |
| Novel-mir-185-RT | GTCGTATCCAGTGCGTGTCGTGGAGTCGG | |
| CAATTGCACTGGATACGACAGAGGA | ||
| Novel-mir-185-F | TGGGCGGCCACTTGACAT | 57 |
| miRNA-R | GTCGTATCCAGTGCGTGTC | |
| U6-RT | GTCGTATCCAGTGCGTGTCGTGGAGTCGG | |
| CAATTGCACTGGATACGACAAAATATG | ||
| U6-F | GATTAGCATGGCCCCTGC | 55 |
Footnotes
Project supported by the Shenzhen Knowledge Innovation Program of Basic Research Items of Guangdong Province (No. JCYJ2014 0416122812045), China
Electronic supplementary materials: The online version of this article (http://dx.doi.org/10.1631/jzus.B1400272) contains supplementary materials, which are available to authorized users
Compliance with ethics guidelines: Wen-biao CHEN, Jian-rong HUANG, Xiang-qi YU, Xiao-cong LIN, and Yong DAI declare that they have no conflict of interest.
All procedures followed were in accordance with the ethical standards of the responsible committee on human experimentation (institutional and national) and with the Helsinki Declaration of 1975, as revised in 2008 (5). Informed consent was obtained from all patients for being included in the study. Additional informed consent was obtained from all patients for whom identifying information is included in this article.
References
- 1.Abrahamson DR, Prettyman AC, Robert B, et al. Laminin-1 reexpression in Alport mouse glomerular basement membranes. Kidney Int. 2003;63(3):826–834. doi: 10.1046/j.1523-1755.2003.00800.x. [DOI] [PubMed] [Google Scholar]
- 2.Abrahamson DR, Hudson BG, Stroganova L, et al. Cellular origins of type IV collagen networks in developing glomeruli. J Am Soc Nephrol. 2009;20(7):1471–1479. doi: 10.1681/ASN.2008101086. [DOI] [PMC free article] [PubMed] [Google Scholar]
- 3.Anders S, Huber W. Differential expression analysis for sequence count data. Genome Biol. 2010;11(10):R106. doi: 10.1186/gb-2010-11-10-r106. [DOI] [PMC free article] [PubMed] [Google Scholar]
- 4.Ansorge WJ. Next-generation DNA sequencing techniques. N Biotechnol. 2009;25(4):195–203. doi: 10.1016/j.nbt.2008.12.009. [DOI] [PubMed] [Google Scholar]
- 5.Chen Y, Luo R, Xu Y, et al. Generation of systemic lupus erythematosus-specific induced pluripotent stem cells from urine. Rheumatol Int. 2013;33(8):2127–2134. doi: 10.1007/s00296-013-2704-5. [DOI] [PubMed] [Google Scholar]
- 6.Chen YH, Wang SQ, Wu XL, et al. Characterization of microRNAs expression profiling in one group of Chinese urothelial cell carcinoma identified by Solexa sequencing. Urol Oncol. 2013;31(2):219–227. doi: 10.1016/j.urolonc.2010.11.007. [DOI] [PubMed] [Google Scholar]
- 7.Chung AC, Yu X, Lan HY. MicroRNA and nephropathy: emerging concepts. Int J Nephrol Renovasc Dis. 2013;6:169–179. doi: 10.2147/ijnrd.s37885. [DOI] [PMC free article] [PubMed] [Google Scholar]
- 8.Colville DJ, Savige J. Alport syndrome. A review of the ocular manifestations. Ophthalmic Genet. 1997;18(4):161–173. doi: 10.3109/13816819709041431. [DOI] [PubMed] [Google Scholar]
- 9.Dai Y, Sui W, Lan H, et al. Comprehensive analysis of microRNA expression patterns in renal biopsies of lupus nephritis patients. Rheumatol Int. 2009;29(7):749–754. doi: 10.1007/s00296-008-0758-6. [DOI] [PubMed] [Google Scholar]
- 10.de Luca A, Maiello MR, D'Alessio A, et al. The RAS/RAF/MEK/ERK and the PI3K/AKT signalling pathways: role in cancer pathogenesis and implications for therapeutic approaches. Expert Opin Ther Targets. 2012;16(S2):S17–S27. doi: 10.1517/14728222.2011.639361. [DOI] [PubMed] [Google Scholar]
- 11.Gehrs KM, Pollock SC, Zilkha G. Clinical features and pathogenesis of Alport retinopathy. Retina. 1995;15(4):305–311. doi: 10.1097/00006982-199515040-00007. [DOI] [PubMed] [Google Scholar]
- 12.Gross O, Beirowski B, Koepke ML, et al. Preemptive ramipril therapy delays renal failure and reduces renal fibrosis in COL4A3-knockout mice with Alport syndrome. Kidney Int. 2003;63(2):438–446. doi: 10.1046/j.1523-1755.2003.00779.x. [DOI] [PubMed] [Google Scholar]
- 13.Gross O, Licht C, Anders HJ, et al. Early angiotensin-converting enzyme inhibition in Alport syndrome delays renal failure and improves life expectancy. Kidney Int. 2012;81(5):494–501. doi: 10.1038/ki.2011.407. [DOI] [PubMed] [Google Scholar]
- 14.Gubler MC, Heidet L, Antignac C. Alport syndrome or progressive hereditary nephritis with hearing loss. Nephrol Ther. 2007;3(3):113–120. doi: 10.1016/j.nephro.2007.03.005. (in French) [DOI] [PubMed] [Google Scholar]
- 15.Hafner M, Landgraf P, Ludwig J, et al. Identification of microRNAs and other small regulatory RNAs using cDNA library sequencing. Methods. 2008;44(1):3–12. doi: 10.1016/j.ymeth.2007.09.009. [DOI] [PMC free article] [PubMed] [Google Scholar]
- 16.He J, Xu Y, Koya D, et al. Role of the endothelial-to-mesenchymal transition in renal fibrosis of chronic kidney disease. Clin Exp Nephrol. 2013;17(4):488–497. doi: 10.1007/s10157-013-0781-0. [DOI] [PubMed] [Google Scholar]
- 17.Hertz JM. Alport syndrome. Molecular genetic aspects. Dan Med Bull. 2009;56(3):105–152. [PubMed] [Google Scholar]
- 18.Jia W, Chen W, Kang J. The functions of microRNAs and long non-coding RNAs in embryonic and induced pluripotent stem cells. Genomics Proteomics Bioinformatics. 2013;11(5):275–283. doi: 10.1016/j.gpb.2013.09.004. [DOI] [PMC free article] [PubMed] [Google Scholar]
- 19.Jo DH, Kim JH, Park WY, et al. Differential profiles of microRNAs in retinoblastoma cell lines of different proliferation and adherence patterns. J Pediatr Hematol Oncol. 2011;33(7):529–533. doi: 10.1097/MPH.0b013e318228280a. [DOI] [PubMed] [Google Scholar]
- 20.Kang DH, Nakagawa T. Uric acid and chronic renal disease: possible implication of hyperuricemia on progression of renal disease. Semin Nephrol. 2005;25(1):43–49. doi: 10.1016/j.semnephrol.2004.10.001. [DOI] [PubMed] [Google Scholar]
- 21.Kashtan CE. Alport syndrome and thin basement membrane nephropathy. In: Pagon RA, Adam MP, Ardinger HH, editors. GeneReviews. Seattle, WA: University of Washington; 1993. [Google Scholar]
- 22.Kashtan CE. Alport syndrome: an inherited disorder of renal, ocular, and cochlear basement membranes. Medicine. 1999;78(5):338–360. doi: 10.1097/00005792-199909000-00005. [DOI] [PubMed] [Google Scholar]
- 23.Li R, Yu C, Li Y, et al. SOAP2: an improved ultrafast tool for short read alignment. Bioinformatics. 2009;25(15):1966–1967. doi: 10.1093/bioinformatics/btp336. [DOI] [PubMed] [Google Scholar]
- 24.Miner JH. Glomerular basement membrane composition and the filtration barrier. Pediatr Nephrol. 2011;26(9):1413–1417. doi: 10.1007/s00467-011-1785-1. [DOI] [PMC free article] [PubMed] [Google Scholar]
- 25.Morozova O, Marra MA. Applications of next-generation sequencing technologies in functional genomics. Genomics. 2008;92(5):255–264. doi: 10.1016/j.ygeno.2008.07.001. [DOI] [PubMed] [Google Scholar]
- 26.Murea M. Advanced kidney failure and hyperuricemia. Adv Chronic Kidney Dis. 2012;19(6):419–424. doi: 10.1053/j.ackd.2012.07.008. [DOI] [PubMed] [Google Scholar]
- 27.O'Connell S, Tuite N, Slattery C, et al. Cyclosporine A-induced oxidative stress in human renal mesangial cells: a role for ERK1/2 MAPK signaling. Toxicol Sci. 2012;126(1):101–113. doi: 10.1093/toxsci/kfr330. [DOI] [PubMed] [Google Scholar]
- 28.Pengal R, Guess AJ, Agrawal S, et al. Inhibition of the protein kinase MK-2 protects podocytes from nephrotic syndrome-related injury. Am J Physiol Renal Physiol. 2011;301(3):F509–F519. doi: 10.1152/ajprenal.00661.2010. [DOI] [PMC free article] [PubMed] [Google Scholar]
- 29.Pfaff N, Moritz T, Thum T, et al. miRNAs involved in the generation, maintenance, and differentiation of pluripotent cells. J Mol Med. 2012;90(7):747–752. doi: 10.1007/s00109-012-0922-z. [DOI] [PubMed] [Google Scholar]
- 30.Pohl M, Danz K, Gross O, et al. Diagnosis of Alport syndrome-search for proteomic biomarkers in body fluids. Pediatr Nephrol. 2013;28(11):2117–2123. doi: 10.1007/s00467-013-2533-5. [DOI] [PubMed] [Google Scholar]
- 31.Punga T, Le Panse R, Andersson M, et al. Circulating miRNAs in myasthenia gravis: miR-150-5p as a new potential biomarker. Ann Clin Transl Neurol. 2014;1(1):49–58. doi: 10.1002/acn3.24. [DOI] [PMC free article] [PubMed] [Google Scholar]
- 32.Putta S, Lanting L, Sun G, et al. Inhibiting microRNA-192 ameliorates renal fibrosis in diabetic nephropathy. J Am Soc Nephrol. 2012;23(3):458–469. doi: 10.1681/ASN.2011050485. [DOI] [PMC free article] [PubMed] [Google Scholar]
- 33.Qin W, Chung AC, Huang XR, et al. TGF-β/Smad3 signaling promotes renal fibrosis by inhibiting miR-29. J Am Soc Nephrol. 2011;22(8):1462–1474. doi: 10.1681/ASN.2010121308. [DOI] [PMC free article] [PubMed] [Google Scholar]
- 34.Steenhard BM, Vanacore R, Friedman D, et al. Upregulated expression of integrin α1 in mesangial cells and integrin α3 and vimentin in podocytes of Col4a3-null (Alport) mice. PLoS ONE. 2012;7(12):e50745. doi: 10.1371/journal.pone.0050745. [DOI] [PMC free article] [PubMed] [Google Scholar]
- 35.Tan Y, Ge G, Pan T, et al. A serum microRNA panel as potential biomarkers for hepatocellular carcinoma related with hepatitis B virus. PLoS ONE. 2014;9(9):e107986. doi: 10.1371/journal.pone.0107986. [DOI] [PMC free article] [PubMed] [Google Scholar]
- 36.Temme J, Kramer A, Jager KJ, et al. Outcomes of male patients with Alport syndrome undergoing renal replacement therapy. Clin J Am Soc Nephrol. 2012;7(12):1969–1976. doi: 10.2215/CJN.02190312. [DOI] [PMC free article] [PubMed] [Google Scholar]
- 37.Thorner PS. Alport syndrome and thin basement membrane nephropathy. Nephron Clin Pract. 2007;106(2):c82–c88. doi: 10.1159/000101802. [DOI] [PubMed] [Google Scholar]
- 38.Trionfini P, Benigni A, Remuzzi G. MicroRNAs in kidney physiology and disease. Nat Rev Nephrol. 2015;11(1):23–33. doi: 10.1038/nrneph.2014.202. [DOI] [PubMed] [Google Scholar]
- 39.Tryggvason K, Zhou J, Hostikka SL, et al. Molecular genetics of Alport syndrome. Kidney Int. 1993;43(1):38–44. doi: 10.1038/ki.1993.8. [DOI] [PubMed] [Google Scholar]
- 40.Zhang KW, Colville D, Tan R, et al. The use of ocular abnormalities to diagnose X-linked Alport syndrome in children. Pediatr Nephrol. 2008;23(8):1245–1250. doi: 10.1007/s00467-008-0759-4. [DOI] [PubMed] [Google Scholar]
- 41.Zhang X, Yan Z, Zhang J, et al. Combination of hsa-miR-375 and hsa-miR-142-5p as a predictor for recurrence risk in gastric cancer patients following surgical resection. Ann Oncol. 2011;22(10):2257–2266. doi: 10.1093/annonc/mdq758. [DOI] [PubMed] [Google Scholar]


