Abstract
Aquaporin-1 (AQP1) enables greatly enhanced water flux across plasma membranes. The cytosolic carboxy terminus of AQP1 has two acidic motifs homologous to known carbonic anhydrase II (CAII) binding sequences. CAII colocalizes with AQP1 in the renal proximal tubule. Expression of AQP1 with CAII in Xenopus oocytes or mammalian cells increased water flux relative to AQP1 expression alone. This required the amino-terminal sequence of CAII, a region that binds other transport proteins. Expression of catalytically inactive CAII failed to increase water flux through AQP1. Proximity ligation assays revealed close association of CAII and AQP1, an effect requiring the second acidic cluster of AQP1. This motif was also necessary for CAII to increase AQP1-mediated water flux. Red blood cell ghosts resealed with CAII demonstrated increased osmotic water permeability compared with ghosts resealed with albumin. Water flux across renal cortical membrane vesicles, measured by stopped-flow light scattering, was reduced in CAII-deficient mice compared with wild-type mice. These data are consistent with CAII increasing water conductance through AQP1 by a physical interaction between the two proteins.
INTRODUCTION
Intravascular volume is maintained by a complex interplay between organ systems, with a central role of renal sodium and water handling. The glomerulus filters a large quantity of water daily; the majority is reabsorbed by the proximal tubule. The rate of water absorption from the proximal tubule is significantly higher than can be explained by water flow across a lipid bilayer (van Heeswijk and van Os, 1986). This observation led to the prediction of the presence of a water “channel” in proximal tubular membranes (van Heeswijk and van Os, 1986) and the Nobel Prize–winning work of Peter Agre, who identified aquaporin-1 (AQP1) from red blood cells (Preston and Agre, 1991; Preston et al., 1992). Subsequently AQP1 was identified in the proximal tubule and thin descending limb of the loop of Henle, where it mediates water reabsorption (Sabolic et al., 1992; Zhang et al., 1993; Schnermann et al., 1998; Chou et al., 1999).
Transepithelial sodium movement across the proximal tubule creates a concentration gradient that drives water reabsorption (Lorenz et al., 1999). Sodium moves across the apical plasma membrane of the proximal tubular cell in exchange for the efflux of a proton, mediated by the sodium proton exchanger isoform 3 (NHE3). The catalysis of water and CO2 into H+ and HCO3− via cytosolic carbonic anhydrase II (CAII) participates in the reabsorption of water and sodium by providing H+ for the exchange reaction. Water, a substrate of CAII, enters the proximal tubular cell via AQP1. CO2, the other substrate of CAII, also likely permeates AQP1 tetramers, although this idea is disputed (Nakhoul et al., 1998; Fang et al., 2002; Endeward et al., 2006; Musa-Aziz et al., 2009; Geyer et al., 2013). Clearly, AQP1 is necessary for prodigious water reabsorption from the proximal tubule, as is CAII.
CAII interacts with membrane transport proteins, including the chloride/bicarbonate exchanger AE1 (Vince and Reithmeier, 1998, 2000), the sodium/hydrogen exchanger NHE1 (Li et al., 2002, 2006), the sodium bicarbonate cotransporter 1 NBCe1 (Loiselle et al., 2004; Pushkin et al., 2004; Becker and Deitmer, 2007), and the monocarboxylate transporters MCT1 (Becker and Deitmer, 2008) and MCT4 (Becker et al., 2010). Association with CAII enhances the rate of transport. Because AQP1 moves water and potentially CO2 (both substrates of CAII) across membranes, we postulated that CAII and AQP1 physically and functionally interact.
The cytosolic C-terminus of human AQP1 contains an LDADD motif, the exact sequence that binds CAII in AE1 (Vince and Reithmeier, 2000). AQP1 and CAII colocalize in the apical membrane of the proximal tubule, consistent with their association. Coexpression of AQP1 and CAII increased plasma membrane water permeability in oocytes and mammalian cells, an effect requiring the interacting regions of both CAII and AQP1. A proximity ligation assay confirmed that CAII and AQP1 are closely juxtaposed. Red blood cell ghosts had increased water permeability when supplemented with CAII but not with albumin. Further, renal cortical membranes isolated from CAII-deficient mice demonstrate decreased water flux compared with wild-type membranes. Taken together, these data support a CAII-AQP1 physical interaction that increases water flux through AQP1.
RESULTS
The cytosolic C-terminus of AQP1 contains two potential CAII binding sites
The physical interaction between CAII and AE1 is mediated by an acidic cluster of amino acids, L886DADD, in the cytosolic C-terminal domain of AE1 (Vince and Reithmeier, 2000). A carbonic anhydrase binding motif was subsequently defined as a hydrophobic amino acid followed by a sequence of four amino acids, with at least two acid residues (Vince and Reithmeier, 2000). Examination of the amino acid sequence in the cytosolic C-terminus of human AQP1 revealed two potential carbonic anhydrase II binding sites (CABs), VE251EYD and LD256ADD (Figure 1A). Surprisingly, the second CAB (CABII) is identical to AE1's CAII binding motif. Moreover, this sequence is conserved across species (Figure 1A). Examination of the cytosolic termini of the other aquaporins failed to identify a similar acidic cluster (Figure 1B). The presence of sequential CABs in the cytosolic C-terminus of AQP1 raises the possibility of altered water flux through AQP1 upon CAII interaction.
FIGURE 1:
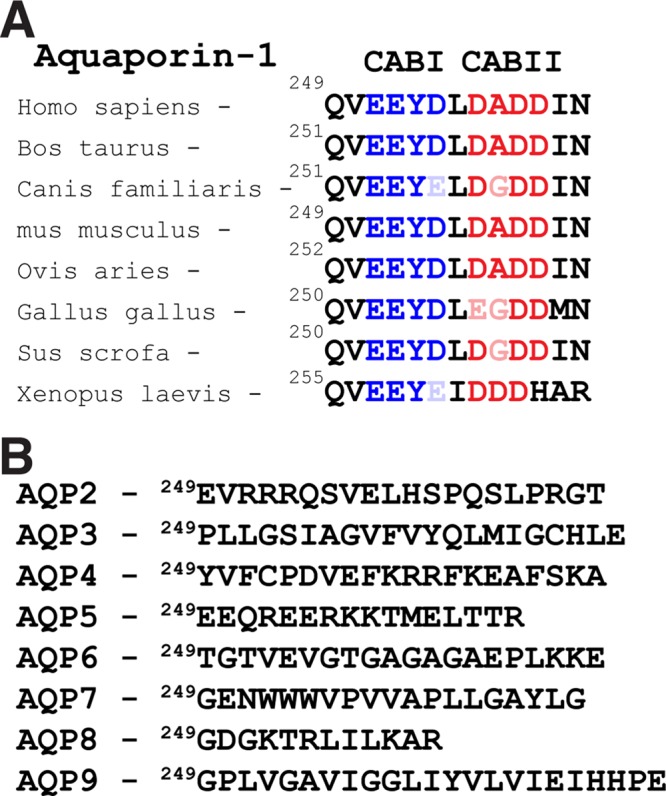
The cytosolic C- terminus of AQP1 has two CAII binding motifs. Examination of the human AQP1 amino acid sequence identified two consensus carbonic anhydrase binding (CAB) sites in the cytosolic C-terminus. (A) Sequence alignment of the CABs found in AQP1 genes in the indicated species. CAB1 is depicted in blue and CABII in red throughout. (B) Comparison of the same region of the other aquaporins does not reveal this motif.
AQP1 is coexpressed in proximal tubular brush border membranes with CAII
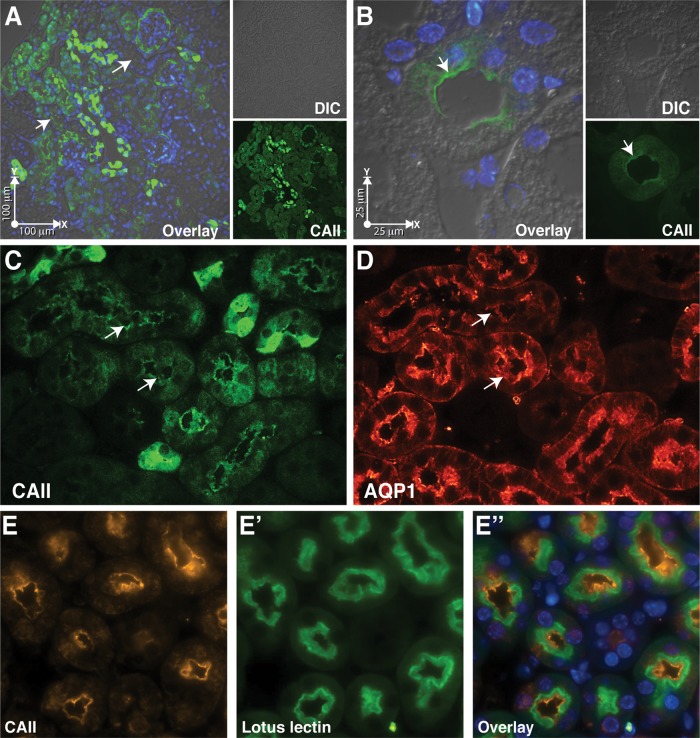
To assess the possibility of an intrarenal interaction between CAII and AQP1, we examined the localization of CAII in the kidney. Murine renal sections immune stained with an anti-CAII antibody revealed strong cortical staining in tubular epithelial cells lacking a predominant brush border, consistent with cortical collecting duct localization. Fainter cortical staining was apparent in most of the remaining tubules, consistent with the morphology of the proximal tubule (Figure 2A). Closer examination of the weaker cortical tubular epithelial cell staining revealed predominant brush border expression of CAII (Figure 2B), a location where AQP1 is expressed (Nielsen et al., 1993; Zhang et al., 1993). To assess whether the two proteins were in the same subcellular domain, we immune stained serial sections for AQP1 and CAII (Figure 2, C and D). Predominant AQP1 and CAII staining was observed at the brush border membrane. The CAII brush border membrane staining was specific, as no signal was observed when sections from CAII-deficient mice were immune stained (Supplemental Figure S1). Finally, to confirm proximal tubular localization of CAII, we coimmunostained murine renal sections with anti-CAII antibody and Lotus tetragonolobus lectin, a proximal tubule marker (Faraggiana et al., 1982). This demonstrated significant overlap in staining (Figure 2, E–E′′). These findings are consistent with AQP1 and CAII brush border colocalization.
FIGURE 2:
CAII and AQP1 colocalize in mouse proximal tubular brush border membrane. (A, B) A kidney section immunostained for CAII (green) and with the nuclear stain 4′,6-diamidino-2-phenylindole. (A) A low-power cortical image, with arrows pointing to proximal tubular staining. (B) A high-power image with an arrow pointing to the brush border. Individual channels are displayed at both high and low power. (C, D) Serial sections immunostained for (C) CAII) and (D) AQP1. (E–E′′) Image of the renal cortex, immunostained for CAII E and with a proximal tubular marker, L. tetragonolobus lectin (E′). An overlay of the two channels is presented in E′′.
Expression of CAII increases water flux through AQP1 in oocytes
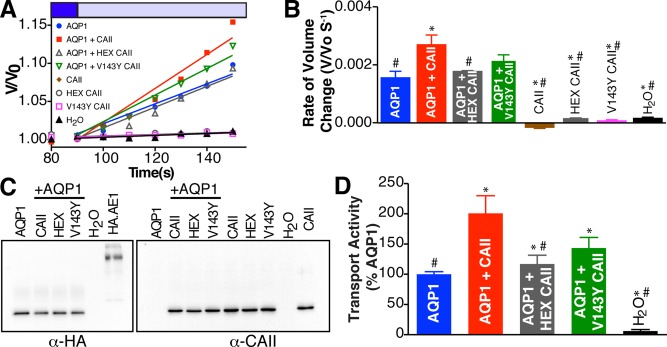
To investigate the effect of CAII on AQP1 function, we measured cell volume changes imposed by a hypotonic challenge in Xenopus laevis oocytes expressing AQP1 alone or coexpressing the water channel and either CAII, a CAII mutant unable to bind AE1 (HEX-CAII; Vince and Reithmeier, 2000), or a catalytically inactive CAII mutant (V143Y-CAII; Fierke et al., 1991). Water flux driven by an osmotic gradient, which is therefore uncoupled from solute transport, was induced by varying the concentration of the membrane-impermeant solute mannitol without otherwise changing medium composition. Oocytes were incubated in an isotonic medium of 220 mOsmol/l and then changed to the same medium but made to 100 mOsmol/l by reducing the concentration of mannitol. Cell swelling was determined by calculating oocyte volumes via time-lapse videomicroscopy of oocyte diameter (Figure 3A and Supplemental Figure S3). The rate of oocyte volume change was then calculated by linear regression of the first 60 s after exposure of the oocyte to hypotonic medium (Figure 3B). AQP1 and CAII expression in the assayed oocytes was determined by densitometry of immunoblots (Figure 3C). Addition of a lane containing a known concentration of AE1 with a hemagglutinin (HA) tag permitted the deduction of the molar amount of AQP1 per oocyte, as the AQP1 construct used contains a C-terminal HA epitope tag. Subsequently, using the rate of volume change and the quantity of AQP1 per oocyte, we calculated the unitary permeation rates of AQP1.
FIGURE 3:
CAII expression increases water flux through AQP in Xenopus oocytes. (A) Oocytes injected with the indicated cRNAs were perfused alternately with isotonic (dark blue bar) and hypotonic (light blue bar) buffers. Oocyte volume was calculated from images captured digitally every 10 s and is plotted as fraction of initial volume (V/V0). Representative traces are displayed. (B) Oocyte swelling rate determined by linear regression of data from A over the first 60 s after switching to hypotonic perfusion buffer. (C) After cell-swelling assays, membrane lysates were prepared, and 50 μg of protein along with 4.8 ng of HA-tagged AE1 or 20 ng of CAII standard was probed on immunoblots with anti-HA or anti-CAII antibodies. Densitometry of the immunoblots was used to calculate the number of AQP1 and CAII molecules present per oocyte. (D) Swelling rates and the number of HA-tagged AQP1 molecules per oocyte were used to calculate AQP1 transport activity (number of water molecules permeated by a single AQP1 monomer per second). Transport activity values for each condition are expressed as percentage of AQP1 activity alone. Bars represent mean ± SEM from three separate experiments with 10 oocytes/assay. Asterisk represents a statistically significant difference (p < 0.05) compared with AQP1, and number sign (#) represents a statistically significant difference from AQP1 + CAII.
Immunostaining and confocal microscopy of permeabilized oocytes expressing AQP1 and CAII demonstrate predominant membrane expression of AQP1, and significant colocalization with CAII at the plasma membrane (Supplemental Figure S2). Coexpression of CAII significantly increased the activity of AQP1 compared with oocytes expressing AQP1 alone (Figure 3D). Coexpression of AQP1 with HEX-CAII did not increase AQP1 activity to the same extent as with wild-type (WT) CAII and was not statistically different from AQP1 alone. Coexpression of AQP1 with V143Y-CAII increased AQP1 activity but to a reduced extent compared with WT-CAII. Consequently binding of CAII to AQP1 is necessary to augment water flux through AQP1 mediated by CAII, and the maximal increase in water flux through AQP1 also requires CAII activity. Finally, we expressed AQP2 alone or with CAII in oocytes and failed to observe an increase in water flux (Supplemental Figure S4), consistent with an isoform-specific effect of CAII on water channel permeation.
CAII increases water flux through AQP1 in kidney cells
To examine the effects of CAII on AQP1-mediated water permeation in a mammalian renal cell, we performed additional experiments in HEK293 cells (Figure 4). Cells were cotransfected with enhanced green fluorescent protein (eGFP) and combinations of AQP1 with WT-CAII, V143Y-CAII, or HEX-CAII or vector alone. We used the dilution of cytosolic eGFP fluorescence in a region of interest of an optical slice measured by confocal microscopy as an index of cell volume changes after cells were shifted to a hypotonic medium (Figure 4A). The cytosolic concentration of eGFP is inversely proportional to cell volume, and the rate of change of eGFP concentration is a surrogate for the rate of volume change. The rate of cell volume change is directly proportional to the amount of AQP1 expressed in this assay over the range of DNA transfected (Supplemental Figure S5).
FIGURE 4:
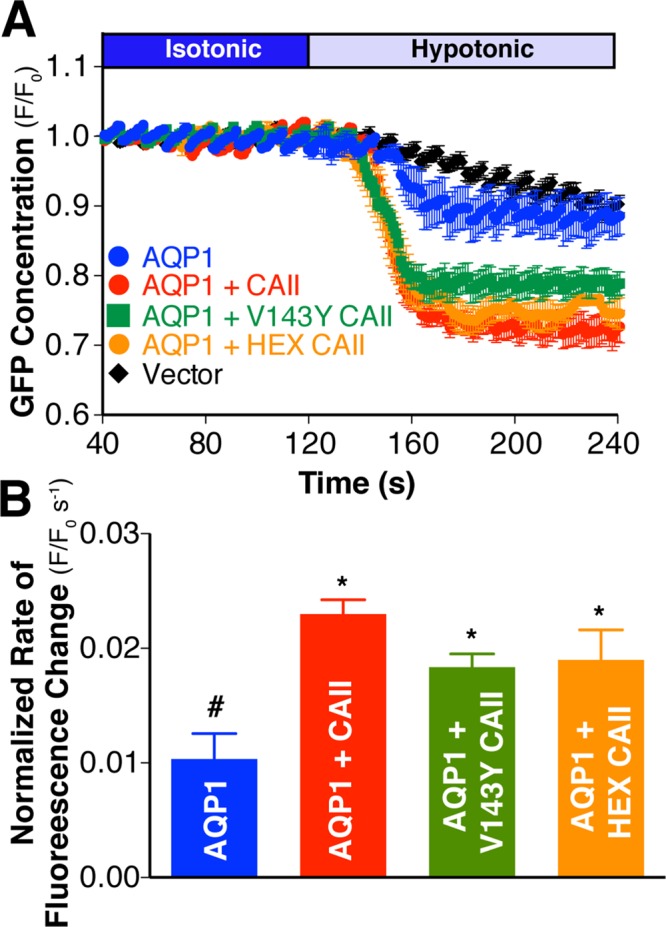
CAII expression increases water flux through AQP1 expressed in HEK293 cells. (A) AQP1 water transport activity was measured by confocal fluorescence microscopy on transfected HEK293 cells. Cells were perfused alternately with isotonic (dark blue bar) and hypotonic (light blue bar) medium, and GFP fluorescence was quantified digitally. GFP concentration as assessed by fluorescence in a representative region of interest (ROI) normalized to initial fluorescence in that ROI (F/F0) is plotted vs. time. (B) Rate of fluorescence change corrected for activity of vector-transfected cells and normalized to AQP1 cell surface expression. Cell surface expression was determined by biotinylation and is presented in Supplemental Figure S7. Asterisk represents a statistically significant difference (p < 0.05) compared with AQP1, and number sign (#) represents a statistically significant difference from AQP1 + CAII.
The rate of cell volume change of HEK293 cells expressing AQP1 alone was significantly greater than for cells expressing CAII, V143Y-CAII, HEX-CAII, or empty vector alone (Supplemental Figure S6). To account for possible differences in the abundance of AQP1 at the plasma membrane due to coexpression of CAII, we normalized the data to the cell surface expression of AQP1 as determined by cell surface biotinylation (Supplemental Figure S7). The rate of fluorescence change (normalized to the activity of vector transfected cells) of cells cotransfected with AQP1 and CAII was significantly higher than that of cells transfected with AQP1 alone (Figure 4B). The normalized rate of fluorescence change of cells expressing AQP1 and either V143Y-CAII or HEX-CAII was significantly greater than that of cells expressing AQP1 alone. Although the increase in water flux induced by coexpression of the CAII mutants was lower in magnitude than for WT-CAII, there was no statistically significant difference between the rate of fluorescence change of AQP1/CAII and either AQP1/V143Y-CAII– or AQP1/HEX-CAII–transfected cells, likely due to endogenous CAII activity in this model system. Consistent with this hypothesis, coexpression of AQP1 with the CAII mutant TS4, which demonstrates increased carbonic anhydrase catalytic activity (Fisher et al., 2012), further increased AQP1- mediated water permeation (Supplemental Figure S8). Moreover, coexpression of AQP2 with CAII failed to augment water flux beyond that of AQP2 alone (Figure 5). The combined oocyte and mammalian cell swelling data suggest that a physical interaction between CAII and AQP1 increases AQP1-mediated water-flux.
FIGURE 5:
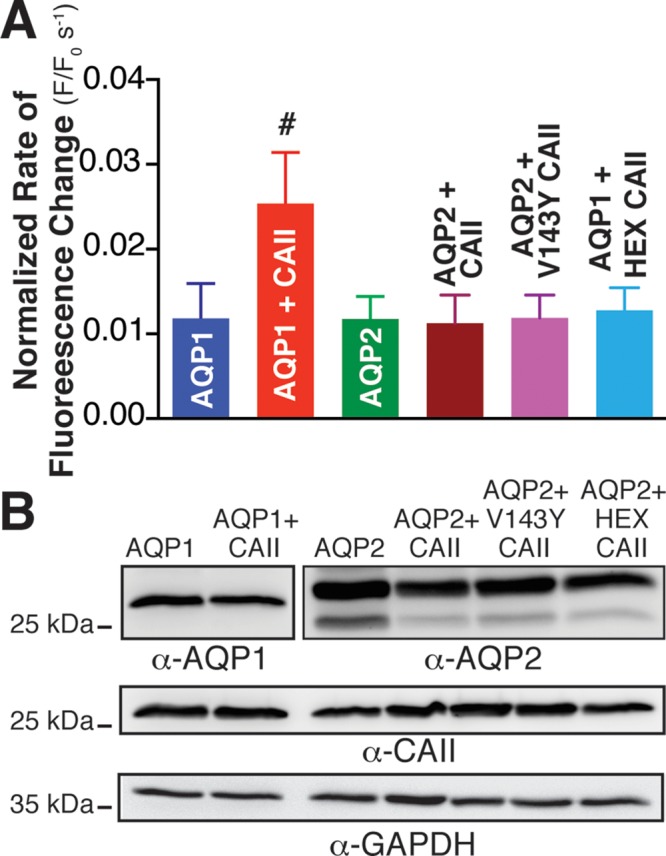
CAII expression does not increase water flux through AQP2 expressed in HEK293 cells. Aquaporin-mediated (AQP1 and AQP2) water transport activity was measured by confocal fluorescence microscopy of transfected HEK293 cells as per Figure 4. (A) Rate of fluorescence change corrected for activity of vector-transfected cells and normalized to AQP1 or AQP2 cell surface expression. Cell surface expression was determined by biotinylation and is presented in Supplemental Figure S7. Number sign (#) represents a statistically significant difference (p < 0.05) compared with AQP1; n > 3 per condition. (B) Immunoblots demonstrating total cellular expression of AQP1, AQP2, CAII, and glyceraldehyde-3-phosphate dehydrogenase (GAPDH).
CAII binds to the acidic motifs in the tail of AQP1
To assess a possible direct physical interaction between CAII and the cytosolic C-terminus of AQP1, we prepared an array of synthetic 15 amino acid peptides corresponding to sequential overlapping sequences of the AQP1 C-terminus. After blotting onto derivatized cellulose membranes, the array was incubated with either purified CAII or albumin, after which the membrane was probed with an anti-CAII antibody. Visualization of the membrane revealed clear association of CAII with peptides containing both the EEYD and LDADD motifs (Figure 6). Specificity of the interaction was indicated by the failure of albumin to show immunoreactivity. These data support a direct physical interaction between CAII and the acidic motifs in the AQP1 C-terminus.
FIGURE 6:
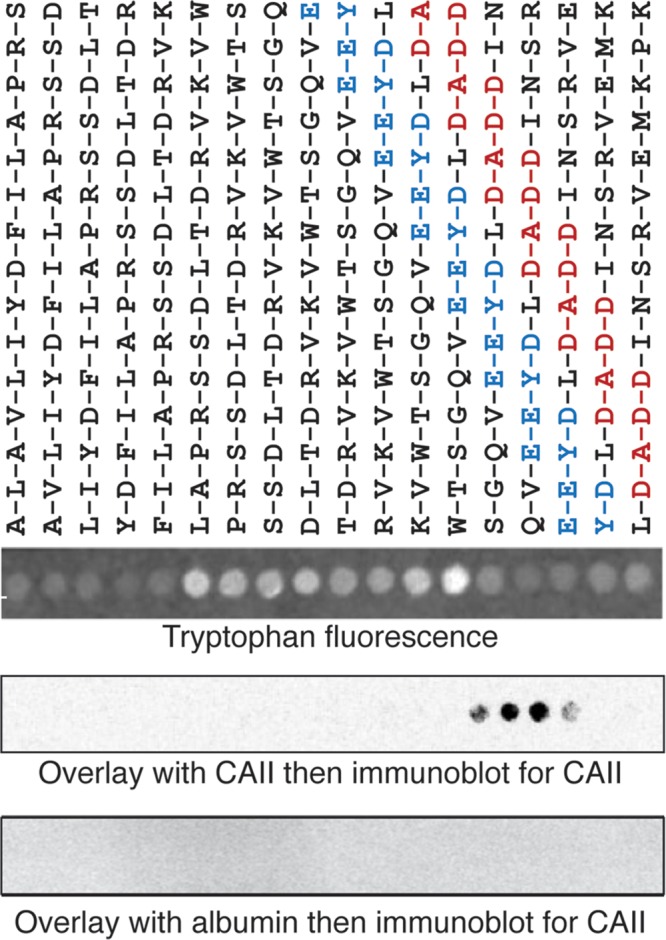
CAII interacts with the acidic clusters in the C-terminus of AQP1 by peptide overlay assay. Fifteen–amino acid peptides corresponding to overlapping progressively more C-terminal sequences in AQP1 were spotted onto cellulose membranes and visualized with ultraviolet fluorescence (tryptophan fluorescence). The exact peptide sequence is detailed above the blot. Recombinant CAII or albumin was incubated with the membrane before a primary anti-CAII antibody, followed by the appropriate secondary antibody and then visualization. Representative overlays from three separate experiments.
AQP1 and CAII associate in mammalian cells
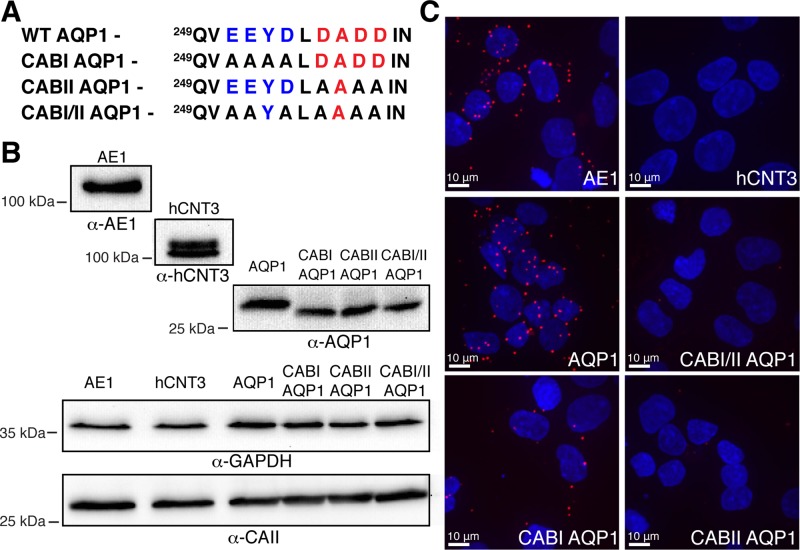
To further delineate the molecular details of the interaction between AQP1 and CAII, we engineered AQP1 mutants in which the two CAB motifs were individually or doubly mutated to alanine (AQP1-CABI, AQP1-CABII, and AQP1-CABI/II, respectively; Figure 7A). These constructs were transfected into HEK293 cells, and the association between these proteins and endogenous CAII was assessed by in situ proximity ligation assays (PLAs; Soderberg et al., 2006). The in situ PLA permits the binding of a red fluorophore if the two target antigens, detected with antibodies, are within 40 nm of one another (Soderberg et al., 2006). AE1, which associates with CAII (Vince and Reithmeier, 1998, 2000), and the human nucleoside transport protein hCNT3 were used as positive and negative controls, respectively. Confocal microscopy analysis of AE1-transfected cells processed for in situ PLA revealed a significant fluorescent signal, confirming a close physical association of AE1 and CAII (Figure 7C). In contrast, when the interaction between hCNT3 and CAII was investigated, no proximity signal was detected (Figure 7C) despite significant expression of hCNT3 and CAII (Figure 7C and Supplemental Figure S9). AQP1-transfected cells processed for in situ PLA produced a significant fluorescence signal, consistent with close physical association of AQP1 and CAII (Figure 7C). We observed a fluorescence signal in cells transfected with AQP1-CABI and CAII but less than for wild-type AQP1–transfected cells. We were unable to detect a significant proximity signal in cells expressing either AQP1-CABII or AQP1-CABI/II (Figure 7C). We confirmed expression of the transfected proteins as well as CAII by analyzing the remnant of the cells used for the assay by immunoblot (Figure 7B). These results suggest that AQP1 and CAII interact and that CABII of AQP1 is most responsible for this. The reduced number of amplification foci in AQP1-CABI compared with WT-AQP1 suggests that this region also contributes to the association of CAII with AQP1.
FIGURE 7:
AQP1 and CAII are in close proximity. (A) The CAB mutants generated. The CAB1 motif is in blue, and the CABII motif is in red. (B) Immunoblots of cell lysates from transfections used in the proximity ligation assays. The primary antibody used is depicted under the blot, and the cDNA transfected is displayed in bold above the blot. GAPDH was probed as a loading control. (C) Cells transfected with the indicated cDNAs were processed in a proximity ligation assay, using an anti-CAII antibody in each case, along with anti-AE1 (AE1), anti-AQP1 (AQP1, CAB1AQP1, CABIIAQP1, CABI/IIAQP1), or anti-hCNT3 (hCNT3).
CABI and CABII are required to increase the water conductance of AQP1
We next compared the ability of AQP1 CAB mutants to induce cell swelling upon hypotonic challenge in HEK293 cells (Figure 8). Cells coexpressing CABI-AQP1 and CAII had a significantly increased swelling rate compared with cells transfected with empty vector or AQP1 alone (Figure 8B). This rate of cell swelling was not statistically different from that of AQP1- and CAII-expressing cells (Figure 8B). In contrast, when CABII-AQP1 or CABI/CABII-AQP1 mutants were coexpressed with CAII, cell-swelling rates were not different from that of cells expressing AQP1 alone (Figure 8B). These results did not arise from differences in the expression of the AQP1 constructs, as they were normalized to cell surface AQP1 abundance, which was determined by cell surface biotinylation (Supplemental Figure S7). These data are consistent with the PLA data, supporting a predominant role for CABII in localizing CAII to AQP1 and in augmenting water flux through it.
FIGURE 8:
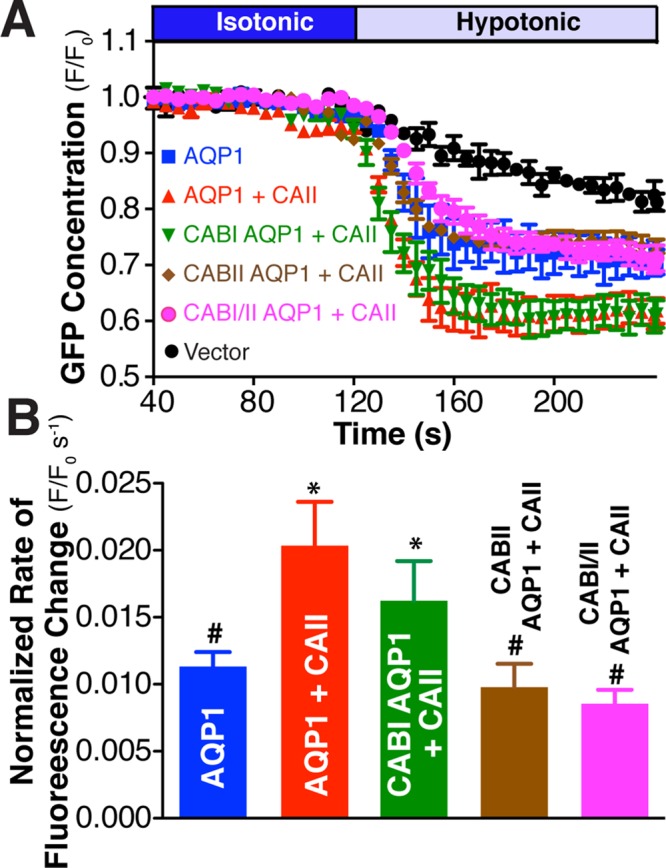
CABII is necessary to mediate increased water flux through AQP1 by CAII. AQP1 Water transport activity was measured by confocal fluorescence microscopy of HEK293 cells transfected with AQP1 CAB mutants in the presence and absence of CAII. (A) Cells were perfused initially with isotonic (dark blue bar) and then hypotonic (light blue bar) medium, and eGFP fluorescence was recorded. eGFP concentration as assessed by fluorescence in a representative ROI normalized to initial fluorescence in that ROI (F/F0) is plotted vs. time. The constructs transfected are indicated on the left side of the curves. (B) Rate of fluorescence change corrected for activity of vector-transfected cells and normalized to AQP1 amount at the cell surface. Cell surface expression was determined by biotinylation and is presented in Supplemental Figure S7. Asterisk represents a statistically significant difference (p < 0.05) compared with AQP1, and number sign (#) represents a statistically significant difference from AQP1 + CAII.
CAII increases water permeability of red blood cell ghosts
We next measured water permeability of mouse red blood cell ghosts resealed in the presence of 250 μM CAII or bovine serum albumin (BSA). This provides a 50-fold molar excess of CAII per AQP1 (given that wild-type mice have a red blood cell volume of 90 × 10−15 l and that red blood cells contain 200 × 103 AQP1 molecules/cell; Anstee, 2011). Immunoblots of ghost lysates resealed in the absence of added CAII demonstrate the nominal absence of CAII from the ghosts (Figure 9A). To assess whether CAII was occluded in the red cell ghosts, we treated ghosts with trypsin in the presence or absence of the detergent Triton X-100. Ghost lysis with detergent was required for CAII digestion (Figure 9B). These data support the presence of CAII inside ghosts, where it is available to interact with the cytosolic C-terminus of AQP1. Finally, we measured water permeability across ghosts supplemented with BSA or CAII and found a near doubling of osmotic water permeability (Pf) in the ghosts supplemented with CAII relative to BSA supplementation (Figure 9, C and D). These results are consistent with a role of CAII in increasing water conduction through AQP1 in red blood cell membranes.
FIGURE 9:
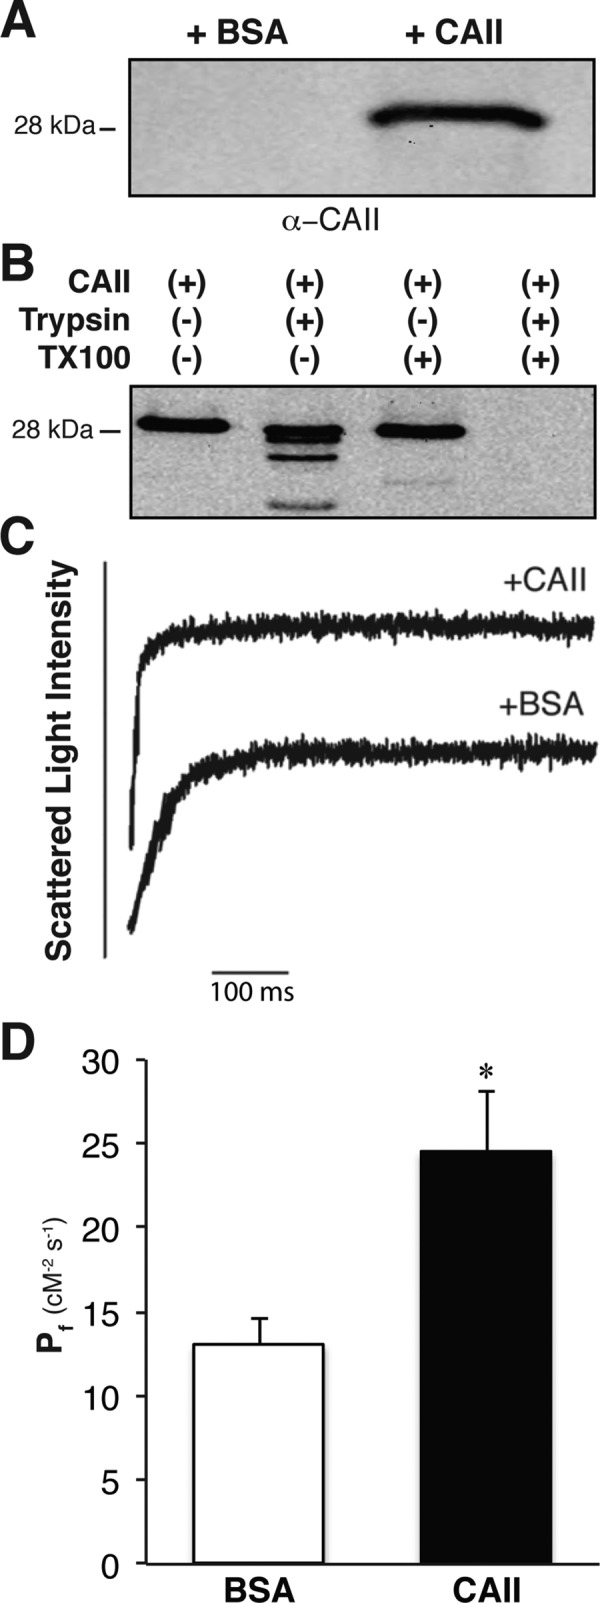
CAII increases the water permeability of red blood cell ghosts. (A) Immunoblot of ghost lysate resealed in the presence of BSA or CAII and probed with anti-CAII. (B) Immunoblot of ghost lysate resealed in the presence of CAII and treated with trypsin, Triton X-100, or both. (C) Representative light scattering traces from red blood cell ghosts supplemented with BSA or CAII. (D) Coefficient of osmotic water permeability (Pf) of red blood cell ghosts supplemented with bovine serum albumin or CAII. Asterisk represents a statistically significant difference (p < 0.05) compared with BSA-supplemented sample.
Water flux across renal cortical membranes of CAII-deficient mice is increased despite decreased AQ1 expression
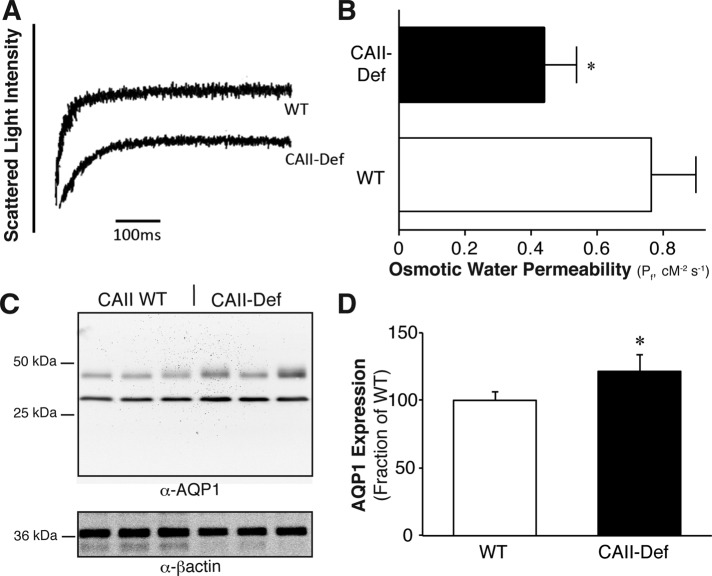
To evaluate the physiological relevance of the interaction between AQP1 and CAII, we compared the Pf of renal cortical membrane–enriched vesicles from wild-type and CAII-deficient mice. Vesicles from wild-type and CAII-deficient mice were not different in size. Vesicles generated from renal cortical membranes of wild-type animals swelled at approximately twice the rate of those generated from CAII-deficient mice (Figure 10, A and B). This did not arise from a difference in the amount of AQP1 in the membrane fraction, as there was increased AQP1 expression in cortical membranes isolated from CAII-deficient mice (Figure 10, C and D). These results are consistent with CAII increasing the flow of water through AQP1 in the proximal tubule.
FIGURE 10:
CAII-deficient cortical kidney membrane vesicles have reduced water permeability. (A) Representative traces of the light scattering induced by renal cortical membranes from WT and CAII-deficient mice. (B) Osmotic water permeability of kidney cortical membrane vesicles prepared from WT and CAII-deficient mice. (C) Representative immunoblots of cortical kidney membranes isolated from six WT and six CAII-deficient (CAII-def) mice probed for AQP1 and β-actin. (D) Quantification of AQP1 membrane expression normalized to β-actin. Asterisk represents a statistically significant difference (p < 0.05) compared with WT.
DISCUSSION
Data presented here support a physical and functional interaction between CAII and AQP1. The cytosolic C-terminus of AQP1 has two potential CAII binding sites, one of which is identical to AE1's CAII binding region, LDADD. Coexpression studies with AQP1 and CAII in oocytes and a mammalian cell line demonstrate that CAII enhances water permeation through AQP1. CAII did not increase water permeation through AQP2 in either model system. For CAII to increase water conductance through AQP1, both the AE1 binding region of CAII and the second CAB in AQP1 are essential. PLAs revealed that CAII and AQP1 associate closely in kidney cells and that this association requires an intact CABII in AQP1. Water permeability studies on red blood cell ghosts found increased water flux when the ghosts were resealed in the presence of CAII. Water flux across renal cortical membrane vesicles from CAII-deficient mice was greatly reduced relative to vesicles derived from wild-type animals, implying reduced water flux across the proximal tubule of CAII-deficient mice despite higher AQP1 expression. Taken together, these studies identify CAII as an enhancer of water conductance through AQP1.
How might CAII increase water flux through AQP1? A physical association is required, as mutation of the potential binding site in CAII or the potential binding sites in AQP1 significantly attenuated the increased water flux through AQP1 mediated by wild-type CAII. Moreover, elimination of CABII from the cytosolic C-terminus of CAII not only eliminated the increased water conductance through AQP1 mediated by coexpression with CAII, it also prevented the close association of these two proteins as assessed by a proximity ligation assay. Of importance, these studies do not demonstrate a direct interaction between AQP1 and CAII, as another molecule may contribute to this complex. However, the peptide overlay assay data does support a direct interaction.
The interaction between CAII and other membrane transport proteins increases the transport rate via a mechanism that requires CAII activity. It appears that this is also the case with the interaction between CAII and AQP1, at least in oocytes, since the expression of AQP1 with catalytically inactive V143Y-CAII attenuated the increased flux of water through AQP1 mediated by wild-type CAII. Under these conditions, the proximity of CAII to AQP1 would not have been altered. How CAII activity increases water flux through AQP1 is uncertain. CAII has been proposed to form linear arrays out from the cytosolic face of MCT1 that serve to shuttle protons away from the surface of the transporter (Becker and Deitmer, 2008). In so doing, CAII reduces the local concentration of a substrate of the transporter. This in turn would increase the concentration gradient and consequently the driving force for proton flux through MCT1. Perhaps a similar phenomenon occurs with AQP1 and CAII, but instead of a proton shuttle, water is rapidly funneled away from AQP1 so as to create a larger concentration gradient for it.
We focused on the interaction of CAII and AQP1 in the proximal tubule of the kidney. We did so because this is the site of the greatest amount of water flux in the body and consequently where increased water flux through AQP1 would be most beneficial. AQP1 and CAII are also expressed in red blood cells. Of interest, the Cl−/HCO3− exchanger AE1 is also abundant in red blood cells, where its transport activity is increased by CAII interaction (Li et al., 2002). Our experiments on red blood cell ghosts imply an interaction between CAII and AQP1 in red blood cells. This would be beneficial to the efficient removal of protons from peripheral muscles as well as CO2. Moreover, this interaction would also facilitate the movement of water and CO2 into alveoli during respiration, potentially increasing the efficiency of respiration. There is an approximate fivefold excess of CAII in red blood cells relative to AQP1, supporting the possibility of this interaction in vivo (Tashian and Carter, 1976; Anstee, 2011).
Acetazolamide is a diuretic that is predominantly prescribed for the prevention of altitude sickness (Low et al., 2012; Bartsch and Swenson, 2013). Acetazolamide causes both a diuresis and a mild metabolic acidosis with compensatory tachypnea. In the renal proximal tubule, sodium reabsorption requires the exchange of a luminal Na+ for a cytosolic H+ via NHE3. The cytosolic H+ is provided by the catalysis of H2O and CO2 into H+ and HCO3− by CAII. Inhibition of CAII would decrease the substrate available for NHE3, the proximal tubular sodium–proton exchanger, thereby decreasing sodium absorption from the proximal tubule and consequently inducing a natriuresis. The utility of this inhibition to induce a diuresis is limited by tubuloglomerular feedback. Acetazolamide also blocks water flux through AQP1 directly (Ma et al., 2004; Gao et al., 2006). This could also induce a diuresis. Our findings support a further role for CAII activity in mediating water flux through AQP1. The attenuated water flux across the proximal tubule arising from CAII inhibition might also contribute to the diuresis caused by acetazolamide.
Our observation that CAII increases water flux through AQP1 is not the first suggestion that flux through the channel might be regulated. Increased cGMP increases both water flux and ion permeation through AQP1 (Boassa and Yool, 2002). Direct phosphorylation of the cytosolic AQP1 C-terminus by protein kinase C also increases water flux through AQP1 (Zhang et al., 2007). Of interest, hypotonic stimuli rapidly translocate endomembrane AQP1 to the plasma membrane, an effect mediated by increased intracellular Ca2+ (Conner et al., 2012). Our findings therefore contribute to the growing body of literature suggesting that water flow through AQP1 might not be static but instead is potentially dynamically regulated.
AQP1 mediates water flux across the capillary endothelium, playing a significant role in ultrafiltration during peritoneal dialysis. Ultrafiltration failure is a common reason for discontinuing peritoneal dialysis and switching to hemodialysis (Kawaguchi et al., 1997). The design of a small molecule that binds to the DADD motif could increase water flux through AQP1 in peritoneal mesothelium, increasing ultrafiltration during peritoneal dialysis. A recent report describes how another small molecule, AqF026, increases water flux by 20% through AQP1 by binding to a separate site of AQP1, the D loop (Yool et al., 2013). Given the data presented here, a molecule occupying the DADD motif would be predicted to have a similar if not larger effect on water flux through AQP1.
In conclusion, we demonstrate that CAII augments water conductance through AQP1 in both oocytes and a mammalian cell culture model. Moreover, the two proteins closely associate with one another in cell culture and colocalize at the brush border membrane of the renal proximal tubule. Maximal water flux through AQP1 requires both CAII activity and the proposed interaction motifs of both AQP1 and CAII. Supplementation with CAII increases water permeability of red blood cell ghosts. The absence of CAII in vivo results in decreased water flux across brush border membrane vesicles from CAII-deficient mice. A CAII-AQP1 interaction likely permits the maximal reabsorption of water from the proximal tubule and may potentially be manipulated to cause a diuresis or increase ultrafiltration in peritoneal dialysis patients.
MATERIALS AND METHODS
DMEM, fetal bovine serum, calf serum, and penicillin-streptomycin-glutamine (PSG) were from Invitrogen (Carlsbad, CA). Cell culture dishes were from Corning (Corning, NY). Complete Protease Inhibitor was from Roche Applied Science (Indianapolis, IN). The BCA Protein Assay Kit and Immobilized Streptavidin Resin were from Pierce (Rockford, IL). Monoclonal antibodies against HA (clone 16B12) were from Covance (Princeton, NJ). Antibodies against AQP1, CAII, and the Na+/K+-ATPase were from Santa Cruz Biotechnology (Santa Cruz, CA). The IVF12 monoclonal anti-AE1 antibody was a kind gift from Michael Jennings (University of Arkansas, Little Rock, AR), and the anti-hCNT3 antibody was a kind gift of James Young (University of Alberta, Edmonton, Canada; Zhang et al., 2006). Secondary coupled Alexa Fluor 488 and DyLight 549 antibodies were from Jackson ImmunoResearch Laboratories (West Grove, PA). The fluorescein-conjugated L. tetragonolobus lectin was from Vector Laboratories (Burlingame, CA). Horseradish peroxidase (HRP)–conjugated donkey anti-mouse immunoglobulin G was from GE Healthcare Bio-Sciences (Piscataway, NJ). The Duolink proximity ligation assay kit was from Olink Bioscience (Uppsala, Sweden).
Animal studies
Wild-type FVB/N mice were purchased from Jackson Laboratories (Bar Harbor, ME). Generation and genotyping of wild-type and the CAII-deficient mice were performed as described previously (Brown et al., 2012). Mice were housed in virus-free conditions and maintained on a 12-h light/dark schedule. Standard pelleted chow (PicoLab Rodent Diet 5053; 20% [wt/wt] protein, 4.5% [wt/wt] fat, 0.81% [wt/wt] calcium, 1.07% [wt/wt] potassium, 0.30% [wt/wt] sodium; and 2.2 IU/g vitamin D3) and drinking water were available ad libitum. Both male and female animals between 8 and 14 wk of age were used. The animals were anesthetized with pentobarbital, and blood was withdrawn by perforating the orbital vessels. Kidneys were then removed and snap frozen in liquid nitrogen, and 3-μm sections were processed and stained as described previously (Pan et al., 2012). All experiments were performed in compliance with the animal ethics board at the University of Alberta, Health Sciences Section, protocol number 576.
DNA cloning
X. laevis pGEMHE expression vectors containing cDNA coding for human wild-type and V143Y (catalytically inactive mutant) and HEX (catalytically active mutant, containing six point mutations—H3P, H4D, K9D, H10K, H15Q, and H17S—that prevent CAII binding to AE1) CAII mutants were generous gifts from Joachim Deitmer (Technische Universität Kaiserslautern, Kaiserslautern, Germany; Becker and Deitmer, 2007). AQP1 was incorporated into pGEMHE by PCR-based subcloning using the primers 5′-GCCCCGGGATGTACCCCTACGACGTGCCCGACTACGCCGGGTACGCCGCCAGCGAGTTCAAGAAG-3′ and 5′-CGCCCGCGGAGCCAAAGGACCGAGCAG-3′ containing unique XmaI and BtgI restriction sites, respectively. AQP2 in mammalian and oocyte expression vectors were a kind gift of Peter Deen (Radboud University, Nijmegen, Netherlands).
Preparation of mammalian expression constructs.
An untagged version of human AQP1 was generated by PCR and cloned into the pcDNA 3.1(-) mammalian expression vector using the primers 5′-CGGGATCCGACCATGGCCAGCGAGTTCAAGAAGA-3′ and 5′-CCCTCGAGCTATTTGGGCTTCATCTCCAC-3′ containing the cloning restriction sites BamHI and XhoI, respectively. Wild-type, V143Y, and HEX CAII were amplified by PCR using the appropriate X. laevis pGEMHE expression vectors as template and cloned in pcDNA3.1(-) mammalian expression vector. Amplification of wild-type and V143Y cDNA fragments was performed using the primers 5′-CGGAATTCGCCACCATGTCCCATCACTGGGGGTA-3′ and 5′-GGGGTACCTTATTTGAAGGAAGCTTTGATTTGC-3′ containing the cloning restriction sites EcoRI and KpnI, respectively. HEX-CAII was amplified using the forward 5′-CGGCTAGCGCCACCATGTCCCCTCAGTGGGGGTA-3′ and reverse 5′-GCTCTAGATTATTTGAAGGAAGCTTTGATTTGC-3′ primers containing an NheI and a XbaI site, respectively. TS4 CAII, which demonstrates increased catalytic activity, was a kind gift of Robert McKenna (University of Florida, Gainesville, FL; Fisher et al., 2012). This mutant was subcloned into pcDNA 3.1(-) by PCR using the forward primer 5′-CTAGCTAGCATGTCCCATCACTGG-3′, which contains an NheI site, and the reverse primer 5′-CTAGCTCGAGTTATTTGAAGGAAGCTTT-3′, which contains an XhoI site.
Preparation of ∆CABI and ∆CABII AQP1 mutants.
Two AQP1 mutants in which either the CAII binding motif I (CABI; amino acids E251, E252, Y253, and D254) or CAII binding motif II (CABII, D256, D258, and D259) mutagenized to alanine were generated using the PCR-based QuikChange Lightning Site-Directed Mutagenesis Kit (Stratagene, La Jolla, CA). The reactions were carried out on either mammalian or X. laevis AQP1 expression vectors as template and following the manufacturer's protocol. Mutations were introduced in the AQP1 sequence using two different sets of self-complementary mutagenic primers: 5′-accagcggccaggtggcggcggctgccctggatgccgacgac-3′ (sense ∆CABI) and 5′-gtcgtcggcatccagggcagccgccgccacctggccgctggt-3′ (antisense ∆CABI) or 5′-ggagtatgacctggctgccgccgccatcaactccaggg-3′ (sense ∆CABII) and 5′-ccctggagttgatggcggcggcagccaggtcatactcc-3′ (antisense ∆CABII), respectively. After the amplification step, the original unaltered cDNA templates were digested with DpnI restriction enzyme. The identity and fidelity of all the clones used were confirmed by sequencing.
X. laevis oocyte isolation and maintenance
Adult female X. laevis were obtained from Xenopus One (Ann Arbor, MI), housed in an established frog colony, and fed regular frog brittle twice a week. For the removal of oocytes, frogs were anaesthetized by immersion in 0.5% (wt/vol) tricaine methane-sulfonate/ethyl 3-aminobenzoate methanesulfonate salt (MS222; Sigma-Aldrich, St. Louis, MO) until unresponsive to a painful stimulus. A 1-cm incision was made in the abdominal wall through both skin and muscle layers, and then a lobe of ovary containing oocytes was excised. The wound was closed in two layers, and the animal was allowed to recover from anesthesia. Ovarian follicles were removed and digested by gentle agitation in ND96 solution (96 mM NaCl, 2 mM KCl, 1.8 mM CaCl2, 1 mM MgCl2, 10.0 mM 4-(2-hydroxyethyl)-1-piperazineethanesulfonic acid [HEPES], pH 7.4), containing 2 mg/ml collagenase type 1 (Worthington, Lakewood, NJ) twice, each time for ∼60 min. After digestion, healthy stage VI oocytes were manually selected based upon size and uniformity of color. They were then incubated at 18°C in ND96 solution supplemented with 0.1 mg/ml penicillin and 0.05 mg/ml gentamicin sulfate. These procedures were performed under the approved University of Alberta Animal Ethics protocol (#599/06/10/C).
Protein expression
Oocytes.
Plasmid DNA was linearized by NheI digestion of the polylinker region and used to transcribe RNA in vitro with a T7 RNA polymerase message machine kit (Ambion, Austin, TX) in accordance with the manufacturer's instructions. Twenty-four hours after collagenase digestion, oocytes were reselected and injected with a nanoliter injector (Drummond Scientific, Broomall, PA), using 5 ng of AQP1 mRNA and 5 ng of wild-type or mutant CAII. Oocytes were returned to ND96 solution and incubated at 18°C for 3–4 d before the experiments.
Mammalian cells.
Proteins were expressed by transient transfection of HEK293 cells using the calcium phosphate transfection method (Ruetz et al., 1993). Cells were grown and transfected in DMEM, supplemented with 5% (vol/vol) fetal bovine serum, 5% (vol/vol) calf serum, and 1× PSG and kept in an incubator at 37°C and 5% CO2 saturation. All experiments involving transfected cells were carried out 40–48 h posttransfection.
Membrane water permeability measurements
Oocytes.
Oocytes were preincubated with isotonic transport buffer (in mM: 25 NaHCO3, 14 NaCl, 2.5 KCl, 1 CaCl2, 1 MgCl2, 1 Na2HPO4, 5 HEPES, pH 7.4, adjusted to 220 mOsmol/kg with d-mannitol) for 10 min at room temperature and perfused with hypotonic (100 mOsmol/kg) transport solution, pH 7.4 (same composition as previous, but lacking d-mannitol), and the time course of osmotic volume increase was monitored by videomicroscopy, with images collected every 10 s (Vilas et al., 2013). Both buffers were continuously bubbled with 5% CO2 (balance, air) and adjusted to pH 7.4 with NaOH. Solution osmolarity was assessed with an Advanced Instruments (Norwood, MA) Model 3D3 osmometer. Image-Pro Plus software (MediaCybernetics, Rockville, MD) was used to measure the mean diameter of each oocyte, thereby permitting the calculation of its volume. The relative volume increase responses were plotted as a function of time of exposure to hypotonic buffer. They were fitted with a model-independent second-order polynomial, and the initial rates of swelling, d(V/V0)/dt, were calculated from the linear component of the fit and are presented as mean ± SEM. After each swelling experiment, oocytes were transferred to ice-cold isotonic transport buffer containing protease inhibitors and subsequently lysed in 2% lithium dodecyl sulfate plus protease inhibitors (30 μl/oocyte). Samples were disrupted by pipetting up and down and centrifuged at 1000 × g for 10 min at 4°C to pellet cell debris. The resulting supernatants were frozen until used for immunoblotting. Unitary water permeability was determined as previously (Vilas et al., 2013). To determine unitary water permeability, for each condition used to measure water permeability, membrane lysate from a known number of oocytes expressing AQP1 were immunoblotted against HA (note that the AQP1 construct has a C-terminal HA tag). On the same blot, a known amount of HA-tagged AE1 was also loaded. This permitted the number of moles of AQP1/oocyte to be determined. Finally, d(V/V0)/dt measured under each condition was divided by the number of AQP1 molecules per oocyte to arrive at unitary water permeability.
To evaluate AQP1 and CAII localization, oocytes expressing the constructs were fixed with 3% paraformaldehyde and then permeabilized with the weak detergent Triton X-100 (0.1% in phosphate-buffered saline [PBS]). Next either anti-HA or anti-CAII antibody was applied. Subsequently the appropriate secondary antibodies were applied. Finally the samples were mounted with Dako and visualized with a spinning-disk confocal microscope (WaveFX; Quorum Technologies, Guelph, Canada) set up on an Olympus IX-81 inverted stand (Olympus, Markham, Canada). Images were obtained with an electron-multiplying charge-coupled device (EMCCD) camera (Hamamatsu, Hamamatsu, Japan) driven by Volocity 5.0.3 software (PerkinElmer, Mississauga, Canada). This software was also used to measure pixel density across the image and to determine Pearson's correlation coefficient.
HEK293 cells.
HEK293 cells were grown on poly-l-lysine–coated 25-mm glass coverslips and cotransfected with eGFP and AQP1, wild-type or V143Y CAII, or pcDNA 3.1 (empty vector) in a 1:8 molar ratio (Vilas et al., 2013). Coverslips were mounted in a 35-mm-diameter Attofluor Cell Chamber (Molecular Probes, Eugene, OR). During experiments, the chamber was perfused at 3.5 ml/min with isotonic bicarbonate-buffered MBSS solution (in mM: 68.3 NaCl, 5.4 KCl, 0.4 MgCl2, 0.4 MgSO4, 25 NaHCO3, 2 CaCl2, 5.5 glucose, 100 d-mannitol, 10 HEPES, pH 7.4, 300 mOsm/kg) and then with hypotonic (200 mOsm/kg) bicarbonate-buffered MBSS solution, pH 7.4 (same composition as previous, but lacking d-mannitol). Both buffers were continuously bubbled with 5% CO2 (balance, air) and adjusted to pH 7.4 with NaOH. The chamber was placed on the stage of a Wave FX spinning disc confocal microscope with a Yokogawa CSU10 scanning head. The microscope has a motorized XY stage with piezo focus drive (MS-4000 XYZ Automated Stage; ASI, Eugene, OR). Acquisition was performed with a Hamamatsu C9100-13 digital camera (EMCCD) and a 20× objective (air immersion, numerical aperture 0.75) during excitation with the FiTC/GFP laser (491 nm). eGFP fluorescence data were acquired at 1 point/s. Lasers were from Spectral Applied Research (Richmond Hill, Canada). Quantitative image analysis was performed with Volocity 4.2 software. The dilution in fluorescence within a specific region of interested was recorded and normalized to the original fluorescence in the region of interest within the defined optical section (F/F0). The rate of dilution in fluorescence, a measure of water permeability, was then normalized, first to total cellular AQP1 (or AQP2; setting AQP1/AQP2 expression alone to 100%). Finally, the dilution in fluorescence was then divided by the fraction of AQP1/AQP2 at the membrane (as measured by cell surface biotinylation; Supplemental Figure S6). To validate this assay, we performed it in the presence of increasing amounts of AQP1. This demonstrated a linear relationship between AQP1 expression and normalized dilution of expression (Supplemental Figure S4).
Immunoblotting
Equal amounts of total protein were separated by SDS–PAGE and electrotransferred onto Immobilon-P polyvinylidene fluoride membranes (Millipore, Billerica, MA) for 1 h at a constant current of 400 mA. After transfer, membranes were rinsed in TBS (in mM: 150 NaCl, 50 Tris-HCl, pH 7.5) and incubated with TBS-TM (TBS containing 0.1% [vol/vol] Tween-20 and 5% [wt/vol] skim milk) for 1 h at room temperature with gentle rocking to block nonspecific binding. Membranes were then incubated for 16 h at 4°C with gentle rocking in the presence of either mouse anti-HA, rabbit or goat anti-AQP1, goat anti-AQP2, or rabbit anti-CAII at 1:1000 in TBS-TM. After successive washes with TBS and TBS-T (TBS containing 0.1% [vol/vol] Tween-20), the membranes were incubated with a 1:5000 dilution of the appropriate HRP-conjugated secondary antibody in TBS-TM for 1 h at 20°C and then washed further with TBS and TBS-T. Proteins were detected using Western Lightning Chemiluminescence Reagent Plus (PerkinElmer, Waltham, MA) and visualized using a Kodak Image Station 440CF (Kodak, Rochester, NY). Quantitative densitometric analyses were performed using Kodak Molecular Imaging Software, version 4.0.3.
Peptide spot assay
Peptides 15 amino acids in length corresponding to progressively more C-terminal fragments of the cytosolic C-terminus of AQP1, were synthesized onto cellulose membranes (Hilpert et al., 2007; Schauble et al., 2012). The membranes were blocked for 4 h at room temperature in TBS-TM and then incubated with 40 μg of recombinant CAII (Sigma-Aldrich) or the equivalent molar amount of BSA in TBS-TM overnight at 4°C, respectively. The membranes were then washed with TBS-T before incubation with rabbit anti-CAII at 1:10,000 in TBS-TM, washed, and finally incubated in secondary antibody before visualizing as described.
Proximity ligation assay
HEK293 cells plated in 100-mm dishes containing glass poly-l-lysine–coated coverslips were transfected with cDNAs encoding WT, ∆CABI, ∆CABII, and ∆CAB AQP1, AE1, or hCNT3. Two days posttransfection, coverslips were recovered, and the remaining plated cells were washed with PBS, lysed in IPB buffer (1% NP-40, 5 mM EDTA, 0.15 M NaCl, 0.5% deoxycholate, 10 mM Tris-HCl, pH 7.5) containing protease inhibitors and stored frozen until further use. Coverslips were washed twice in PBS, fixed with 3.5% paraformaldehyde, 1 mM CaCl2, and 1 mM MgCl2 in PBS, pH 7.4, for 20 min, washed twice with PBS, and then quenched with 50 mM NH4Cl for 10 min. Fixed cells were permeabilized with 0.1% Triton X-100 in PBS for 1 min at room temperature and washed twice for 5 min with Wash Buffer A (Olink Bioscience). Samples were then processed for PLA using the Duolink Detection kit (Olink Bioscience), according to the manufacturer's instructions. Briefly, coverslips were blocked with blocking solution for 30 min at 37°C and incubated for 1 h at 37°C in a humidified chamber with a 1:1000 dilution of rabbit anti-CAII antibody and goat anti-AQP1, IVF12 mouse monoclonal anti-AE1, or mouse monoclonal anti-hCNT3 at 1:500, 1:1000, and 1:500 dilutions in antibody diluent, respectively. Samples were then washed twice for 5 min in wash buffer A and then incubated for 1 h at 37°C with a combination of the corresponding PLA probes (anti-rabbit Plus and anti-mouse Minus or anti-goat Minus) conjugated to unique oligonucleotides. The PLA oligonucleotides were hybridized and circularized by ligation (30 min at 37°C), and the formed DNA circle was then amplified by rolling circle amplification into single-stranded DNA anchored to one of the antibodies. The amplification product was detected by addition of complementary oligonucleotides labeled with Texas red fluorophore. Coverslips were mounted in the provided mounting media and observed through a 60×/1.42 PlanApo oil immersion objective. Z-stack confocal image capture was performed with a C9100-13 EMCCD digital camera using Volocity software.
Preparation of red blood cell ghosts and renal cortical membrane vesicles, and stopped-flow light scattering measurement of water permeability
Whole blood was extracted from wild-type FVB/N mice by cardiac puncture. Red blood cells were isolated by centrifugation for 5 min at 5000 rpm. Red blood cells were washed with 0.9% NaCl three times at 4°C. The red blood cells were then lysed by the addition of 5 mM NaPO4, pH 7.4, with protease inhibitor cocktail and 1 mM phenylmethylsulfonyl fluoride. After 10 min, the membranes were pelleted by centrifugation at 27,000 rpm for 20 min at 4°C. The hemolysate was then removed by aspiration and the lysis step repeated until membranes became white (usually thrice more). Ghosts were resealed in the presence of 250 μM recombinant CAII (Sigma-Aldrich) or BSA by incubation in PBS containing 1 mM CaCl2 for 30 min at 37°C. Finally, the resealed ghosts were washed three times with PBS before stopped-flow light scattering was performed.
Renal cortexes from wild-type and CAII-deficient mice were homogenized with a glass/Teflon homogenizer (500 rpm) in ice-cold buffer containing 220 mM mannitol, 70 mM sucrose, 5 mM ethylene glycol tetraacetic acid [EGTA], and 1 mM EDTA, 20 mM Tris-HCl, pH 7.4. Nucleus- and mitochondrion-enriched fractions were removed by centrifugation at 500 × g and 6000 × g for 10 min, respectively. A plasma membrane–enriched fraction was then obtained by centrifugation at 17,000 × g for 1 h at 4°C. The pellet was gently resuspended in homogenization buffer, creating plasma membrane vesicles. The size of vesicles was determined with an N5 Submicron Particle Size Analyzer (Beckman Coulter, Palo Alto, CA) and was not different between genotypes (59.92 ± 3.8 vs. 59.7 ± 2.8 nm).
Osmotic water permeability of renal plasma membrane vesicles and red blood cell ghosts was determined by stopped-flow light scattering, as described previously (Calamita et al., 2008). Briefly, the time course of vesicle volume change was followed at 20°C by changes in intensity of scattered light at the wavelength of 450 nm, using a BioLogic MPS-20 (BioLogic, Claix, France) stopped-flow reaction analyzer with a 1.6-ms dead time and 99% mixing efficiency in <1 ms. Aliquots of vesicles were diluted into a hypotonic (220 mOsm) isolation medium (124 mM mannitol, 70 mM sucrose, 1 mM EDTA, 5 mM EGTA, 20 mM Tris-HCl, pH 7.4). One of the syringes of the stopped-flow apparatus was filled with the vesicle suspension, and the other was filled with the same buffer to which mannitol was added to reach a final osmolarity of 500 mOsm to establish a hypertonic gradient (140 mOsm) upon mixing. The final protein concentration after mixing was 100 μg/ml. Immediately after applying a hypertonic gradient, water outflow occurs and the vesicles shrink, causing an increase in scattered light intensity. The data were fitted to a single-exponential function, and the related rate constant (Ki, in seconds−1) of water efflux was determined. The coefficient of osmotic water permeability (Pf), an index reflecting the osmotic water permeability of the analyzed membranes, was calculated using the equation
 |
where Ki is the fitted exponential rate constant, V0 is the initial mean vesicle volume determined as described, Av is the mean vesicle surface, Vw is the molar volume of water, and ∆C is the osmotic gradient. The medium osmolarity was verified by a vapor-pressure osmometer (Wescor, Logan, UT).
Statistical analysis
Data are presented as means ± SE. Paired or unpaired Student's t tests or analysis of variance were carried out to determine statistical significance as appropriate. Tests were performed using Excel software (Microsoft, Redmond, WA), and values <0.05 were considered statistically significant.
Supplementary Material
ACKNOWLEDGMENTS
This work was funded by grants from the Canadian Institute of Health Research to R.T.A. and J.R.C. and by the Deutsche Forschungsgemeinschaft (IRTG 1830) to R.Z. D.K. is supported by a graduate studentship from the Women and Children's Health Research Institute. S.K.L. and D.M. are supported by graduate studentships from the International Research Training Group in Membrane Biology, which is funded by the Natural Sciences and Engineering Research Council of Canada. R.T.A. is supported by a Clinician Scientist Award from the Canadian Institute of Health Research and an Alberta Innovates Health Solutions Clinical Investigator Award.
Abbreviations used:
- AE
anion exchanger
- AQP1
aqauaporin-1
- CAB
carbonic anhydrase binding
- CAII
carbonic anhydrase II
- MCT
monocarboxylate transporter
- NBC
sodium bicarbonate cotransporter
- NHE
sodium proton exchanger.
Footnotes
This article was published online ahead of print in MBoC in Press (http://www.molbiolcell.org/cgi/doi/10.1091/mbc.E14-03-0812) on January 21, 2015.
*These authors contributed equally to this work.
REFERENCES
- Anstee DJ. The functional importance of blood group-active molecules in human red blood cells. Vox Sang. 2011;100:140–149. doi: 10.1111/j.1423-0410.2010.01388.x. [DOI] [PubMed] [Google Scholar]
- Bartsch P, Swenson ER. Clinical practice: acute high-altitude illnesses. N Engl J Med. 2013;368:2294–2302. doi: 10.1056/NEJMcp1214870. [DOI] [PubMed] [Google Scholar]
- Becker HM, Deitmer JW. Carbonic anhydrase II increases the activity of the human electrogenic Na+/HCO3- cotransporter. J Biol Chem. 2007;282:13508–13521. doi: 10.1074/jbc.M700066200. [DOI] [PubMed] [Google Scholar]
- Becker HM, Deitmer JW. Nonenzymatic proton handling by carbonic anhydrase II during H+-lactate cotransport via monocarboxylate transporter 1. J Biol Chem. 2008;283:21655–21667. doi: 10.1074/jbc.M802134200. [DOI] [PubMed] [Google Scholar]
- Becker HM, Klier M, Deitmer JW. Nonenzymatic augmentation of lactate transport via monocarboxylate transporter isoform 4 by carbonic anhydrase II. J Membr Biol. 2010;234:125–135. doi: 10.1007/s00232-010-9240-y. [DOI] [PubMed] [Google Scholar]
- Boassa D, Yool AJ. A fascinating tail: cGMP activation of aquaporin-1 ion channels. Trends Pharmacol Sci. 2002;23:558–562. doi: 10.1016/s0165-6147(02)02112-0. [DOI] [PubMed] [Google Scholar]
- Brown BF, Quon A, Dyck JR, Casey JR. Carbonic anhydrase II promotes cardiomyocyte hypertrophy. Can J Physiol Pharmacol. 2012;90:1599–1610. doi: 10.1139/y2012-142. [DOI] [PubMed] [Google Scholar]
- Calamita G, Ferri D, Gena P, Carreras FI, Liquori GE, Portincasa P, Marinelli RA, Svelto M. Altered expression and distribution of aquaporin-9 in the liver of rat with obstructive extrahepatic cholestasis. Am J Physiol Gastrointest Liver Physiol. 2008;295:G682–G690. doi: 10.1152/ajpgi.90226.2008. [DOI] [PubMed] [Google Scholar]
- Chou CL, Knepper MA, Hoek AN, Brown D, Yang B, Ma T, Verkman AS. Reduced water permeability and altered ultrastructure in thin descending limb of Henle in aquaporin-1 null mice. J Clin Invest. 1999;103:491–496. doi: 10.1172/JCI5704. [DOI] [PMC free article] [PubMed] [Google Scholar]
- Conner MT, Conner AC, Bland CE, Taylor LH, Brown JE, Parri HR, Bill RM. Rapid aquaporin translocation regulates cellular water flow: mechanism of hypotonicity-induced subcellular localization of aquaporin 1 water channel. J Biol Chem. 2012;287:11516–11525. doi: 10.1074/jbc.M111.329219. [DOI] [PMC free article] [PubMed] [Google Scholar]
- Endeward V, Musa-Aziz R, Cooper GJ, Chen LM, Pelletier MF, Virkki LV, Supuran CT, King LS, Boron WF, Gros G. Evidence that aquaporin 1 is a major pathway for CO2 transport across the human erythrocyte membrane. FASEB J. 2006;20:1974–1981. doi: 10.1096/fj.04-3300com. [DOI] [PubMed] [Google Scholar]
- Fang X, Yang B, Matthay MA, Verkman AS. Evidence against aquaporin-1-dependent CO2 permeability in lung and kidney. J Physiol. 2002;542:63–69. doi: 10.1113/jphysiol.2001.013813. [DOI] [PMC free article] [PubMed] [Google Scholar]
- Faraggiana T, Malchiodi F, Prado A, Churg J. Lectin-peroxidase conjugate reactivity in normal human kidney. J Histochem Cytochem. 1982;30:451–458. doi: 10.1177/30.5.7077075. [DOI] [PubMed] [Google Scholar]
- Fierke CA, Calderone TL, Krebs JF. Functional consequences of engineering the hydrophobic pocket of carbonic anhydrase II. Biochemistry. 1991;30:11054–11063. doi: 10.1021/bi00110a007. [DOI] [PubMed] [Google Scholar]
- Fisher Z, Boone CD, Biswas SM, Venkatakrishnan B, Aggarwal M, Tu C, Agbandje-McKenna M, Silverman D, McKenna R. Kinetic and structural characterization of thermostabilized mutants of human carbonic anhydrase II. Protein Eng Des Sel. 2012;25:347–355. doi: 10.1093/protein/gzs027. [DOI] [PMC free article] [PubMed] [Google Scholar]
- Gao J, Wang X, Chang Y, Zhang J, Song Q, Yu H, Li X. Acetazolamide inhibits osmotic water permeability by interaction with aquaporin-1. Anal Biochem. 2006;350:165–170. doi: 10.1016/j.ab.2006.01.003. [DOI] [PubMed] [Google Scholar]
- Geyer RR, Musa-Aziz R, Qin X, Boron WF. Relative CO2/NH3 selectivities of mammalian aquaporins 0-9. Am J Physiol Cell Physiol. 2013;304:C985–C994. doi: 10.1152/ajpcell.00033.2013. [DOI] [PubMed] [Google Scholar]
- Hilpert K, Winkler DF, Hancock RE. Peptide arrays on cellulose support: SPOT synthesis, a time and cost efficient method for synthesis of large numbers of peptides in a parallel and addressable fashion. Nat Protoc. 2007;2:1333–1349. doi: 10.1038/nprot.2007.160. [DOI] [PubMed] [Google Scholar]
- Kawaguchi Y, Hasegawa T, Nakayama M, Kubo H, Shigematu T. Issues affecting the longevity of the continuous peritoneal dialysis therapy. Kidney Int Suppl. 1997;62:S105–S107. [PubMed] [Google Scholar]
- Li X, Alvarez B, Casey JR, Reithmeier RA, Fliegel L. Carbonic anhydrase II binds to and enhances activity of the Na+/H+ exchanger. J Biol Chem. 2002;277:36085–36091. doi: 10.1074/jbc.M111952200. [DOI] [PubMed] [Google Scholar]
- Li X, Liu Y, Alvarez BV, Casey JR, Fliegel L. A novel carbonic anhydrase II binding site regulates NHE1 activity. Biochemistry. 2006;45:2414–2424. doi: 10.1021/bi051132d. [DOI] [PubMed] [Google Scholar]
- Loiselle FB, Morgan PE, Alvarez BV, Casey JR. Regulation of the human NBC3 Na+/HCO3- cotransporter by carbonic anhydrase II and PKA. Am J Physiol Cell Physiol. 2004;286:C1423–C1433. doi: 10.1152/ajpcell.00382.2003. [DOI] [PubMed] [Google Scholar]
- Lorenz JN, Schultheis PJ, Traynor T, Shull GE, Schnermann J. Micropuncture analysis of single-nephron function in NHE3-deficient mice. Am J Physiol. 1999;277:F447–F453. doi: 10.1152/ajprenal.1999.277.3.F447. [DOI] [PubMed] [Google Scholar]
- Low EV, Avery AJ, Gupta V, Schedlbauer A, Grocott MP. Identifying the lowest effective dose of acetazolamide for the prophylaxis of acute mountain sickness: systematic review and meta-analysis. BMJ. 2012;345:e6779. doi: 10.1136/bmj.e6779. [DOI] [PMC free article] [PubMed] [Google Scholar]
- Ma B, Xiang Y, Mu SM, Li T, Yu HM, Li XJ. Effects of acetazolamide and anordiol on osmotic water permeability in AQP1-cRNA injected Xenopus oocyte. Acta Pharmacol Sin. 2004;25:90–97. [PubMed] [Google Scholar]
- Musa-Aziz R, Chen LM, Pelletier MF, Boron WF. Relative CO2/NH3 selectivities of AQP1, AQP4, AQP5, AmtB, and RhAG. Proc Natl Acad Sci USA. 2009;106:5406–5411. doi: 10.1073/pnas.0813231106. [DOI] [PMC free article] [PubMed] [Google Scholar]
- Nakhoul NL, Davis BA, Romero MF, Boron WF. Effect of expressing the water channel aquaporin-1 on the CO2 permeability of Xenopus oocytes. Am J Physiol. 1998;274:C543–C548. doi: 10.1152/ajpcell.1998.274.2.C543. [DOI] [PubMed] [Google Scholar]
- Nielsen S, Smith BL, Christensen EI, Knepper MA, Agre P. CHIP28 water channels are localized in constitutively water-permeable segments of the nephron. J Cell Biol. 1993;120:371–383. doi: 10.1083/jcb.120.2.371. [DOI] [PMC free article] [PubMed] [Google Scholar]
- Pan W, Borovac J, Spicer Z, Hoenderop JG, Bindels RJ, Shull GE, Doschak MR, Cordat E, Alexander RT. The epithelial sodium/proton exchanger, NHE3, is necessary for renal and intestinal calcium (re)absorption. Am J Physiol Renal Physiol. 2012;302:F943–F956. doi: 10.1152/ajprenal.00504.2010. [DOI] [PMC free article] [PubMed] [Google Scholar]
- Preston GM, Agre P. Isolation of the cDNA for erythrocyte integral membrane protein of 28 kilodaltons: member of an ancient channel family. Proc Natl Acad Sci USA. 1991;88:11110–11114. doi: 10.1073/pnas.88.24.11110. [DOI] [PMC free article] [PubMed] [Google Scholar]
- Preston GM, Carroll TP, Guggino WB, Agre P. Appearance of water channels in Xenopus oocytes expressing red cell CHIP28 protein. Science. 1992;256:385–387. doi: 10.1126/science.256.5055.385. [DOI] [PubMed] [Google Scholar]
- Pushkin A, Abuladze N, Gross E, Newman D, Tatishchev S, Lee I, Fedotoff O, Bondar G, Azimov R, Ngyuen M, Kurtz I. Molecular mechanism of kNBC1-carbonic anhydrase II interaction in proximal tubule cells. J Physiol. 2004;559:55–65. doi: 10.1113/jphysiol.2004.065110. [DOI] [PMC free article] [PubMed] [Google Scholar]
- Ruetz S, Lindsey AE, Kopito RR. Function and biosynthesis of erythroid and nonerythroid anion exchangers. Soc Gen Physiol Ser. 1993;48:193–200. [PubMed] [Google Scholar]
- Sabolic I, Valenti G, Verbavatz JM, Van Hoek AN, Verkman AS, Ausiello DA, Brown D. Localization of the CHIP28 water channel in rat kidney. Am J Physiol. 1992;263:C1225–C1233. doi: 10.1152/ajpcell.1992.263.6.C1225. [DOI] [PubMed] [Google Scholar]
- Schauble N, Lang S, Jung M, Cappel S, Schorr S, Ulucan O, Linxweiler J, Dudek J, Blum R, Helms V, et al. BiP-mediated closing of the Sec61 channel limits Ca2+ leakage from the ER. EMBO J. 2012;31:3282–3296. doi: 10.1038/emboj.2012.189. [DOI] [PMC free article] [PubMed] [Google Scholar]
- Schnermann J, Chou CL, Ma T, Traynor T, Knepper MA, Verkman AS. Defective proximal tubular fluid reabsorption in transgenic aquaporin-1 null mice. Proc Natl Acad Sci USA. 1998;95:9660–9664. doi: 10.1073/pnas.95.16.9660. [DOI] [PMC free article] [PubMed] [Google Scholar]
- Soderberg O, Gullberg M, Jarvius M, Ridderstrale K, Leuchowius KJ, Jarvius J, Wester K, Hydbring P, Bahram F, Larsson LG, Landegren U. Direct observation of individual endogenous protein complexes in situ by proximity ligation. Nat Methods. 2006;3:995–1000. doi: 10.1038/nmeth947. [DOI] [PubMed] [Google Scholar]
- Tashian RE, Carter ND. Biochemical genetics of carbonic anhydrase. Adv Hum Genet. 1976;7:1–56. doi: 10.1007/978-1-4757-0659-8_1. [DOI] [PubMed] [Google Scholar]
- van Heeswijk MP, van Os CH. Osmotic water permeabilities of brush border and basolateral membrane vesicles from rat renal cortex and small intestine. J Membr Biol. 1986;92:183–193. doi: 10.1007/BF01870707. [DOI] [PubMed] [Google Scholar]
- Vilas GL, Loganathan SK, Liu J, Riau AK, Young JD, Mehta JS, Vithana EN, Casey JR. Transmembrane water-flux through SLC4A11: a route defective in genetic corneal diseases. Hum Mol Genet. 2013;22:4579–4590. doi: 10.1093/hmg/ddt307. [DOI] [PMC free article] [PubMed] [Google Scholar]
- Vince JW, Reithmeier RA. Carbonic anhydrase II binds to the carboxyl terminus of human band 3, the erythrocyte C1-/HCO3- exchanger. J Biol Chem. 1998;273:28430–28437. doi: 10.1074/jbc.273.43.28430. [DOI] [PubMed] [Google Scholar]
- Vince JW, Reithmeier RA. Identification of the carbonic anhydrase II binding site in the Cl-/HCO3- anion exchanger AE1. Biochem. 2000;39:5527–5533. doi: 10.1021/bi992564p. [DOI] [PubMed] [Google Scholar]
- Yool AJ, Morelle J, Cnops Y, Verbavatz JM, Campbell EM, Beckett EA, Booker GW, Flynn G, Devuyst O. AqF026 is a pharmacologic agonist of the water channel aquaporin-1. J Am Soc Nephrol. 2013;24:1045–1052. doi: 10.1681/ASN.2012080869. [DOI] [PMC free article] [PubMed] [Google Scholar]
- Zhang R, Skach W, Hasegawa H, van Hoek AN, Verkman AS. Cloning, functional analysis and cell localization of a kidney proximal tubule water transporter homologous to CHIP28. J Cell Biol. 1993;120:359–369. doi: 10.1083/jcb.120.2.359. [DOI] [PMC free article] [PubMed] [Google Scholar]
- Zhang J, Tackaberry T, Ritzel MW, Raborn T, Barron G, Baldwin SA, Young JD, Cass CE. Cysteine-accessibility analysis of transmembrane domains 11–13 of human concentrative nucleoside transporter 3. Biochem J. 2006;394:389–398. doi: 10.1042/BJ20051476. [DOI] [PMC free article] [PubMed] [Google Scholar]
- Zhang W, Zitron E, Homme M, Kihm L, Morath C, Scherer D, Hegge S, Thomas D, Schmitt CP, Zeier M, et al. Aquaporin-1 channel function is positively regulated by protein kinase C. J Biol Chem. 2007;282:20933–20940. doi: 10.1074/jbc.M703858200. [DOI] [PubMed] [Google Scholar]
Associated Data
This section collects any data citations, data availability statements, or supplementary materials included in this article.


