

Abstract
Hyaluronan (HA) in human milk mediates host responses to microbial infection, via TLR4- and CD44-dependent signaling. Signaling by HA is generally size-specific. Because pure HA with average molecular mass (M) of 35 kDa can elicit a protective response in intestinal epithelial cells, it has been proposed that human milk HA may have a bioactive low M component. Here we report the size distribution of HA in human milk samples from twenty unique donors. A new method for HA analysis, employingion exchange (IEX) chromatography to fractionate HA by size, and specific quantification of each size fraction by competitive Enzyme Linked Sorbent Assay (ELSA), was developed. When separated into four fractions, milk HA with M ≤ 20 kDa, M ≈20-60 kDa, and M ≈ 60-110 kDa comprised an average of 1.5%, 1.4% and 2% of the total HA, respectively. The remaining 95% was HA with M≥110 kDa. Electrophoretic analysis of the higher M HA from thirteen samples showed nearly identical M distributions, with an average M of ∼440 kDa. This higher M HA component in human milk is proposed to bind to CD44 and to enhance human beta defensin 2 (HBD2) induction by the low M HA components.
Keywords: milk, hyaluronan, molecular mass, ion exchange, quantification, electrophoresis
Introduction
Human milk provides newborns with a critical first line of natural defense against harmful infectious agents in addition to providing essential nutrition and factors that promote growth as well as organ and immune system development. Multiple components of milk, including carbohydrates, proteins, and fatty acids, work in concert to achieve protection against intestinal pathogens and formation of a beneficial microbiota that is essential to the future health of the baby [1,2]. Human milk oligosaccharides (HMOs) have been appreciated as beneficial glycans that promote healthy commensal bacteria and pathogen protection within the infant gut for over sixty years [3]. Similarly milk glycosaminoglycans have been shown to play a protective role, by inhibiting HIV infection [4].
Coppaet al. [5] recently reported that hyaluronan (HA), a non-sulfated glycosaminoglycan extracellular matrix component produced by all vertebrates, is a natural component of human milk. Our group demonstrated, using a cohort of 42 nursing mothers, that HA is produced at the highest concentrations during the first months after giving birth (∼500ng/ml) and tapers to a steady level (∼100ng/ml) during the first year [6]. Importantly, HA purified from milk, when provided at the physiological concentrations provided to babies, induces increased expression of the antimicrobial peptide, human beta defensin 2 (HBD2) protein by a human epithelial cell line and protects them from intracellular Salmonella Typhimurium infection. In addition, isolated milk HA increases in vivo expression of the orthologue of HBD2 (MuBD3) in the intestine of mice, and this induction is dependent on the presence of two receptors, TLR4 and CD44 [7].
Recently we have also identified a highly purified, specific-size biosynthetic HA of 35kDa average molecular mass (HA35) that mimics the actions of milk HA in inducing HBD2 in vitro and MuBD3 in vivo [7]. Surprisingly, while HA35 induction of MuBD3 in vivo was dependent on TLR4, it was independent of CD44. One remarkable finding, both in vitro and in vivo, is the difference in potency between milk HA and HA35 (∼700 fold on a mass basis) in inducing comparable epithelial protection. Therefore we hypothesized that milk HA would be enriched for 35 kDa HA and also contain other sizes of HA that bind to CD44 to enhance HBD2 induction, and thus explain the difference in potency.
There are several challenges associated with the characterization of HA from human milk. Milk is a highly complex fluid, and standard HA isolation procedures are insufficient for removal of all contaminants. Even proteinase K cannot digest all of the protein components of milk. Our initial efforts to analyze the molecular mass distribution of isolated milk HA by gel electrophoresis were unsuccessful, due to substantial staining interference by known (e.g., chondroitin or sulfated glycosaminoglycans) and unknown contaminants. The concentration of HA in milk is also very low, so that methods of high sensitivity are required for analysis of the isolated HA.
Most current methods for determination of the M distribution of HA from tissues and biological fluids have been optimized for high M HA (greater than about 200 kDa). Commonly employed methods are size exclusion chromatography with multiangle laser light scattering (SEC-MALLS), and agarose or polyacrylamide gel electrophoresis [8-14]. Detection of very low M HA by light scattering is inherently insensitive, and the SEC-MALLS method requires a highly purified HA sample. Gel electrophoresis can analyze samples on the microgram scale, and can tolerate some impurities in the sample, but nonspecific staining by those impurities can interfere with size distribution analysis of the HA. Blotting of gels to positively charged nylon and detection of HA using a labeled specific binding protein [10] works only for HA with M greater than about 100 kDa, as a result of strong surface binding [15]. Most alternative methods have similar limitations. Capillary electrophoresis (CE) [16] is limited to pure HA samples. MALDI-TOF mass spectrometry [17,18] has high sensitivity, but requires a pure sample and HA with M larger than about 10 kDa becomes difficult to analyze [19]. The most promising method to date for complete size distribution analysis of HA isolated from biological samples is size exclusion chromatography-enzyme linked sorbent assay (SEC-ELSA) [20-22], because it is both sensitive and specific. However, SEC-ELSA has never been applied to the analysis of HA with M lower than about 100 kDa. A new method that has extremely high sensitivity and works best for low M HA is GEMMA (gas-phase electrophoretic mobility molecular analysis), but its accuracy has not yet been established for impure and polydisperse HA samples [23].
To address the issues of limited sample amount, purification difficulty, and the importance of analyzing both high and low M HA simultaneously, we developed a method using size-dependent fractionation of HA by anion exchange on a spin column, and quantification of HA in the fractions using a competitive ELSA assay. We then conducted HA size analyses for samples from 20 different human milk donors to characterize the diversity of HA sizes in milk. Here we report that only a small percentage (∼5%) falls in the range of the active commercial HA35 kDa preparation, and the majority has an average molecular mass of ∼440 kDa.
Material and methods
Materials
Twenty dated human breast milk samples were provided by 20 unique donors between January 2011 and December 2012. All donors provided informed consent in accordance with a protocol approved by the Cleveland Clinic Institutional Review Board, and provided de-identified samples that were assigned a code number corresponding to postpartum day of milk collection. All samples were stored at -20 °C.
Chemoenzymatically synthesized HA standards with narrow size distribution and known average molecular mass determined by size exclusion chromatography with multiangle light scattering (Select-HA™: specific HA sizes and mixtures of sizes as LoLadder) were obtained from Hyalose LLC (Oklahoma City, OK, USA). A low M HA sample containing chains 19-25 disaccharides in length (7.6-10.0 kDa) was prepared as previously described [24]. Polydisperse highly purified HA samples with known average molecular mass (based on measurement of intrinsic viscosity) were purchased from Lifecore Biomedical (Chaska, MN, USA). Chondroitin 4-sulfate and dermatan sulfate were obtained from Seikagaku Corporation (Tokyo, Japan).
Phosphate-buffered saline (PBS), Tris base, and boric acid were from Sigma Chemical (St. Louis, MO, USA). Proteinase K was from Roche (Indianapolis, IN, USA). The hyaluronidase (from Streptomyces hyaluronolyticus) was from Seikagaku Corporation (Tokyo, Japan). Sodium chloride (NaCl) was from Fisher Scientific (Waltham, MA, USA). Stains-All™ dye (3,3′-dimethyl-9-methyl-4,5,4′,5′-dibenzothiacarbocyanine) and bromophenol blue tracking dye were obtained from Bio-Rad Laboratories (Hercules, CA, USA). Polyacrylamide (4-20% gradient) gels in Tris-borate-EDTA (TBE) and streptavidin-coated magnetic beads (M-280) were from Life Technologies (Carlsbad, CA, USA). Agarose was from GE Healthcare (agarose NA, -mr = 0.10) (Pittsburgh, PA, USA). The HA competitive ELISA (ELSA) kit (K-1200) and biotinylated Versican G1 domain (G-HA02) were from Echelon Biosciences (Salt Lake City, UT, USA). Strong anion exchange (Q) spin columns (catalog # 90010), dialysis devices and cassettes with 3.5 kDa cutoff were from Thermo Pierce (Rockford, IL, USA).
Pure HA stock solutions preparation
Pure HA samples were dissolved and stored at 4 °C, at concentrations of 1 mg/mL for Select-HA™ and 0.5 mg/mL for polydisperse HA, in deionized water. The concentrations of the polydisperse HA solutions were determined by weighing the dry powders for solution preparation. Considering the water content in the powder, the deviation was <5% by this method, according to Haserodt et al. [25]. The concentrations of Select-HA™ solutions were based on dissolution of the entire contents of vials containing 1 mg, where that exact weight was confirmed by the supplier using the carbazole method for solutions aliquoted and dried in the vials, and the deviation was <3%. The HA stock solutions were diluted with PBS before use.
Hyaluronan molecular mass distribution analysis
Hyaluronan was fractionated according to molecular mass by calibrated ion exchange chromatography, and the fractions were analyzed for HA content by a specific competitive Enzyme-linked Sorbent Assay (ELSA). The scheme for this HA characterization process is represented in Figure 1. Since this is a new method, it is described below in detail.
Fig 1.

Scheme for determination of HA molecular mass distribution by ion exchange fractionation and specific HA quantification. HA was fractionated according to molecular mass using stepwise elution from an ion exchange column with solutions of increasing salt concentration. HA in each fraction was quantified by competitive ELSA.
Ion Exchange (IEX) chromatographic fractionation of polydisperse HA
In order to establish the method, a highly polydisperse HA test sample was created by mixing equal amounts of two polydisperse purified HA samples having viscosity-average (close to weight-average) M values of 22 kDa and 112 kDa. The HA samples were separately dissolved in water at a concentration of 0.5 μg/μL. The combined sample was prepared by mixing together 20 μL (containing 10 μg HA) of each solution, and adding 0.050 M NaCl to a total volume of 800 μl. [All NaCl solutions used in the ion exchange separations were prepared to an accuracy of at least three significant figures (sf) in concentration, using precise weights (4 sf) and volumetric flasks (4 sf).] The M distribution of this combined sample was determined by polyacrylamide gel and agarose gel electrophoresis, with detection using Stains-All™ dye. These methods have been previously shown to give accurate molecular mass determinations for HA within appropriate M ranges for each gel type [13,14]. Figure 2 shows the polyacrylamide gel image, and corresponding densitometric profiles. Corresponding data for agarose gel electrophoresis are provided in Supplemental Figure 1. Differences in profile shape are due to the relatively poorer separation of high M HA on polyacrylamide gel, and the relatively poorer separation of low M HA on agarose gel. This is analogous to the effects associated with the void and total volume peaks on gel filtration chromatographic separations, where poorly separated species elute together.
Fig 2.
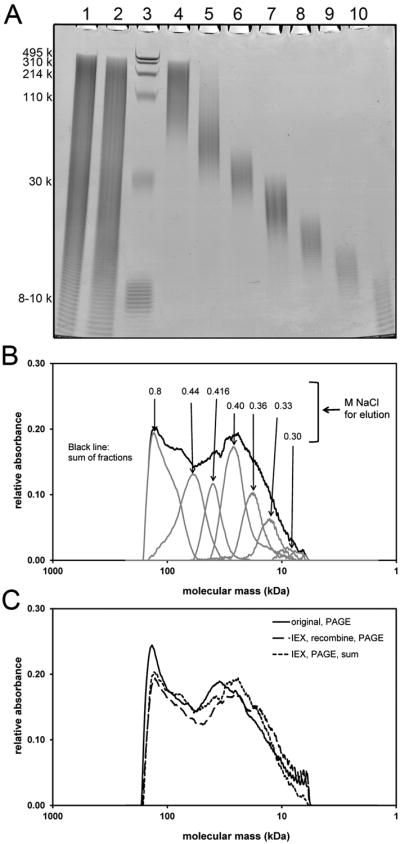
Electrophoretic analysis of a polydisperse HA sample fractionated by stepwise elution from an IEX spin column using seven NaCl solutions of increasing concentration. (A) Fractions on a 4-20% gradient polyacrylamide gel. Lane 1: untreated polydisperse HA, 4 μg. Lane 2: mixture of equal portions of the isolated IEX fractions (“recombine”), 4 μg if no loss occurred. Lane 3: Loladder containing HA molecular mass markers 495, 310, 214, 110, and 30 kDa, in addition to purified 7.6-10 kDa HA. Lanes 4-10: HA eluted with 0.800, 0.440, 0.416, 0.400, 0.360, 0.330 and 0.300 M NaCl solutions, respectively. (B) Densitometric analysis of HA fractions obtained by IEX. Scans correspond to sample lanes 4-10 of the gel. Migration distance is scaled to M by comparison with co-electrophoresed HA standards. Each IEX fraction has low polydispersity, in contrast to the overall high polydispersity of the additive sum of the sample fractions. (C) Densitometric scans of sample lanes 1 and 2 from the stained 4-20% polyacrylamide gel. The profile of the original mixture is highly similar to that of the recombined IEX fractions, and to the additive sum of the individual fraction profiles. The result indicates IEX fractionation of HA causes no overall or size-preferential losses, and maintains the true M distribution.
Fractionation of the HA mixture was performed using two strong anion exchange (Q) spin columns (Thermo Pierce, catalog # 90010, 500 μL), each treated identically. For each step of the procedure, each column was loaded with 400 μL of sample or salt solution, then centrifuged at 400 ×g for 2 min for elution. Each column was pre-washed once with a 400 μL aliquot of 0.050 M NaCl. The HA sample in 0.050 M NaCl was loaded, centrifuged, and then the column was again washed once with a 400 μL aliquot of 0.050 M NaCl. The column was washed further with three aliquots of 0.200 M NaCl, which does not cause release of any pure HA of the sample, but aids analysis of impure biological HA samples by removing some impurities. To elute HA of increasing size, the column was eluted stepwise with 2×400 μL aliquots of NaCl solutions with concentrations of 0.300, 0.330, 0.360, 0.400, 0.416, 0.440, and 0.800 M (seven fraction method), or 0.360, 0.425, 0.460 and 0.800 M (four fraction method). Corresponding fractions from both columns were combined. Each combined 1.6 mL fraction was dialyzed against de-ionized water using 3.5kDa cutoff dialysis devices (Thermo Pierce, catalog # 88403), and a volume ratio of samples to dialysate of 1:26, with a total of 5 changes of dialysate over 16-18 h. The dialyzed fractions were each concentrated to a volume of approximately 200 μL using a centrifugal evaporator, using minimal heating to aid sublimation but keeping the sample cold, such that monodisperse HA subjected to the same process showed no degradation. The exact volume of each fraction was determined by liquid weight. Then these fractions were used as follows: 15% of each were taken for the Enzyme-Linked Sorbent Assay (ELSA); 20% of each were taken for electrophoresis; 50% of each were taken and added together as a combined elution named “recombine”. Subsequently, 40% of the “recombine” sample was used for electrophoresis, and the rest saved for future use.
Calibration of IEX Separation by correlation of HA fraction elution conditions with electrophoretic determination of average M and M distribution
The portion of each HA fraction that had been reserved for electrophoresis was concentrated to approximately 10 μL. Electrophoresis was performed using polyacrylamide (4-20% gradient) and agarose (3%) gels (Figure 2, Supplemental Figure 1), and the scanning process and the subsequent mass distribution analysis followed the methods described by Cowman et al. [13] and Bhilocha et al. [14]. Generally, after densitometric scanning, a calibration plot of the logarithm of the HA standard molecular mass versus migration distance (pixel number in the scan data) on the gel was prepared for each gel. From the linear portion of the calibration plot, an equation was generated to allow conversion of migration distance to molecular mass for all HA sample densitometric profiles in that gel. The average M and range of M (width at half height) for each fraction have been obtained from these profiles.
The IEX method fractionates HA according to molecular mass, because the total charge of a chain depends on the number of repeating disaccharide units. Using 0.300 M NaCl, only very low M HA (ca. 5-9 kDa) could be eluted. Using subsequent steps of 0.330, 0.360, 0.400, 0.416, and 0.440 M NaCl allowed elution of HA fractions with increasing average M. A single step of 0.800 M NaCl eluted all remaining HA with M above ca. 80 kDa. Figures 2A and 2B, and Supplemental Figure 1 show the electrophoretic gel results and densitometric scans for the fractions. The densitometric scans of the stained gels were used to determine the M range and the average M for each fraction (Table 1), and the portion of the total stained area (=mass ratio) for each fraction based on the relative area under each peak in the densitometric profile (Figure 3).
Table 1. HA Sample Fractionation by IEX (7 fraction method and 4 fraction method).
| IEX Fraction (M NaCl) | HA average M (kDa) | HA M range (kDa) (width at half height) |
|---|---|---|
| 0.300 | 7±1 | 5±1 to 9±2 |
| 0.330 | 11±1 | 9±1 to 14±2 |
| 0.360 | 16±2 | 13±2 to 20±3 |
| 0.400 | 25±2 | 19±2 to 33±3 |
| 0.416 | 38±3 | 32±2 to 47±4 |
| 0.440 | 61±10 | 43±4 to 74±12 |
| 0.800 | *150 (>80) | 79±16 and above |
|
| ||
| 0.360 | 12 | 7 to 21 |
| 0.425 | 35 | 22 to 56 |
| 0.460 | 80 | 57 to 114 |
| 0.800 | *155 (>80) | 108 and above |
data obtained from the results of 3% agarose gel electrophoresis.
Fig 3.

Comparison of M distributions obtained for a polydisperse HA sample by electrophoretic and IEX-ELSA methods. Each fraction was analyzed by polyacrylamide gel and agarose gel electrophoresis (the area under the densitometric curve for each fraction was determined),and by a competitive ELSA assay. The shape of the M distribution, which can be analyzed by electrophoresis only for purified HA, is well approximated by an HA-specific quantification assay of the fractions.
The polydispersity of the HA fractions obtained by IEX varies with M, since the relative difference in total charge decreases with increasing chain length. In the very low M range, HA is separated into fractions with quite low polydispersity, indicated by the narrow bands observed by electrophoresis. As the concentration of the eluting salt solution increases, the corresponding HA fractions become broader in M distribution. It can be seen that at 0.360 M NaCl, only HA between ca. 13-20 kDa came out, and at 0.416 M NaCl, HA between ca. 32-47 kDa was washed out, but 0.440 M NaCl then eluted HA of ca. 43-74 kDa. The fractionation of higher M HA became even more sensitive to the salt concentration, and thus size-dependent fractionation on the IEX spin column was relatively poor for HA larger than about 100 kDa. Using 0.500 M NaCl eluted HA up to ca. 2 MDa (data not shown). 0.8 M NaCl elutes any HA with larger size.
The same IEX fractionation process was conducted six times with the same sample to determine the reproducibility of the fractionation process. Each time the average M and range of M for each fraction was obtained from its electrophoretic result. The reproducibility of the molecular mass correlation with NaCl concentration needed for elution, used to calibrate the IEX column characteristics, is presented in Table 1.
The IEX elution step gradient could be varied to obtain HA with specific controlled size ranges. Supplemental Figure 2 and Table 1 show the results and characteristics of the same polydisperse HA sample described above, after separation into only 4 fractions using NaCl steps of 0.360, 0.425, 0.460, and 0.800 M. Supplemental Figure 2 affirms the successful fractionation and absence of sample loss, and Table 1 presents the characteristics of this fractionation set. Other specific desired HA fractionation patterns could be developed using an IEX spin column eluted with salt solutions of appropriate concentrations.
Experimental considerations related to calibrated IEX fractionation of HA
The question of possible HA loss or degradation during the IEX fractionation process, especially the preferential loss of specific sizes of HA, was addressed in two ways. First, an equal portion of each HA fraction obtained after the IEX separation was removed, and a recombined sample was obtained by mixing them together. The recombined sample was co-electrophoresed on polyacrylamide or agarose gel with the original sample (Figure 2, Supplemental Figure 1, Supplemental Figure 2). Within normal limits of reproducibility in densitometric analyses of HA by this method, the recombined sample was the same as the original sample on both polyacrylamide and agarose gel. Second, equal portions of the HA fractions were co-electrophoresed with the original and recombined samples, and the densitometric profiles of the fractions were summed. The summed profile was also identical with that of the original sample within experimental uncertainty. Therefore, there was no discernible total loss or preferential loss of any size HA during the IEX fractionation procedure, and no apparent degradation of HA.
The size calibration of fractions obtained using pure HA, eluted at a given NaCl concentration, can be applied to the analysis of less pure HA from biological fluids and tissues, when separated and analyzed by the same procedure. In order to maintain reproducibility and calibration, several experimental details must be standardized and maintained constant. The centrifugal force applied to the IEX spin column needs to be kept constant and is recommended to be no higher than 400 ×g. Higher force was found to result in premature release of HA from the column. The temperature needs to be kept constant. Elution of HA using cold salt solutions occurred at lower salt concentration than observed with room temperature solutions. For some IEX column lots, we found an unknown (possibly cationic) species may be shed from the column during sample elution, and later cause precipitation of HA following fractionation and dialysis. It is therefore recommended to prewash the IEX column three times with 400 μL of 0.800 M NaCl, and then to re-equilibrate the column using five washes with 400 μL of 0.050 M NaCl, before use. HA fractions need to be completely dialyzed to remove salt, before concentration and electrophoresis. Concentration in the presence of high salt has been observed to result in HA degradation. Electrophoresis in the presence of residual salt concentrations greater than about 0.15 M causes aberrant migration.
Quantitative analysis of HA fractions by competitive ELSA assay and comparison with electrophoretic analysis
In order to quantify the mass of HA eluted at each NaCl concentration, a specific competitive ELSA (ELISA-like but using a specific binding protein) assay (type K-1200, from Echelon Biosciences) was employed. An equal portion of each fraction was mixed with Reagent Diluent (provided in the kit) to a final volume of 500 μL. This was the 1× sample. A 125 μL portion was then removed and diluted three-fold with Reagent Diluent to 375 μL. This is the (1/3)× sample. A 125 μl portion of the (1/3)× sample was further diluted to 375 μL to make a (1/9)× sample. Each sample was analyzed in duplicate. The assay procedure followed the instructions within the kit. The final signal was collected after 45 min substrate incubation, using a microplate reader (SpectraMax M2, Molecular Devices). The HA concentration for each fraction isolated by the ion exchange purification method was determined and then used to calculate the percent of the mass of HA found in each fraction, relative to the whole sample (sum of all fractions).Figure 3 presents a comparison of the results from the ELSA assay with the results from densitometric analysis of the electrophoretic gels. There is excellent agreement in the shape of the M distribution of HA analyzed by the two methods.
Isolation and molecular mass distribution determination for human milk HA
The twenty human milk samples were collected, analyzed for HA concentration by a competitive ELSA assay (Echelon Biosciences), and frozen for later use. HA was isolated using essentially the method described by Hill et al. [6]. Bacterial contamination was avoided by using only pre-autoclaved tubes, pipettes, and labware. Frozen milk samples were defrosted. An aliquot of 20-30 mL per sample was heated in boiling water for 10 min, then cooled in an ice water bath for 10 min. Protein was digested by addition of proteinase K (Roche Applied Science, catalog # 03115828001) to a final concentration of 0.5 mg/mL, and then incubation at 60°C overnight. To remove lipids, the samples were cooled for 10 min in an ice water bath and centrifuged for 15 min at 3000 ×g at 4°C, and the lower aqueous layer in each tube was collected. The centrifugation was repeated once to more completely remove lipid. The aqueous solutions were further centrifuged at 25,000 ×g for 10 min at 4°C to remove any particulate material, and then heated in a boiling water bath for 10 min. Samples were cooled to room temperature in an ice water bath, then centrifuged again at 25,000 ×g for 10 min at 4°C. Each clarified sample was transferred to a 50 mL dialysis cassette with 3.5 kDa cutoff, and exhaustively dialyzed against five changes of 4 L deionized water over 16 h. Dialyzed samples were centrifuged at 25,000 ×g for 10 min at 4°C to remove any particulate matter, then concentrated to approximately 4 mL, using a centrifugal evaporator. This was the incompletely purified HA sample to be subjected to molecular mass distribution analysis. An aliquot containing at least about 300 ng HA was taken from each sample for later concentration determination. The remaining sample was made 0.050 M in NaCl by addition of a 0.200 M stock, and adjusted to a volume of 4 mL, then stored frozen at -20°C.
HA samples were fractionated according to M using ion exchange chromatography (IEX). Each sample was fractionated using ten strong anion exchange mini spin columns treated identically. For each step of the procedure, each column was loaded with 400 μL of sample or salt solution, then centrifuged at 400 ×g for 2-3 min for elution. The procedure for handling the milk HA samples on IEX was essentially the same as described above for pure HA. One sample was analyzed by the seven fraction method, and twenty samples were analyzed by the four fraction method. Corresponding fractions from the ten columns used for each sample were combined. Each 8 mL pooled fraction was transferred to a 12 mL, 3.5kDa cutoff, dialysis cassette, and the fractions for each sample were dialyzed together against 4 L deionized water with a total of five changes of dialysate over 16 h. The dialyzed fractions were each concentrated to a volume of approximately 1 mL using a centrifugal evaporator, transferred to a microcentrifuge tube, stored frozen if necessary, and then taken to dryness in a centrifugal evaporator. Tubes were stored at -20°C until assayed.
Preliminary experiments had shown that the levels of low M HA in human milk were only about 4-5% of the total HA. All of the higher M HA (≥ ca. 110 kDa) would be present in the 0.800 M NaCl fraction. For milk samples with sufficient HA based on the initial sample HA assay, the 0.800 M fraction was dissolved in water, and an appropriate volume containing about 5 μg HA was kept for analysis by 1% agarose gel electrophoresis, before and after digestion of HA using the HA-specific hyaluronidase from Streptomyces hyaluronolyticus (Seikagaku Corporation) at a ratio of 0.25 units per μg HA, at 37 °C for 4 h. The M distribution of HA in this fraction was obtained by subtracting the densitometric profile of the digested sample from that of the undigested. The remainder of the 0.800 M fraction was appropriately diluted into Reagent Diluent used in the ELSA assay (Echelon Biosciences). Lower M HA fractions eluted from the IEX spin columns at lower salt concentrations were directly dissolved in 400 μL Reagent Diluent, and not analyzed by electrophoresis due to the low HA contents and high level of co-purifying contaminants that preclude detection of HA by staining after electrophoresis.
The HA fractions from each milk sample were analyzed by competitive ELSA assay. For a 25 mL milk sample at an average HA concentration of about 250 ng/mL, the expected mass of low M HA (<ca. 100 kDa)was only about 250-310 ng, distributed relatively evenly among the three low M fractions. The ELSA assay preferably has HA concentrations of about 100-1000 ng/ml, and requires 0.1 mL per well, so a minimum of 10 ng is needed per well and duplicate analysis requires at least 20 ng. Assay at multiple dilutions further increases the amount of HA needed. In order to bring most test samples to a point closer to the midpoint of the standard curve, they were spiked with a known amount of pure HA (polydisperse HA with 59 kDa average M, from Lifecore Biomedical), and the appropriate spike concentration as determined on the same assay plate was subtracted from corresponding sample values.
Specific HA isolation from human milk HA fractions
At room temperature, 150 μL of 10 mg/mL streptavidin-coated magnetic bead suspension (M-280, Life Technologies) was pre-cleaned 3 times with 150 μL PBS 0.05% Tween, following the manufacturer's instructions. An 80 μL aliquot of low M milk HA (estimated to contain ∼0.3 μg HA in deionized water),obtained by 0.425M NaCl elution of No. 14 human milk HA from IEX and subsequent dialysis, was mixed with 10 μL of 0.75 μg/μL biotinylated versican G1 domain (bVG1, Echelon Bioscience) in PBS for 3h at room temperature to saturate HA chains with bVG1. The 90 μL mixture was then mixed with the washed beads for 45 min to let the HA-bVG1 complex bind to the beads. After that, the beads were collected by magnet and washed 3 times with 150 μL PBS 0.05% Tween each time. Deionized water (70 μL) was then added to the beads and heated at 95 °C for 15 min to release HA from the beads. The supernatant was collected and the elution process was repeated once using another 50 μL water. After that, the two HA-containing solutions were merged and concentrated to about 20uL. Proteinase K (Roche) was added to the HA solution to a concentration of 1 ug/uL and the mixture was kept at 60 °C for 3h to digest any released bVG1. The sample was concentrated to ∼10 μL before electrophoresis on the 4-20% polyacrylamide gel (Life Technologies). The electrophoresis process was as previously described [13,14].
Results
HA in human milk is present at very low concentration (generally, ca. 100-1000 ng/mL [6]), and has proven difficult to purify from all contaminants using standard HA isolation protocols. The procedures employed included removal of proteins by protease treatment, removal of lipids, and removal of dialyzable components. Such procedures do not remove certain contaminants that interfere with detection of HA on electrophoretic gels for size determination. These contaminants can include unsulfated chondroitin, sulfated glycosaminoglycans, protease-resistant proteins, and other unknowns, possibly including nucleic acids. As an alternative, a size-and charge-dependent separation method, coupled with specific quantification, was developed. Ion exchange (IEX) chromatography on a strong anion exchange (Q) resin in a spin column format was used to remove sulfated glycosaminoglycans and to separate HA according to size, using a step gradient in NaCl for elution. Each fraction was dialyzed to remove salt, then analyzed for HA content using a competitive specific ELSA assay, since contaminants such as chondroitin that are still not removed by the IEX will not be detected by the ELSA. The IEX separation was calibrated using pure HA.
HA in milk is not degraded by the isolation and fractionation method
The question of possible HA degradation during the isolation and IEX procedures was examined by spiking HA standards into milk, and subjecting the sample to purification and fractionation. Figure 4 shows that 1000kDa HA, added to milk and subjected to both purification and IEX steps, shows little or no degradation after the entire procedure. A similar purification method has been applied elsewhere [26] in the purification of HA from rat skin, yielding HA with average M of approximately 6000kDa. The procedure used here appears to cause no significant degradation or loss of either high M or low M HA.
Fig 4.
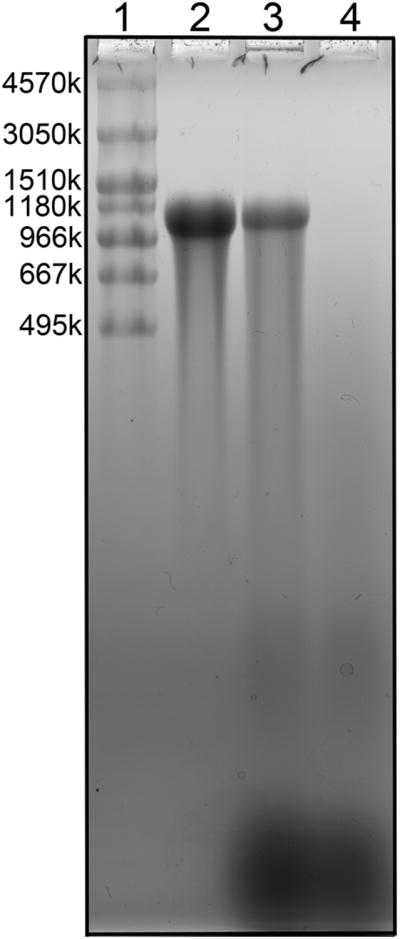
Low polydispersity 1000 kDa Select™ HA, added to milk and subjected to both purification and IEX fractionation steps, shows little or no degradation after the entire procedure. Lane 1:MegaLadder and HiLadder HA standards. Lane 2: untreated 1000 kDa Select™ HA, 1.5 μg. Lane 3: high M HA component (0.800 M NaCl elution)isolated from 3 mL milk spiked pre-isolation with 1.5 μg 1000 kDa Select™ HA. Lane 4: high M HA component (0.800 M NaCl elution) isolated from 3 mL milk.
HA recovery from milk following isolation and fractionation is high
The question of HA recovery through the procedure was addressed by measuring the total HA content in raw milk samples, and then the total HA content in the final IEX fractions. The overall recovery averaged approximately 82%±23% (apparent range 53-124%). The average recovery of milk HA during the IEX step alone was 103% ± 35%. Spiked 1.7 MDa pure HA added into milk had a recovery of ca. 75% in a control experiment (data not shown).
The IEX fractionation removes sulfated glycosaminoglycans from milk HA
The behavior of sulfated glycosaminoglycans on the IEX system was examined first with pure chondroitin 4-sulfate and dermatan sulfate, and then using milk HA. The sulfated glycosaminoglycans are well separated according to size and charge on polyacrylamide gel electrophoresis, and can be differentiated from HA by the different characteristic color of bands stained with Stains-All dye (blue for HA or chondroitin, purple for chondroitin sulfate or dermatan sulfate, and yellow-orange for heparan sulfate). Low M chondroitin 4-sulfate fragments were observed to be eluted from the IEX column used in the present study by an NaCl concentration of 0.90-1.0 M. Chondroitin 4-sulfate polymers were eluted at approximately 1.1 M NaCl, and a concentration of 1.5 M NaCl was adopted for complete elution of the sulfated glycosaminoglycans chondroitin 4-sulfate, chondroitin 6-sulfate, and dermatan sulfate. For partially purified milk HA (containing [nonsulfated or undersulfated] chondroitin and sulfated glycosaminoglycans), elution from the IEX column with 0.800 M NaCl will release even very high M HA, but no normally sulfated glycosaminoglycans. The more highly charged sulfated glycosaminoglycans can be eluted with 1.5 M NaCl, as seen in Supplemental Figure 3.
Molecular mass distribution of HA from human milk
We observed that conducting a fractionation protocol using a given IEX column type and specific set of NaCl concentrations led to highly reproducible results. The calibration of the IEX column, based on elution of pure HA at a given NaCl concentration, can thus be applied to the analysis of less pure HA from biological fluids and tissues, when separated and analyzed by the same procedure.
The result of milk HA characterization is presented in Table 2. The measured HA concentrations are highly disperse, ranging from 70 to 2740 ng/mL, with an average HA concentration of 250 ± 120 ng/mL, excluding two high values (1370, 2740) which exceeded two standard deviations from the mean of the other samples.
Table 2. Results from Analysis of Twenty Human Milk HA Samples.
| Milk source | [HA] (ng/ml) | Milk volume used (mL) | Milk HA used (μg) | Recovery(%) | Mw of 0.800 M elution (kDa) |
|---|---|---|---|---|---|
| 1 | 138 | 25 | 3.5 | 53.2 | - |
| 2 | 135 | 25 | 3.4 | 92.3 | - |
| 3 | 208 | 25 | 5.2 | 107.8 | 358 |
| 4 | 66 | 25 | 1.7 | 65.2 | - |
| 5 | 1374 | 8 | 11.0 | 62.1 | 331 |
| 6 | 385 | 20 | 7.7 | 51.9 | 479 |
| 7 | 252 | 25 | 6.3 | 62.9 | 410 |
| 8 | 89 | 14 | 1.2 | 72.8 | - |
| 9 | 353 | 27 | 9.5 | 54.9 | 557 |
| 10 | 262 | 22 | 5.8 | 124.1 | 464 |
| 11 | 203 | 25 | 5.1 | 103.6 | 471 |
| 12 | 127 | 25 | 3.2 | 103.8 | - |
| 13 | 331 | 27 | 8.9 | 75.8 | 400 |
| 14 | 2736 | 28 | 76.6 | 101.4 | 514 |
| 15 | 159 | 19 | 3.0 | 52.2 | - |
| 16 | 343 | 22 | 7.5 | 63.5 | 434 |
| 17 | 263 | 25 | 6.6 | 103.0 | - |
| 18 | 459 | 16 | 7.3 | 96.8 | 477 |
| 19 | 324 | 27 | 8.7 | 89.1 | 438 |
| 20 | 405 | 25 | 10.1 | 100.3 | 407 |
Each milk HA sample was partially purified by digesting proteins and removing lipids and other small molecules. After saving a small portion for ELSA to determine the total HA concentration, the remaining sample was further purified using the IEX spin column, by washing with low salt to remove some impurities that were unbound or weakly bound. One milk HA sample was analyzed by the seven fraction method. Figure 5 shows the mass fraction of the total HA that was found in each of the seven fractions, versus the weight-average molecular mass of the HA in each fraction, previously calibrated using purified HA. The 0.800 M NaCl fraction contained about 96% of the total HA. The remaining 4% of the HA was approximately 20-60 kDa in molecular mass. The mass fraction of the high M HA eluted at 0.800 M was scaled to 1/10 for improved visualization of the low M HA fractions. M used for the 0.800 M NaCl fraction was from electrophoretic analysis described below.
Fig 5.

M distribution for the twenty partially purified human milk HA samples after fractionation by IEX, and analysis by competitive ELSA assays. The mass ratio of the high M HA eluted at 0.800 M was scaled to 1/10 for improved visualization of the low M HA fractions. The average M (ca. 440 kDa) for the 0.800 M HA fraction from milk was separately determined by agarose gel electrophoresis.
Twenty samples of milk HA were subsequently fractionated by the four fraction method, using stepwise elution with increasing salt concentrations of 0.360, 0.425, 0.460 and 0.800 M. Based on calibration of the method using pure HA, the molecular mass distribution in these fractions is as follows: 0.360 M yields HA ≤ ca. 20 kDa, 0.425 M yields HA of ca. 20-60 kDa, 0.460 M yields HA of ca. 60-110 kDa, and 0.800 M yields HA ≥ ca. 110 kDa. The milk HA fractions were analyzed by a competitive ELSA assay. For the twenty milk samples analyzed, the low M (≤110 kDa) HA comprised only about 5% of the total mass on average, while the higher M HA was 95%. The M ≤ 20 kDa, 20-60 kDa, and 60-110 kDa fractions respectively contained only 1.5%, 1.4% and 2% of the total HA on average. Results are shown in Figure 5. The mass fraction of the high M HA eluted at 0.800 M was scaled to 1/10 for improved visualization of the low M HA fractions. The solid curve is produced to fit the average mass ratio of each fraction. There is excellent agreement between the molecular mass distribution patterns obtained using the seven fraction method and the four fraction method.
Pure polydisperse HA has been shown to suffer no degradation and to be obtained in ∼80% recovery without preferential size loss after the whole isolation process (data not shown). To verify that the ELSA-detected contents of low M HA in milk samples were not artifacts, and that the HA eluted at a given salt concentration had the appropriate M determined by the calibration procedure, one of the 0.425M milk HA fractions was subjected to HA-specific isolation. The specific isolation method was developed by analogy to pull down techniques by using biotinylated versican G1 domain (bVG1) and streptavidin-coated magnetic beads. The bVG1 was first incubated with the sample solution to specifically capture and saturate the HA chains in order to obtain strong target binding, then the beads were added to the mixture to pull down the HA-bVG1 complex. After washing the beads, HA and bVG1 were released by heating, and the bVG1 was digested with Proteinase K before electrophoresis. The result of the isolation is shown in Figure 6. The 0.425M fraction contained HA within the range of ∼25-60 kDa, which is consistent with the calibrated M range of the corresponding pure HA elution.
Fig 6.
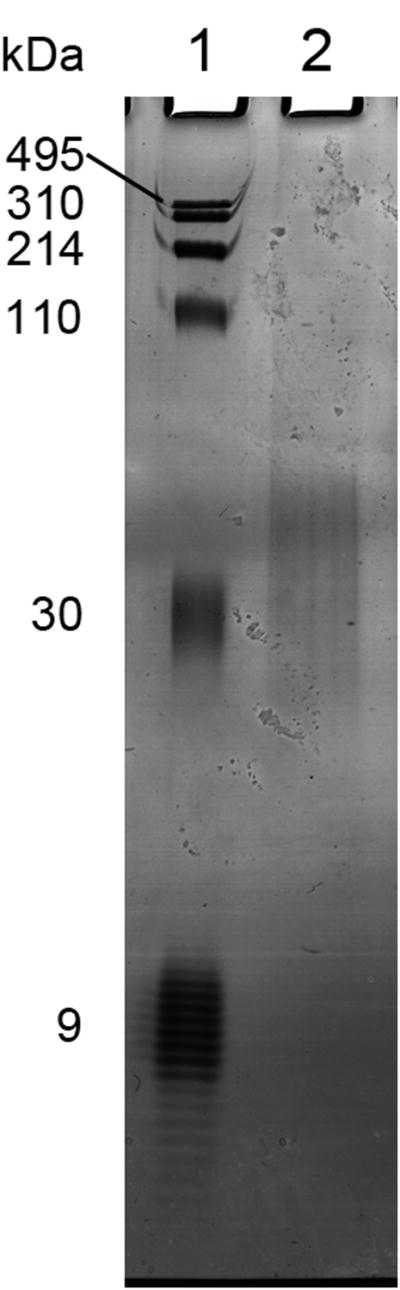
Specific isolation of low M HA from human milk, analyzed by 4-20% polyacrylamide gel electrophoresis. Lane 1: Loladder containing HA molecular mass markers 495, 310, 214, 110, and 30 kDa, in addition to purified 7.6-10 (average ca. 9) kDa HA. Lane 2: milk HA from a 0.425 M NaCl elution from IEX, captured by specific binding to bVG1 and streptavidin-coated magnetic beads.
Amore complete M distribution for the 0.800 M high M HA fraction from milk was separately determined by agarose gel electrophoresis. For the thirteen samples that had sufficient HA, the 0.800 M fraction of each sample was divided into two equal sets of ∼2.5 μg HA (determined by ELSA) before loading onto a 1% agarose gel. One of the sets was predigested by an HA-specific hyaluronidase. A representative gel result is shown in Figure 7. Comparison of lanes 3 and 4 indicates that no apparent impurity bands are overlapping with the main HA band (Note that the densitometric profiles in the region of the gel that would correspond to HA <100 kDa contains only contaminants, since all of the low M HA had been eluted from the IEX column at lower NaCl concentrations. Thus lane 4 shows that even after all purification steps, and digestion of all HA, a large amount of impurities, probably including unsulfated and undersulfated chondroitin, are still present in the sample). The molecular mass distributions for the milk HA samples eluted with 0.800 M NaCl were obtained by subtracting the densitometric profiles of the digested samples from the corresponding undigested ones. The average M and range of M for each sample was then obtained from these corrected profiles, as described by Cowman et al. [13] and Bhilocha et al. [14]. High M HA was well separated on the 1% agarose gel. The M ranged from about 100-1500kDa, with a weight-average M of 514 kDa for the sample shown in Figure 7. The gel results for the twelve other milk 0.800 M fractions are presented in Supplemental Figure 4, and the densitometric profiles for all thirteen samples are shown in Figure 8. Surprisingly the plot shows that the M distributions were all highly similar among thirteen independent milk samples with initial HA concentrations ranging from 203 to 2736 ng/ml. The weight-average M of each sample is shown in Table 2.The average weight-average M of the thirteen samples was 440 ± 60 kDa.
Fig 7.

M distribution for the 0.800 M HA fraction from human milk sample No. 14 by 1% agarose gel electrophoresis. Lane 1:Hiladder, containing HA molecular mass markers 1510, 1180, 966, 667, 495 kDa. Lane 2: Loladder and Megaladder containing HA molecular mass markers 4570, 3050, 1520, 495, 310, 214, 110, and 30 kDa. Lane 3:ca. 2.5 μgHA eluted with 0.800 M NaCl solution after 0.360, 0.425 and 0.460 M NaCl stepwise elution. The HA amount is estimated from the ELSA data. Lane 4: The same sample as in Lane 3 after specific hyaluronidase digestion. The bands lower than 100 kDa are impurities and don't contain any HA.
Fig 8.

Densitometric analysis of electrophoretic separation of 0.800 M elutions of thirteen milk HA samples by IEX. The M distributions were obtained by subtracting the digested sample profiles from the corresponding undigested ones. The average M and range of M for each sample was obtained from these profiles. The M distributions are highly similar among thirteen independent milk samples.
It was not possible to analyze the low M milk HA fractions by electrophoresis, as the sub-microgram amounts were too low to be detected properly by staining, and their migration positions in the gels would coincide with strongly staining impurities.
Discussion
The combined use of IEX to fractionate HA on the basis of size, followed by quantification of HA in each fraction using a competitive ELSA assay yields a molecular mass distribution that is very similar to that obtained by established electrophoretic methods using pure HA. This demonstration is essential for application of the method to imperfectly purified HA isolated from limited biological sources. This method provides an improved procedure, since it is not possible to analyze impure HA samples by electrophoretic analysis with nonspecific staining, and “Eastern” blotting with specific detection cannot detect HA less than 20 kDa and does not properly quantitate HA less than 150 kDa[15].
The present investigation demonstrates the usefulness of ion exchange chromatography with ELSA in determining low molecular mass distribution of HA in human breast milk. The IEX fractionation can also be differentially optimized to provide HA fractions with specific average M by changing the salt concentrations of the eluting solutions. For example, the method can be used to separate fractions containing HA greater than about 80 kDa from various fractions containing low M HA of desired low polydispersity, in the range of about 7-80 kDa. This fractionation method for low M HA provides an improvement over existing SEC methods for separation and purification of HA according to M, by allowing batch-wise step elution for isolation of fractions of specified average M and low polydispersity in M. Analysis of the HA fractions by electrophoresis is not routinely necessary for analysis of biological HA samples, except for pre-determining the sizes of specific fractions.
Anion exchange chromatography with gradient elution using salt solutions of increasing ionic strength has been used previously to separate short oligosaccharide fragments of HA by degree of polymerization and thus total charge (since there is one negative charge per disaccharide repeat unit), but success has been limited to fragments containing from 1 to about 20 disaccharides (0.4-8 kDa) [17,27-30]. Short fragments of sulfated glycosaminoglycans, their desulfated products, or hybrid oligosaccharides created by transglycosylation have also been separated by anion exchange chromatography. Fragments containing 1 to approximately 20 disaccharides (ca. 10 kDa) were separated by size using an elution gradient of increasing ionic strength [31-34]. No glycosaminoglycans have previously been fractionated by size / degree of polymerization / total charge for sizes above about 8-10 kDa. It has generally been expected that fragments larger than about 10 kDa would not be fractionated on the basis of size using ion exchange methods, due to small differences in total charge between long chains. Our results show that this IEX separation technique is also able to fractionate HA fairly well into narrow sub-fractions up to around 100 kDa. M-dependent separation of HA above this size by IEX has been less successful.
Surface detection techniques for HA such as blotting or sandwich ELSAs have proven to be incapable of detecting HA below 20 kDa, and the signal for low M HA is significantly M-dependent [15]. A detection method that is able to “see” all sizes of HA equally is preferred. HA detection by a competitive ELSA assay is not sensitive to molecular mass as low as 6 kDa [25], because the HA-protein binding event occurs in solution phase. Thus, HA size fractionation with subsequent competitive ELSA assay is a suitable method for determination of HA molecular mass distribution. The sensitivity of the ELSA kit used in our demonstration generally needs at least 20 ng per sample. The sensitivity could be further improved by using fluorescently labeled HA binding molecules [35]. Where low M HA is a small fraction of the total HA present in a tissue or fluid, and the available quantity of HA may be small, the high sensitivity in detection afforded by an ELSA assay provides the necessary sensitivity.
Our findings that only ∼5% of the human milk HA is of low M is unexpected. We thought milk HA would be enriched for 35 kDa HA, since this size specifically was found to have very similar innate defense inducing properties, including induction of HBD2 in human intestinal epithelial cells or its orthologue, MuBD3, in vivo in mouse intestine, among different M preparations of highly pure HA tested [7]. Additionally, like milk HA [6], 35 kDa HA protects from Salmonella infection in vitro (de la Motte- unpublished). However, two functional differences between milk HA and 35 kDa HA were striking. Firstly, milk HA is ∼700 fold more effective on a mass base in inducing comparable epithelial protection (500ng vs 350 μg for maximal response of milk HA and 35 kDa HA, respectively). Secondly, receptor requirements are different for in vivo MuBD3 induction; milk HA requires both CD44 and TLR4 receptors whereas 35 kDa HA works independently of CD44.
Based on our M distribution data for human milk HA, ∼95% being between 100-1500kDa, we were also surprised that large molecular weight HA, even in that size range, had no HBD2 inducing ability (Hill et al. [7] and de la Motte- unpublished). A possible explanation for the relative strong potency of milk HA induction could be that the higher size HA in the milk interacts with CD44 to enhance HBD2 induction by even a very small amount of low M HA acting via TLR4. Several clues appear to support the interaction of CD44 with high M milk HA. According to Hill et al. [6], the aggregation of CD44 epitopes within the epithelial cell membrane appeared to be increased in the presence of milk HA, but not 35 kDa HA. The aggregation seems to be the result of multiple CD44 binding to a high M HA but not a low M HA. In addition, their work has also shown that the total phosphorylated ERK1/2 was increased following treatment with milk HA, but not 35 kDa HA or hyaluronidase-digested milk HA. Since the interaction of HA with CD44 has been demonstrated to result in specific MAPK/ERK activation [36,37], the ERK increase may result from interaction of CD44 with high M HA but not the low M HA.
The similarity of the high M HA size distribution and the ∼440 kDa average molecular mass among thirteen individuals is also unexpected. For most biological fluids and tissues, HA is polydisperse but has higher average M, and little HA below about 1000 kDa. The average M is generally greater than ca. 2000 kDa, and usually in the range of 6000-8000 kDa, for HA isolated from bovine or human synovial fluid [10,40,41], for rabbit or owl monkey eye vitreous [10,20], for rooster comb [42], for human, rat or rabbit skin [26,43,44], and for other rabbit tissues such as skeletal muscle, lung, heart, small and large intestine [44]. There have been a few significant reports of low M HA. HA from human articular cartilage has a high M in young tissue, but is reduced in old tissue [45]. Low average M HA has been observed in bovine eye vitreous (ca. 500-800 kDa [20]), human serum (ca. 140-270 kDa [21]), human amniotic fluid at 16 weeks gestation (ca. 330 kDa [46], and is found as a component of highly polydisperse HA observed in tissue remodeling such as postpartum repair of murine cervix [47] or healing of excisional wounds in rat skin [26].
Several possible conditions may account for the ca. 440 kDa average size of the higher M component of milk HA. First, there may be degradation artifacts due to the purification procedures employed. This is unlikely since our degradation test shows that exogenous HA was not significantly degraded during our procedures. Secondly, HA may be degraded by endogenous processes in the mammary tissue during lactation, including degradation by reactive oxygen species, reactive nitrogen species, and/or hyaluronidases. The similarity in the HA size distribution among many samples would then suggest a well-controlled balance of the rate of synthesis with the rate of degradation. Thirdly, there could be preferential uptake in the mother's mammary epithelium of the larger HA molecules from the total produced polydisperse HA. The HA in human blood also has a M of 140-270 kDa, with concentrations from 19-23 ng/mL in healthy people to 169-705 ng/mL in patients with rheumatoid arthritis or primary biliary cirrhosis [21]. The 140-270 kDa HA in blood is believed to be the remaining product since the affinity of the liver endothelial cell HA receptorsis much greater for high M HA relative to medium sized M [21]. Another example is that the HA molecular mass in vitreous of cattle is age dependent, changing from 2-3 MDa for newborn calf to 500-800 kDa in adult bovine [20], possibly also due to the turnover process. Interestingly, the concentration of milk HA has been shown to decrease from an average of 500 ng/mL immediately postpartum period to ∼100 ng/mL at times greater than 60 days after birth [6]. A fourth possible reason is there is a distinct mechanism for producing specific sized HA during human milk HA synthesis. Our preliminary data (de la Motte- unpublished) shows that mice deficient in two of the three HAS genes, has1 and has3, still produce HA in milk comparable to wild type levels, suggesting that milk HA is a has2 product (This has not been confirmed in has2 null animals, as the mutation is embryonically lethal). If this association with HAS2 holds true in humans, however, this fourth possibility is not likely since HAS2 has been repeatedly shown to synthesize HA higher than 500 kDa [38,39]. Further investigations are needed to establish which mechanism(s) dictate the final size distribution of HA in human milk. The close similarity in the high M component size distribution for samples from thirteen donors suggests that the synthetic process and the degradative / turnover processes are highly coordinated. It also suggests that the overall HA size distribution including the constant presence of low M HA observed in twenty samples, is important for the function of human milk HA as a protective agent for the infant gut.
Supplementary Material
Acknowledgments
The authors thank Shardul Bhilocha and Anne Chudolij Khuong for useful experimental advice and assistance.
Funding: This work was supported by NIH [grant number R01 HD061918] awarded to C.A. de la Motte, and by the Fund for Neurodegeneration and Inflammation from NYU Polytechnic School of Engineering.
Abbreviations used
- HA
hyaluronan
- M
molecular mass
- IEX
ion exchange
- ELSA
enzyme linked sorbent assay
- HBD2
human beta defensin 2
- HMOs
human milk oligosaccharides
- MuBD3
murine beta defensin 3
- TLR4
toll-like receptor 4
- SEC-MALLS
size exclusion chromatography with multiangle laser light scattering
- CE
capillary electrophoresis
- SEC-ELSA
size exclusion chromatography-enzyme linked sorbent assay
- GEMMA
gas-phase electrophoretic mobility molecular analysis
- Stains-All™ dye
3,3′-dimethyl-9-methyl-4,5,4′,5′-dibenzothiacarbocyanine
- TBE
Tris-borate-EDTA
- NaCl
sodium chloride
- ERK
Extracellular signal-regulated kinases
- MAPK
Mitogen-activated protein kinase
- HAS
hyaluronan synthase
- bVG1
biotinylated versican G1 domain
Footnotes
Publisher's Disclaimer: This is a PDF file of an unedited manuscript that has been accepted for publication. As a service to our customers we are providing this early version of the manuscript. The manuscript will undergo copyediting, typesetting, and review of the resulting proof before it is published in its final citable form. Please note that during the production process errors may be discovered which could affect the content, and all legal disclaimers that apply to the journal pertain.
References
- 1.Newburg DS, Ruiz-Palacios GM, Morrow AL. Human milk glycans protect infants against enteric pathogens. Annu Rev Nutr. 2005;25:37–58. doi: 10.1146/annurev.nutr.25.050304.092553. [DOI] [PubMed] [Google Scholar]
- 2.Ballard O, Morrow AL. Human milk composition: nutrients and bioactive factors. Pediatr Clin North Am. 2013;60:49–74. doi: 10.1016/j.pcl.2012.10.002. [DOI] [PMC free article] [PubMed] [Google Scholar]
- 3.Bode L. Human milk oligosaccharides: every baby needs a sugar mama. Glycobiology. 2012;22:1147–1162. doi: 10.1093/glycob/cws074. [DOI] [PMC free article] [PubMed] [Google Scholar]
- 4.Newburg DS, Linhardt RJ, Ampofos SA, Yolken RH. Human Milk Glycosaminoglycans Inhibit HIV Glycoprotein gpl20 Binding to Its Host Cell CD4 Receptor. J Nutr. 1995;125:419–424. doi: 10.1093/jn/125.3.419. [DOI] [PubMed] [Google Scholar]
- 5.Coppa GV, Gabrielli O, Buzzega D, Zampini L, Galeazzi T, Maccari F, Bertino E, Volpi N. Composition and structure elucidation of human milk glycosaminoglycans. Glycobiology. 2011;21:295–303. doi: 10.1093/glycob/cwq164. [DOI] [PubMed] [Google Scholar]
- 6.Hill DR, Rho HK, Kessler SP, Amin R, Homer CR, McDonald C, Cowman MK, de la Motte CA. Human Milk Hyaluronan Enhances Innate Defense of the Intestinal Epithelium. J Biol Chem. 2013;288:29090–29104. doi: 10.1074/jbc.M113.468629. [DOI] [PMC free article] [PubMed] [Google Scholar]
- 7.Hill DR, Kessler SP, Rho HK, Cowman MK, de la Motte CA. Specific-sized hyaluronan fragments promote expression of human β-defensin 2 in intestinal epithelium. J Biol Chem. 2012;287:30610–30624. doi: 10.1074/jbc.M112.356238. [DOI] [PMC free article] [PubMed] [Google Scholar]
- 8.Min H, Cowman MK. Combined alcian blue and silver staining of glycosaminoglycans in polyacrylamide gels: application to electrophoretic analysis of molecular weight distribution. Anal Biochem. 1986;155:275–285. doi: 10.1016/0003-2697(86)90437-9. [DOI] [PubMed] [Google Scholar]
- 9.Kvam C, Granese D, Flaibani A, Zanetti F, Paoletti S. Purification and characterization of hyaluronan from synovial fluid. Anal Biochem. 1993;211:9–44. doi: 10.1006/abio.1993.1230. [DOI] [PubMed] [Google Scholar]
- 10.Lee HG, Cowman MK. An Agarose Gel Electrophoretic Method for Analysis of Hyaluronan Molecular Weight Distribution. Anal Biochem. 1994;219:278–287. doi: 10.1006/abio.1994.1267. [DOI] [PubMed] [Google Scholar]
- 11.Adam N, Ghosh P. Hyaluronan molecular weight and polydispersity in some commercial intra-articular injectable preparations and in synovial fluid. Inflamm Res. 2001;50:294–299. doi: 10.1007/PL00000247. [DOI] [PubMed] [Google Scholar]
- 12.Baggenstoss BA, Weigel PH. Size exclusion chromatography–multiangle laser light scattering analysis of hyaluronan size distributions made by membrane-bound hyaluronan synthase. Anal Biochem. 2006;352:243–251. doi: 10.1016/j.ab.2006.01.019. [DOI] [PMC free article] [PubMed] [Google Scholar]
- 13.Cowman MK, Chen CC, Pandya M, Yuan H, Ramkishun D, LoBello J, Bhilocha S, Russell-Puleri S, Skendaj E, Mijovic J, Jing W. Improved agarose gel electrophoresis method and molecular mass calculation for high molecular mass hyaluronan. Anal Biochem. 2011;417:50–56. doi: 10.1016/j.ab.2011.05.023. [DOI] [PubMed] [Google Scholar]
- 14.Bhilocha S, Amin R, Pandya M, Yuan H, Tank M, LoBello J, Shytuhina A, Wang W, Wisniewski H, de la Motte CA, Cowman MK. Agarose and polyacrylamide gel electrophoresis methods for molecular mass analysis of 5- to 500-kDa hyaluronan. Anal Biochem. 2011;417:41–49. doi: 10.1016/j.ab.2011.05.026. [DOI] [PMC free article] [PubMed] [Google Scholar]
- 15.Yuan H, Tank M, Alsofyani A, Shah N, Talati N, LoBello J, Kim JR, Oonuki Y, de la Motte CA, Cowman MK. Molecular mass dependence of hyaluronan detection by sandwich ELISA-like assay and membrane blotting using biotinylated hyaluronan binding protein. Glycobiology. 2013;23:1270–1280. doi: 10.1093/glycob/cwt064. [DOI] [PMC free article] [PubMed] [Google Scholar]
- 16.Hayase S, Oda Y, Honda S, Kakehi K. High-performance capillary electrophoresis of hyaluronic acid: determination of its amount and molecular mass. J of Chrom A. 1997;768:295–305. doi: 10.1016/s0021-9673(96)01095-3. [DOI] [PubMed] [Google Scholar]
- 17.Mahoney DJ, Aplin RT, Calabro A, Hascall VC, Day AJ. Novel methods for the preparation and characterization of hyaluronan oligosaccharides of defined length. Glycobiology. 2001;11:1025–1033. doi: 10.1093/glycob/11.12.1025. [DOI] [PubMed] [Google Scholar]
- 18.Volpi N. On-Line HPLC/ESI-MS Separation and Characterization of Hyaluronan Oligosaccharides from 2-mers to 40-mers. Anal Chem. 2007;79:6390–6397. doi: 10.1021/ac070837d. [DOI] [PubMed] [Google Scholar]
- 19.Yeung B, Marecak D. Molecular weight determination of hyaluronic acid by gel filtration chromatography coupled to matrix-assisted laser desorption ionization mass spectrometry. J of Chrom A. 1999;852:573–581. doi: 10.1016/s0021-9673(99)00647-0. [DOI] [PubMed] [Google Scholar]
- 20.Laurent UBG, Granath KA. The molecular weight of hyaluronate in the aqueous humour and vitreous body of rabbit and cattle eyes. Exp Eye Res. 1983;36:481–491. doi: 10.1016/0014-4835(83)90042-8. [DOI] [PubMed] [Google Scholar]
- 21.Tengblad A, Laurent UBG, Lilja K, Cahill RNP, Engström-Laurent A, Fraser JRE, Hansson HE, Laurent TC. Concentration and relative molecular mass of hyaluronate in lymph and blood. Biochem J. 1986;236:521–525. doi: 10.1042/bj2360521. [DOI] [PMC free article] [PubMed] [Google Scholar]
- 22.Sasaki Y, Uzuki M, Nohmi K, Kitagawa H, Kamataki A, Komagamine M, Murakami K, Sawai T. Quantitative measurement of serum hyaluronic acid molecular weight in rheumatoid arthritis patients and the role of hyaluronidase. Int J Rheum Dis. 2011;14:313–319. doi: 10.1111/j.1756-185X.2011.01683.x. [DOI] [PubMed] [Google Scholar]
- 23.Malm L, Hellman U, Larsson G. Size determination of hyaluronan using a gas-phase electrophoretic mobility molecular analysis. Glycobiology. 2012;22:7–11. doi: 10.1093/glycob/cwr096. [DOI] [PubMed] [Google Scholar]
- 24.Turner RE, Lin PY, Cowman MK. Self-association of hyaluronate segments in aqueous NaCl solution. Arch Biochem Biophys. 1988;265:484–495. doi: 10.1016/0003-9861(88)90153-1. [DOI] [PubMed] [Google Scholar]
- 25.Haserodt S, Aytekin M, Dweik RA. A comparison of the sensitivity, specificity and molecular weight accuracy the three different commercially available hyaluronan ELISA-like assays. Glycobiology. 2011;21:175–183. doi: 10.1093/glycob/cwq145. [DOI] [PubMed] [Google Scholar]
- 26.Tolg C, Hamilton SR, Zalinska E, McCulloch L, Amin R, Akentieva N, Winnik F, Savani R, Bagli DJ, Luyt LG, Cowman MK, McCarthy JB, Turley EA. A RHAMM mimetic peptide blocks hyaluronan signaling and reduces inflammation and fibrogenesis in excisional skin wounds. Am J Pathol. 2012;181:1250–1270. doi: 10.1016/j.ajpath.2012.06.036. [DOI] [PMC free article] [PubMed] [Google Scholar]
- 27.Weissmann B, Meyer K, Sampson P, Linker A. Isolation of oligosaccharides enzymatically produced from hyaluronic acid. J Biol Chem. 1954;208:417–429. [PubMed] [Google Scholar]
- 28.Nebinger P. Comparison of gel permeation and ion-exchange chromatographic procedures for the separation of hyaluronate oligosaccharides. J Chromatogr. 1985;320:351–359. [Google Scholar]
- 29.Holmbeck S, Lerner L. Separation of hyaluronan oligosaccharides by the use of anion-exchange HPLC. Carbohydr Res. 1993;239:239–244. doi: 10.1016/0008-6215(93)84218-u. [DOI] [PubMed] [Google Scholar]
- 30.Tawada A, Masa T, Oonuki Y, Watanabe A, Matsuzaki Y, Asari A. Large-scale preparation, purification, and characterization of hyaluronan oligosaccharides from 4-mers to 52-mers. Glycobiology. 2002;12:421–426. doi: 10.1093/glycob/cwf048. [DOI] [PubMed] [Google Scholar]
- 31.Hoffman P, Meyer K, Linker A. Transglycosylation during the mixed digestion of hyaluronic acid and chondroitin sulfate by testicular hyaluronidase. J Biol Chem. 1956;219:653–663. [PubMed] [Google Scholar]
- 32.Yamashina I, Makino M, Miyakoshi Y, Sakai K. Chromatographic separation of sulfated oligosaccharides. Biochim Biophys Acta. 1963;74:295–297. [PubMed] [Google Scholar]
- 33.Inoue Y, Nagasawa K. Depolymerization of glycosaminoglycuronans into di- and higher molecular-weight oligo-saccharides: improved preparation of N-acetyldermosine and oligomeric N-acetylchondrosines. Carbohydr Res. 1981;97:263–278. doi: 10.1016/s0008-6215(00)80672-2. [DOI] [PubMed] [Google Scholar]
- 34.Lauder RM, Huckerby TN, Nieduszynski IA. A fingerprinting method for chondroitin/dermatan sulfate and hyaluronan oligosaccharides. Glycobiology. 2000;10:393–401. doi: 10.1093/glycob/10.4.393. [DOI] [PubMed] [Google Scholar]
- 35.Martins JRM, Passerotti CC, Maciel RMB, Sampaio LO, Deitrich CP, Nader HB. Practical determination of hyaluronan by a new noncompetitive fluorescence-based assay on serum of normal and cirrhotic patients. Anal Biochem. 2003;319:65–72. doi: 10.1016/s0003-2697(03)00251-3. [DOI] [PubMed] [Google Scholar]
- 36.Meran S, Luo DD, Simpson R, Martin J, Wells A, Steadman R, Phillips AO. Hyaluronan facilitates transforming growth factor-β1 -dependent proliferation via CD44 and epidermal growth factor receptor interaction. J Biol Chem. 2011;286:17618–17630. doi: 10.1074/jbc.M111.226563. [DOI] [PMC free article] [PubMed] [Google Scholar]
- 37.Puré E, Assoian RK. Rheostatic signaling by CD44 and hyaluronan. Cell Signal. 2009;21:651–655. doi: 10.1016/j.cellsig.2009.01.024. [DOI] [PMC free article] [PubMed] [Google Scholar]
- 38.Spicer AP, Tien JY. Hyaluronan and morphogenesis. Birth Defects Res C Embryo Today. 2004;72:89–108. doi: 10.1002/bdrc.20006. [DOI] [PubMed] [Google Scholar]
- 39.Itano N, Sawai T, Yoshida M, Lenas P, Yamada Y, Imagawa M, Shinomura T, Hamaguchi M, Yoshida Y, Ohnuki Y, Miyauchi S, Spicer AP, McDonald JA, Kimata K. Three isoforms of mammalian hyaluronan synthases have distinct enzymatic properties. J Biol Chem. 1999;274:25085–25092. doi: 10.1074/jbc.274.35.25085. [DOI] [PubMed] [Google Scholar]
- 40.Balazs EA. Viscoelastic Properties of Hyaluronic Acid and biological lubrication. Univ Mich Med Cent J. 1968:255–259. [PubMed] [Google Scholar]
- 41.Dahl LB, Dahl IM, Engström-Laurent A, Granath K. Concentration and molecular weight of sodium hyaluronate in synovial fluid from patients with rheumatoid arthritis and other arthropathies. Ann Rheum Dis. 1985;44:817–822. doi: 10.1136/ard.44.12.817. [DOI] [PMC free article] [PubMed] [Google Scholar]
- 42.Swann DA. Studies on hyaluronic acid. I. The preparation and properties of rooster comb hyaluronic acid. Biochim Biophys Acta. 1968;156:17–30. [PubMed] [Google Scholar]
- 43.Tammi R, Agren UM, Tuhkanen AL, Tammi M. Hyaluronan metabolism in skin. Prog Histochem Cytochem. 1994;29:1–81. doi: 10.1016/s0079-6336(11)80023-9. [DOI] [PubMed] [Google Scholar]
- 44.Armstrong SE, Bell DR. Measurement of high-molecular-weight hyaluronan in solid tissue using agarose gel electrophoresis. Anal Biochem. 2002;308:255–264. doi: 10.1016/s0003-2697(02)00239-7. [DOI] [PubMed] [Google Scholar]
- 45.Holmes MW, Bayliss MT, Muir H. Hyaluronic acid in human articular cartilage. Age-related changes in content and size. Biochem J. 1988;250:435–441. doi: 10.1042/bj2500435. [DOI] [PMC free article] [PubMed] [Google Scholar]
- 46.Dahl LB, Dahl IM, Børresen AL. The molecular weight of sodium hyaluronate in amniotic fluid. Biochem Med Metab Biol. 1986;35:219–226. doi: 10.1016/0885-4505(86)90077-0. [DOI] [PubMed] [Google Scholar]
- 47.Ruscheinsky M, De la Motte CA, Mahendroo M. Hyaluronan and its binding proteins during cervical ripening and parturition: dynamic changes in size, distribution and temporal sequence. Matrix Biol. 2008;27:487–497. doi: 10.1016/j.matbio.2008.01.010. [DOI] [PMC free article] [PubMed] [Google Scholar]
Associated Data
This section collects any data citations, data availability statements, or supplementary materials included in this article.