

Abstract
Neurotransmitter homeostasis in and around a synapse involves complex random processes such as diffusion, molecular binding and uptake by glial transporters. A three-dimensional stochastic diffusion model of a synapse was developed to provide molecular level details of neurotransmitter homeostasis not predicted by alternative models based on continuum approaches. The development was illustrated through an example case cortico-accumbens synapse that successfully integrated neuroadaptations observed after chronic cocaine. By incorporating cystine–glutamate exchanger as a non-synaptic release site for glutamate, the stochastic model was used to quantify the relative contributions of synaptic and non-synaptic sources to extracellular concentration, and to estimate molecular influx rates into the perisynapse. A perturbation analysis showed that variation in surface density of glial transporters had the largest effect on glutamate concentrations, amongst the parameters considered. The stochastic diffusion model of the example synapse was further generalized to characterize glial morphology by studying the role of diffusion path length in supporting neurotransmitter gradients and isolating the synapse. For the same set of parameters, diffusion path length was found to be proportional to the gradient supported.
1. Introduction
A typical chemical synaptic environment has substantial morphological specialization that reflects functional requirements in controlling the movement of substances. The glial environment is a critical regulator of communication and cross talk between synapses (Barbour, 2001; Rusakov, 2001; Franks, Bartol, & Sejnowski, 2002; Savtchenko & Rusakov, 2007; Zheng, Scimemi, & Rusakov, 2008), and probably of the overall extrasynaptic transmission in the central nervous system (Bergles & Jahr, 1997; Danbolt, 2001). Besides the structure of the perisynaptic glial environment, a number of mechanisms participate in the synaptic tuning of circuits in brain tissue that contribute to synaptic efficacy, plasticity, and neurotransmitter homeostasis in the extracellular space (ECS; Zheng et al., 2008). These mechanisms include vesicular release, neurotransmitter diffusion into the perisynapse, receptor activity (e.g., AMPA and NMDA), inhibition of synaptic vesicular release via activation of negative feedback autoreceptors (e.g., mGluR2/3), binding to and uptake by glial transporters, and non-synaptic neurotransmitter production (e.g., via cystine–glutamate exchange located primarily on glia). However, the specifics of how the glial environment and the various mechanisms involved achieve neurotransmitter homeostasis are not completely understood. Further, the presence of multiple interacting parameters makes it difficult to achieve precise experimental control near a single synapse. Therefore, an alternative is to construct a computational model to study the role of glial morphology and associated mechanisms in shaping the neurotransmitter landscape and receptor activity.
Previous modeling studies related to neurotransmitter time courses (e.g., glutamate) have focused on synaptic receptor activation (Clements et al., 1992; Franks et al., 2002) and have determined the accessibility of synaptically released neurotransmitter to the ECS, by considering diffusion out of the synapse and elimination by glial transporters (Barbour, 2001; Diamond, 2005). These neurotransmitter diffusion models have relied on simple geometric representations of ECS, and were based on analytical (Holmes, 1995; Kleinle et al., 1996), continuum (Rusakov & Kullmann, 1998; Rusakov, 2001) or stochastic approaches (Clements, 1996; Stiles, Van Helden, Bartol, Salpeter, & Salpeter, 1996; Franks et al., 2002; Tao & Nicholson, 2004; Savtchenko & Rusakov, 2007; Zheng et al., 2008).
Chronic cocaine administration causes instability of extracellular glutamate levels in the nucleus accumbens, a brain nucleus critical for cocaine reward and relapse (Koob & LeMoal, 2001; Kalivas, Volkow, & Seamans, 2005). A failure of the prefrontal cortex to control drug-seeking behaviors can be linked to an enduring imbalance between synaptic and non-synaptic glutamate, termed glutamate homeostasis and this imbalance engenders changes in neuroplasticity that impair communication between the prefrontal cortex and the nucleus accumbens (Kalivas, 2009). Further, after withdrawal from cocaine, extrasynaptic glutamate levels are reduced in the nucleus accumbens due to down-regulation of cystine–glutamate exchange (Baker et al., 2003; Kau et al., 2008). As well, during cocaine relapse the release of synaptic glutamate in cortico-accumbens synapse is augmented due to reduced tone by extracellular glutamate on release regulating presynaptic metabotropic glutamate receptors (Moran et al., 2005), and due to impaired elimination of extracellular glutamate via a reduction in glutamate uptake into glia (Knackstedt, Melendez & Kalivas, 2010). Pendyam, Mohan, Kalivas, & Nair, (2009) reported a compartmental model of the synaptic environment based on a continuum approach that successfully modeled the cocaine-induced neuropathology at glutamatergic synapses on accumbens spiny neurons. By incorporating cystine–glutamate exchanger as a non-synaptic release site for glutamate, they showed how cocaine–induced neuroadaptations influence glutamate transmission at accumbens glutamatergic synapses, and predicted the subsequently discovered cocaine-induced down-regulation of the glial glutamate transporter (Knackstedt et al., 2010). The compartmental model used in Pendyam et al. (2009) was extended in the present study to provide molecular level details of neurotransmitter homeostasis that could not be predicted by alternative models based on continuum approaches. This was done by developing a three–dimensional stochastic diffusion model of a cortico-accumbens synapse (see Figure 1; explained later). The molecular diffusion model considered a realistic morphological representation of glia and ECS. The model was then generalized to quantify the role of diffusion path length (defined as the distance that a molecule travels from the synaptic cleft to the ECS) in supporting neurotransmitter gradients, by considering several candidate glial configurations.
Figure 1.
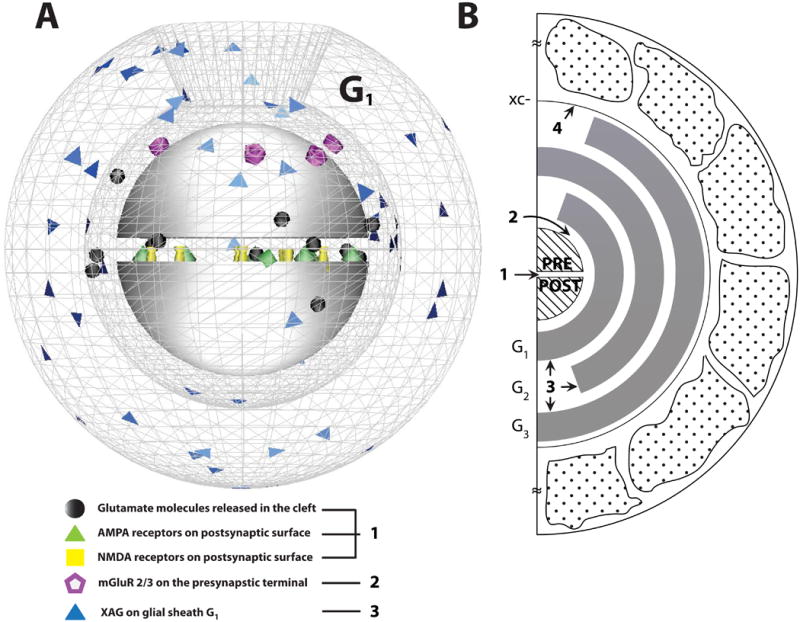
A. A three-dimensional (3-D) representation of the cortico-accumbens synapse. Glutamate molecules diffuse across the synaptic cleft (height: 30 nm) separated the two hemispheres of radius r = 160 nm. The postsynaptic surfaces were populated with ionotropic receptors (AMPA and NMDA). The metabotropic glutamate receptors (mGluR2/3) were located at φ = 20° around the presynaptic terminal, with glutamate transporters (XAG), populated on the glial sheath surface (G1). The impermeable glial sheath G1 is represented as a wireframe mesh with opening on the top. The other glial sheaths, G2 and G3, are oriented as shown in panel B (not shown). The 3-D model was rendered using DReAMM software. B. Two-dimensional (2-D) representation of the 3-D cortico-accumbens synapse used to study glutamate homeostasis. The synapse was surrounded by glial sheaths (Gi, i = 1–3; i = 1 being the closest to the synapse) with the highest density of XAG in G1. Diffusion path length was defined as the distance that a molecule travels from the synaptic cleft to the ECS (i.e., from the center of the synaptic cleft to the G3 opening). Each glial sheath was 100 nm thick with binding, uptake and efflux modeled as stochastic processes. Cystine-glutamate exchanger (xc-) was incorporated as the non-synaptic release site for glutamate and modeled on the outer surface of glial sheath G3. The complex structural geometry in the porous ECS consisted of glial boulders randomly placed in the porous neuropil to yield experimental estimates of volume fraction. [Glu]syn, [Glu]mGluR and [Glu]ex represented glutamate concentrations measured within the synaptic cleft, near mGluR2/3 and extracellular space beyond glial sheath G3 respectively. The numbers labeled represent the location of the molecular reactions. 1. Ionotropic receptor reactions (see Eqns. 2.4.1 A and B). 2. Metabotropic receptor reactions (see Eqn. 2.4.2). 3. Glial XAG reactions (see Eqns. 2.4.3 and 2.4.4). 4. Non-synaptic glutamate (xc-, see Eqn. 2.4.5).
2. Methods
An example case of a cortico-accumbens synapse was used to illustrate the proposed computational framework. The molecular diffusion model was constrained using biological data, including known parameter ranges (see Table 1) as described next.
Table 1.
Ranges of parameter values for the example case cortico-accumbens synapse in Figure 1.
| Parameter | Model valuea | Range of values (citation) |
|---|---|---|
|
| ||
| Diffusion coefficient (μm2/ms) | 0.085 | 0.05–0.75 (Rusakov & Kullmann, 1998; Saftenku, 2005) |
|
| ||
| xc- (mM hr−1) | 17b | 5–50 (Baker et al., 2003) |
|
| ||
| AMPA/NMDA dynamics | ||
|
| ||
| AMPA k C0C1/k C1C0, (M−1s−1)/(s−1) k C1C2/k C2C1, (M−1s−1)/(s−1) k C2O/k OC2, (s−1)/(s−1) k C1C3/k C3C1, (S−1)/(s−1) k C3C4/k C4C3, (M−1 s−1)/(s−1) k C2C4/k C4C2, (S−1)/(s−1) k C4C5/k C5C4, (S−1)/(s−1) k OC5/k C5O, (S−1)/(s−1) |
4.59×10⁶/4.26×103, 2.84×10³/3.26×103, 4.24×10³/900, 2.89×10³/39.2, 1.27×10⁶/45.7, 172/0.727, 16.8/190.4, 17.7/4.0 |
(Jonas, Major, & Sakmann, 1993; Franks et al., 2002, Attwell & Gibb, 2005) |
| NMDA k C0C1/k C1C0, (M−1s−1)/(s−1) k C1C2/k C2C1, (M−1s−1)/(s−1) k C2O/k OC2, (s−1)/(s−1) k C2C3/k C3C2, (s−1)/(s−1) |
2.0×5.0×106/4.7, 5.0×10⁶/2.0×4.7, 46.5/91.6, 8.4/1.8 |
(Lester & Jahr, 1992; Franks et al., 2002, Attwell & Gibb, 2005) |
|
| ||
| Transporter dynamics | ||
|
| ||
| XAG (molecules/μm2) | see ‘c’ below | 2,500–10,000 (Bergles & Jahr, 1997; Lehre & Danbolt, 1998) |
|
| ||
| k 1 (M−1 ms−1)/k −1 (ms−1)/k2 (ms−1) | 104/0.2/0.1 | 104/0.2/0.1 (Lehre & Rusakov, 2002) |
|
| ||
| Release parameters | ||
|
| ||
| No. of molecules per release | 22,000 | 4,700–80,000 (Bruns & Jahn, 1995) |
|
| ||
| Kd value of mGluR2/3 (μM) | 0.187 | 0.1–0.3 (Schoepp & True, 1992) |
|
| ||
| Maximum release probability | 0.4 (max) | 0.1–0.5 (Billups et al., 2005; Volynski, Rusakov, & Kullmann, 2006) |
|
| ||
| Release probability used (tuned to operate near Kd value of mGluR) | 0.12 (basal) | (based on log-linear interpolation from values citied in Xi et al., 2002) |
|
| ||
| Presynaptic firing frequencies | ||
|
| ||
| Firing freq (Hz; basal) | 1–2 | 1–3 (Trantham et al., 2002) |
|
| ||
| Firing freq (Hz; natural reward seeking) | 12–15 | 12–15 (Chang et al., 1997; Sun & Rebec, 2006) |
|
| ||
| Geometric parameters | ||
| Average extracellular gap (nm) | 40 | 34–68 (Thorne & Nicholson, 2006) |
|
| ||
| Intersynaptic distance (μm) | 2 | 2–20 (Rusakov, 2001) |
Values used to populate the configuration in Figure 1
Surface density (molecules/μm2) of xc- was distributed on the outer surface of glial sheath G3 as follows for the control cases: 111; corresponding molecules of xc—471
Surface density (molecules/μm2) of XAG was distributed as follows for the control cases: G1–1700, G2–400, and G3–400; corresponding molecules of XAG: G1–2771, G2–1490, and, G3–2708
2.1 Model Inputs
Firing frequency and molecules per release
For the glutamatergic cortico-accumbens synapse example case, basal presynaptic firing frequency ranged from 1–3 Hz (Trantham, Szumlinkski, McFarland, Kalivas, & Lavin, 2002), with burst frequencies up to 15 Hz during natural reward seeking behavioral states (Chang, Zhang, Janak, & Woodward, 1997; Sun & Rebec, 2006). Neurotransmitter release from a nerve terminal during exocytosis depends on the size of the synapse, vesicular properties such as volume, neurotransmitter concentration and number available, and geometric parameters such as diameter of the fusion pore (Danbolt, 2001). For general synapses, molecules per release typically vary from 4,000–80,000 (Bruns & Jahn, 1995), and this was the range used in the study (see Table 1).
Autoreceptor regulation of release probability
Release probability is regulated following the stimulation of presynaptic autoreceptors (e.g., mGluR2/3–glutamate; Billups, Graham, Wong, & Forsythe, 2005), which are located outside the synaptic cleft (Alagarsamy, Sorensen, & Conn, 2001). The probability that an action potential results in a vesicular release ranges from <0.1 to 1 (Murthy & Sejnowski, 1997). For the example case considered, GTPγS binding revealed that G protein signaling by stimulating mGluR2/3 increased as a logarithm of agonist dose (Xi, Baker, Shen, Carson, & Kalivas, 2002); hence the relationship between release probability and percentage occupancy of autoreceptors was assumed to be logarithmic. Percentage occupancy was defined as the ratio of the number of mGluR2/3 activated by the diffusing glutamate molecules in the model to the total number of mGluR2/3 present. Using the relationship between release probability and % occupancy, the mGluR2/3 autoreceptor function was modeled as a change in release probability from 0.12 (basal) to 0.10 (natural reward seeking; see Table 1). The release probability was iteratively determined to satisfy model constraints as discussed later. Thus, each action potential in the model resulted in an instantaneous release of molecules into the cleft. For example, a firing frequency of 2 Hz had a release probability of 0.12 in the control basal case, and, on average, it resulted in a release event every 4.17 seconds.
Ionotropic receptors
Synaptic receptors (AMPA and NMDA) were co-localized in the cleft with an AMPA/NMDA ratio of 0.81±0.33 (n = 17; mean±sd; unpublished data) based on the maximum peak height of the current obtained during basal conditions in the nucleus accumbens. This was in the range of previous reports that measured AMPA/NMDA ratio in accumbens brain slices (Thomas, Beurrier, Bonci, & Malenka, 2001; Wolf et al., 2005; Kourrich, Rothwell, Klug, & Thomas, 2007; Conrad et al., 2008).
Diffusion
Diffusion of neurotransmitter in the ECS is complicated by several factors such as glial geometry, receptor binding, transporter uptake, viscosity, temperature, change in structure with time (Nicholson, 2001; Franks et al., 2002; Habre, Harbetova, & Segeth, 2004; Sykova, 2004; Diamond, 2005; Saftenku, 2005) and change in local properties with pathology (e.g., volume fraction; Sykova, 1997). Diffusion in the porous neuropil is typically characterized by volume fraction α (void space/total tissue volume) and tortuosity λ (hindrance to diffusion imposed by local boundaries or local viscosity; Nicholson, 2001). Volume fraction α in brain tissue is estimated to be around 0.2 (Nicholson & Sykova, 1998) while tortuosity λ is estimated to be in the range, 1.2–2.4 based on diffusion measurements over a distance of 100–300 μm (Nicholson, 2001). However, experimental estimates of diffusion coefficients (D) in the perisynaptic region (i.e., <1 μm from cleft) have not been reported for synapses with tightly packed glia (Rusakov & Kullmann, 1998; Hrabe et al., 2004). Hence, in the proposed model D was iteratively determined in the range, 0.05–0.41 μm2/ms (Saftenku, 2005; see Table 1) to satisfy model constraints described later.
Glutamate Transporters
Glial transporters (XAG) modulate glutamate transmission by regulating neurotransmitter access to glutamate receptors and to ECS, thus maintaining appropriate neurotransmitter gradients (Danbolt, 2001; Zheng et al., 2008; Pendyam et al., 2009). XAG present on glial membranes (Danbolt, 2001) have surface densities ranging from 2,500–10,000 molecules/μm2 (Bergles & Jahr, 1997; Lehre & Danbolt, 1998). For the present model, equivalent surface density of XAG was determined iteratively within the cited range to satisfy model constraints listed in Table 2.
Table 2.
Steady state neurotransmitter concentration constraints for the example case cortico-accumbens synapse.
| Parameter (μM) | Control | Cocaine | ||
|---|---|---|---|---|
| Basal | Natural Rewards | Basal | Drug Seeking | |
| [Glu]syn | ∼0.1 | ∼0.1 | - | - |
| Reference | Patneau & Mayer, 1990 | Patneau & Mayer, 1990 | ||
| [Glu]mGluR | 0.1–0.3 | 0.1–0.3 | - | - |
| Reference | Schoepp & True, 1992 | Schoepp & True, 1992 | ||
| [Glu]ex | 5.6±1.0 | 5.6±1.0 | 2.89±0.34 | 13.3±1.4 |
| Reference | Baker et al., 2003 | Baker et al., 2003 | Szumlinkski et al., 2003; McFarland et al., 2003; McFarland et al., 2004 | |
| Model estimates at varying firing frequencies using control and cocaine parameters averaged across 10 trials | ||||
| [Glu]syn | 0.16 | 0.19 | 0.28 | 1.33 |
| [Glu]mGluR | 0.21 | 0.22 | 0.32 | 1.51 |
| [Glu]ex | 4.79±0.04 | 5.32±0.06 | 3.29±0.04 | 12.50±0.05 |
Cystine–glutamate exchanger
Estimated extracellular concentrations of glutamate can vary from 25 nM (Herman & Jahr, 2007) to 5 μM (Baker et al., 2003). In vivo extrasynaptic concentrations assessed by microdialysis revealed that the majority of glutamate outside of the synaptic cleft is not of synaptic origin (Timmerman & Westerink, 1997; Melendez, Vuthiganon, & Kalivas, 2005). Also, extracellular glutamate in tissue slices and cell culture experiments is partly of non-synaptic origin (Haydon, 2001; Le Meur, Galante, Anulo, & Audinat, 2007). While a number of sources of non-synaptic extracellular glutamate have been suggested (Danbolt, 2001; Haydon, 2001; Baker et al., 2003; Cavelier, Hamann, Rossi, Mobbs, & Attwell, 2005), extracellular glutamate measured by microdialysis in the accumbens arises primarily from cystine–glutamate exchange (xc-; Xi et al., 2002; Baker et al., 2003). The production rate of xc- was in the range of 5–50 mM hr−1 (also see Pendyam et al., 2009) and was estimated iteratively by varying the surface density of xc- on glia to satisfy model constraints as discussed later (see Table 1).
2.2 Cocaine–induced neuroadaptations
As cited, chronic cocaine administration causes instability in extracellular glutamate in the nucleus accumbens, a brain nucleus critical for cocaine reward and relapse (Koob & LeMoal, 2001; Kalivas et al., 2005). Rats withdrawn from chronic cocaine administration show dysregulation of extracellular glutamate in the nucleus accumbens due, in part, to reduced xc- and mGluR2/3 signaling (Baker et al., 2003). Microdialysis measurements during drug–seeking conditions have shown a significant overflow of synaptic glutamate (McFarland, Lapish, & Kalivas, 2003; McFarland, Davidge, Lapish, & Kalivas, 2004). Other changes included alterations in the following: glutamate release (McFarland et al., 2003), postsynaptic glutamate signaling (Conrad et al., 2008), group II metabotropic glutamate receptors (mGluR2/3; Xi et al., 2002) and AMPA/NMDA ratio. Based on these experimental findings, xc- production was reduced by 50 %, the mGluR2/3 autoreceptor function was modeled as a change in release probability from 0.32 (cocaine basal) to 0.30 (cocaine drug seeking) and AMPA/NMDA ratio was changed to 1.15±0.41 (n=12; unpublished data). As cited, by incorporating cystine–glutamate exchange as a non-synaptic release site for glutamate, Pendyam et al.,(2009) were able to show how cocaine–induced neuroadaptations influence glutamate transmission at accumbens glutamatergic synapses, and predicted the subsequently discovered cocaine-induced down-regulation of the glial glutamate transporter (Knackstedt et al., 2010). The stochastic approach was also employed to verify this finding, as discussed later.
2.3 Development of the stochastic model
The stochastic molecular diffusion model was created using the MCell program (ver. 3.1.812), a general Monte Carlo simulator designed for cellular microphysiology studies (Stiles et al., 1996; Stiles & Bartol, 2001; Kerr et al., 2008). A three-dimensional spatially realistic model of the cortico-accumbens synapse was constructed using the software Blender (www.blender.org), an open source, modeling and animation package that can export Model Description Language (MDL) files to MCell. The MDL files are used to specify the types of molecules in the model, their diffusion constants, initial locations, reactions and stoichiometry (Czech et al., 2009). To facilitate visual rendering and checking by animating simulation, MCell exports mesh objects, molecule, receptor site positions and their states to the DReAMM program (www.mcell.psc.edu) in a suitable format, with molecule positions recorded at every time step. This requires PSC DX which is derived from OpenDX but improved in several aspects. The model developed in MCell allows the integration of mechanisms, kinetics, and stochastic behaviors at the molecular level with structural organization and function at the cellular level.
The representative model geometry was built in silico with meshes (geometric surfaces) being reflective to diffusing molecules. Meshes that were populated with different types of surface molecules (e.g., mGluR2/3, XAG) were first triangulated and each element was tiled using barycentric subdivision. A large number of bimolecular reactions were defined (described later) with associated rate constants to investigate receptor occupancy/opening, uptake and neurotransmitter homeostasis.
The geometry of the example case cortico-accumbens (see Figure 1) consisted of a synapse surrounded by assemblies of simplified glial sheaths (Gi) with porous space between them (Rusakov, 2001) as observed in vivo (Rusakov & Kullmann, 1998). The configuration in Figure 1 was modeled with an average porous gap of 40 nm (Thorne & Nicholson, 2006) between the impermeable glial sheaths (G1–3). Each glial sheath was 100 nm (Rusakov, 2001) thick based on the minimum width of glial profiles observed in electron micrograph studies. The structure of an individual glial sheath was akin to that previously reported (Rusakov, 2001; Pendyam et al., 2009) but the multiple sheaths (G1–3) were configured iteratively to satisfy model constraints listed in Table 2. The postsynaptic surfaces of the synaptic cleft (height: 30 nm) were populated with ionotropic receptors (AMPA and NMDA). The metabotropic glutamate receptors (mGluR2/3) were located at φ = 20° around the presynaptic terminal and the glial glutamate transporters, XAG, were distributed on the glial sheath surface (G1–3, see Figure 1). Based upon studies indicating that the highest densities of XAG were closer to the synapse (Danbolt, 2001; Lehre & Danbolt, 1998), G1 had the highest surface density of XAG (see Table 1). The non-synaptic release sites for glutamate, namely, cystine–glutamate exchanger, xc-, were modeled as being located on the outer surface of the glial sheath G3. Beyond G3, the porous ECS contained randomly placed glial boulders of varying dimensions without surface populated XAG or xc-. The configurations of the glial sheaths and boulders in the model were iteratively varied to obtain a volume fraction of ∼0.23 (Sykova, 2004). Further, the total number of spines along the length of the dendritic segment was found to be approximately 10 spines/10 μm (Robinson & Kolb, 1999). Assuming that 50 % of these had projections from the prefrontal cortex (PFC), each synapse could have an average intersynaptic distance of 1 μm. Thus, a no–flux boundary condition was imposed at the outer edge of the model (∼1 μm from the edge of the synapse) such that no molecules entered or left the outer boundary and thus, simulated identical neighboring synapses.
Tortuosity is a composite parameter that contains a significant geometrical component, although other factors such as interstitial viscosity may contribute (Tao, Tao, & Nicholson, 2005). However, in the MCell simulator the geometric and viscous components of tortuosity are not combined. A lower diffusion coefficient than water (<1 μm2/ms) is attributed to the microscopic viscous drag on the diffusing molecule at atomically fine spatial scales. This would include the molecule interactions with the proteins and microfilaments in the ECS. The additional interactions that the molecules have with larger scale diffusion barriers such as spines, small axonal boutons and glia fall under geometric tortuosity. This is not accounted for in the diffusion coefficient, D. Hence, to compute the geometric tortuosity, we performed experiments with a point source as outlined in Tao & Nicholson (2004). This required the elimination of all the reactions (discussed in the next section) that the diffusing molecules have with receptors and transporters, i.e., all such reactions were turned off. The estimated effective diffusion constant was approximately 10 times smaller than the microscopic D value for the glutamate molecule. This resulted in a tortuosity value of 3.16 for the configuration in Figure 1.
Concentration within the synaptic cleft (of volume 2.29 × 10⁻³ μm3) represented as, [Glu]syn, and near mGluR2/3 (located at φ = 20° with a volume 1.25 × 10⁻⁴ μm) represented as, [Glu]mGluR, were computed using the total number of free glutamate molecules in the respective regions after reaching homeostasis. The experimentally defined concentrations of glutamate in the extracellular space (ECS of volume 1.418 μm3) represented as, [Glu]ex, and reported by in vivo microdialysis (Baker et al., 2003; McFarland et al., 2003, 2004; Szumlinski et al., 2006) during control and cocaine conditions were modeled as being outside glial sheath G3. After the transient phase (i.e., 50 ms after a synaptic release), the concentration stabilized leading to a uniform profile and thus homeostatic [Glu]syn, [Glu]mGluR, and [Glu]ex, were spatially averaged in the respective regions for 1000 ms for the control and cocaine cases.
Thus, upon release from the center of the synapse, glutamate molecules diffused across the synaptic cleft to activate ionotropic receptors on the post synaptic terminal. Uptake of diffusing molecules outside the cleft occurred via molecular reactions with surface populated glutamate transporters located on the glial surfaces. Details related to the implementation of diffusion–reaction systems on surfaces and in a solution used by MCell can be found in Kerr et al. (2008).
2.4 Implementation of the kinetics and reaction schemes
The diffusing glutamate molecules stochastically interacted with the surface populated receptors (AMPA, NMDA, mGluR2/3 and XAG) based on the reaction schemes described in Franks et al., (2002) and Rusakov (2001). Upon release, glutamate molecules reacted with synaptic receptors (e.g., AMPA and NMDA) following the kinetic schemes in Eqns. 2.4.1 A and 2.4.1 B respectively,
| (2.4.1 A) |
| (2.4.1 B) |
where all receptors were in state C0 (closed state) before release. Upon binding with molecules of glutamate [Glu], the receptors changed states as shown. C1 and C2 correspond to the single and double liganded closed states respectively, with C3, C4, C5 representing the other intermediate states and O representing the open state of the receptor. The rate constants describing the AMPA and NMDA receptor kinetics were adapted from Franks et al., (2002) who based it on previously published work by Jonas, Major, & Sakmann (1993) for AMPA and Lester & Jahr (1992) for NMDA (see Table 1).
The kinetic scheme for the mGluR2/3 binding to diffusing glutamate was given by Eqn. (2.4.2)
| (2.4.2) |
where, [Glu], [R], and [GluR] represented the molecules of glutamate, metabotropic glutamate receptors (mGluR2/3), and the glutamate–receptor bound complex, respectively. Unlike AMPA and NMDA, due to the lack of experimental data, the binding kinetics for mGluR2/3 of k1 = 105 M−1ms−1 and k−1 = 18×10-3ms−1 were iteratively determined based on the disassociation constant Kd (∼0.187 nM; Schoepp & True, 1992) to satisfy nominal values of glutamate concentration near mGluR2/3 and to simultaneously achieve ∼85% mGluR2/3 occupancy in order to establish autoreceptor tone during control basal conditions.
The surface populated XAG on the glial sheaths G1–3 interacted with the diffusing glutamate molecules as per the reaction scheme in Eqn. (2.4.3),
| (2.4.3) |
where, [XAG], and [Glu–XAG] represented the glial glutamate transporters, and the glutamate-transporter complex, respectively, and [Gluin] represented the uptake of glutamate by XAG. The kinetics for XAG of k1 = 104 M−1ms−1, k−1 = 0.2 ms−1, and k2 = 0.1 ms−1 were taken from Rusakov (2001) who based it on experiments by others (Wadiche, Arriza, Amara, & Kavanaugh, 1995; Bergles & Jahr, 1997). [GluD] represented the glutamate removed from the system in the glia, and was given by Eqn. (2.4.4), with a rate k3 = 0.026 ms−1 (Geiger, Roth, Taskin, & Jonas, 1999).
| (2.4.4) |
The glial surfaces were modeled as being reflective to diffusing molecules with no intracellular diffusion mechanism modeled within the glia.
As cited, cystine–glutamate exchanger, xc-, was incorporated as the non-synaptic release source for glutamate and was modeled outside glial sheath G3. The kinetic scheme for xc- to release glutamate molecules into the ECS of volume 1.418 μm3 was given by Eqn. (2.4.5),
| (2.4.5) |
where, [CG] represented the cystine–glutamate exchanger, xc-, producing glutamate at the rate k4 = 0.092 ms−1 (17 mM hr−1; Pendyam et al., 2009).
Iterative evaluation
The iterative process began with values in the lower end of the ranges for the parameters (for e.g., number of molecules, D, XAG and xc- surface density) reported in Table 1, while monitoring [Glu]syn, [Glu]mGluR, [Glu]ex and mGluR2/3 occupancy. As part of the iterative process, we compared mGluR2/3 occupancy and the release probability used, to check if they satisfied the log-linear function; if not the release probability was adjusted. Once determined for a particular case, there was no change in release probability during the simulations or between release events. After satisfying the requirements for the control cases, the cocaine basal and cocaine seeking cases were simulated by modeling known cocaine–induced changes to xc- (modeled by reducing total number of xc- molecules by 50 %), mGluR2/3 signaling (modeled by changing the release probability for cocaine cases in the range 0.32–0.30) and AMPA/NMDA ratio (modeled by increasing the AMPA receptors to 29 from 18 in the control cases). The changes observed in the [Glu]ex during cocaine pathologies did not occur in the stochastic model until the 40% cocaine-induced down-regulation of XAG was incorporated. Thus, the stochastic model validated the down-regulation of XAG that was previously predicted (Pendyam et al., 2009) and subsequently discovered experimentally (Knackstead et al., 2010). The model values listed in Table 1 constituted the values that satisfied all the model constraints simultaneously (see Table 2), i.e., steady state [Glu]syn, [Glu]mGluR and [Glu]ex in the control basal, natural reward seeking, cocaine basal and cocaine seeking cases while maintaining 85 % mGluR2/3 occupancy for the control basal case.
Through further iterative changes, multiple parameter sets were identified that satisfied some of the model constraints in control and cocaine conditions. For example, a wide range of molecular release (e.g., 1,000-15,000) satisfied [Glu]ex in the control cases and the cocaine basal case, but was insufficient to establish [Glu]ex under cocaine drug seeking case. Thus, it was iteratively determined that a release of 22,000 molecules was required during every action potential to satisfy [Glu]ex for the cocaine drug seeking case. Hence, for consistency purposes, 22,000 molecules were chosen per release for all cases considered.
Also, the kinetic values for the Glu-mGluR2/3 reaction (see Eqn. 2.4.2) chosen in the model did not affect the key ideas presented in the paper. We found that for the configuration in Figure 1, higher values of kinetic constants (for e.g., k1 = 108 M−1 ms−1 and k−1 = 18 ms−1), although physiologically unrealistic, resulted in a lower mGluR2/3 occupancy (∼50 %) without altering glutamate concentrations, indicating that the model was internally consistent.
All simulations were implemented on a Dell EM64T and SGI Altix 4700 cluster using the Linux operating system. The model used a time step of 0.5 μsec so that the corresponding mean diffusion length computed by MCell allowed the system to be sampled sufficiently at this scale. This was done after ensuring that all reaction probabilities in the model were less than 0.05 to ensure accurate sampling of the diffusing molecules of the system. This also resulted in sufficiently small errors in the reaction equilibria. At initialization of each simulation, the exact number and position of receptors were randomly assigned by MCell on specified surfaces (for e.g., XAG on glial sheath G1 varied from 2737 to 2874 molecules between trials) based on the average surface densities (see Table 1). Various bound and unbound complexes of the reactions specified above were also tracked to obtain a spatio-temporal estimate of the reactants in the system. Conservation of molecules was confirmed at each time step by computing the numbers of free, bound and transported glutamate molecules. Due to the stochastic nature of the model, multiple trials were conducted to obtain average estimates for [Glu]syn, [Glu]mGluR and [Glu]ex. The model was simulated for a total of 6 seconds so as to achieve homeostatic conditions for each of the cases considered (Control Basal, Control Rewards, Cocaine Basal and Cocaine Seeking).
The surface density values for the receptors used in the model were determined by averaging over 48 trails after ensuring that the steady state concentrations for [Glu]syn, [Glu]mGluR and [Glu]ex were within one standard deviation of the corresponding reported experimental means. We then used the average value obtained for the receptors (i.e., AMPA, NMDA, mGluR2/3, XAG and xc-) based on the surface density from the 48 trials and ran 10 additional trials for all the cases. That is, we kept the input parameter numbers constant in MCell for the 10 trials, to estimate average values for [Glu]syn, [Glu]mGluR and [Glu]ex. As expected, the concentration estimates for these 10 runs were also within one standard deviation from the experimentally reported mean for all cases considered. Thus, all results reported in the paper were across 10 simulations. Further, to check for numerical accuracy, the time step was decreased by a factor of 5 and no significant changes (∼3 %) were found in [Glu]syn, [Glu]mGluR and [Glu]ex. Tables 1 and 3 list the surface density and number of receptor molecules (AMPA, NMDA, mGluR2/3, XAG and xc-) used for the configuration in Figure 1.
Table 3.
Percentage of receptors in the open state during transient and steady state conditions for example case cortico-accumbens synapse in Figure 1.
| Parameter | AMPA | NMDA | mGluR2/3 |
|---|---|---|---|
| Total receptors (molecules) | 18 | 30 | 22 |
| Surface density (molecules/μm2) | 130 | 200 | 900 |
| % of receptors in the open state during transient/steady conditions | |||
| Control basal* | 0.05/0 | 15.39/1.35 | 84.25/86.84 |
| Control rewards* | 0.31/0 | 12.4/2.7 | 98.1/97.61 |
| Cocaine basal** | 0.57/0 | 11.0/1.68 | 85.7/81.28 |
| Cocaine seeking** | 0.08/0.07 | 7.75/4.75 | 100/99.96 |
AMPA/NMDA Ratio for control case: 0.62 (AMPA receptors = 18; NMDA receptors = 30)
AMPA/NMDA Ratio for cocaine case: 0.96 (AMPA receptors = 29; NMDA receptors = 30)
% of AMPA/NMDA in the open state during transient conditions was averaged for ∼50 ms
% of AMPA/NMDA in the open state during steady state conditions was averaged for ∼1000 ms
3. Results
Example synapse – control and cocaine cases
Multiple 3-D configurations of glia surrounding the example case cortico-accumbens synapse were studied by varying the number of glial sheaths, coverage, thickness, and glial boulders in the ECS. As cited above, the input parameters were iteratively adjusted to satisfy model constraints (see Table 2) and by providing appropriate resistance to the flow of glutamate molecules, the configuration in Figure 1 established all model constraints simultaneously.
3.1 Transient and steady state concentration characteristics
Each synaptic release in the model resulted in peak cleft concentration in the mM range that decayed in a biphasic manner with fast and slow time constants of 85 μs, and 3.3 ms, respectively. Further, varying the no flux boundary condition had no effect on the time course of neurotransmitter in the cleft.
A single glutamate molecule in the synaptic cleft (volume of 2.29 × 10⁻³ μm3) resulted in [Glu]syn increasing to ∼0.7 μM. Since the steady state biological [Glu]syn were typically three-four times lower (∼0.2 μM; Patneau & Mayer, 1990), we concluded that experimental estimates of low steady state concentrations measured in the synapse may be due to the intermittent presence of a single glutamate molecule. This held true for the region in the vicinity of mGluR2/3 autoreceptors (volume of 1.25 × 10⁻⁴ μm3) where [Glu]mGluR was monitored. By labeling glutamate molecules from synaptic and non-synaptic sources, the model showed that while transient characteristics were primarily dominated by synaptic release, steady state concentrations were controlled by the non-synaptic release site for glutamate, namely cystine–glutamate exchanger. The relative contributions (normalized) of synaptic and non-synaptic sources to transient and steady state glutamate concentrations in the control basal case after a release are shown in Figure 2. Approximately 4,250 glutamate molecules of non-synaptic origin maintained a steady state [Glu]ex of 5 μM in the ECS (volume of 1.41 μm3) of the configuration in Figure 1. The neurotransmitter molecule numbers in ECS varied from 3,750–4,250 in the control basal case across 10 trials resulting in average [Glu]ex being 4.79 ± 0.04 μM, while average [Glu]ex during the natural reward seeking case was 5.32 ± 0.06 μM corresponding to a molecular variation of 4,500–5,250 across 10 trials. The model reproduced extracellular glutamate concentration levels for cocaine basal and cocaine seeking cases as 3.29 ± 0.05μM, and 12.5 ± 0.06 μM respectively, only after a 40 % reduction in XAG (Knackstedt et al., 2010), verifying the prediction based on a continuum model in Pendyam et al. (2009). This corresponded to a variation of 2,500–3,250 glutamate molecules in the cocaine basal case and 11,750–12,500 in the cocaine seeking case, across 10 trials. Thus, the homeostatic glutamate concentrations that resulted from the configuration in Figure 1 matched the mean-field situation observed experimentally using dialysis studies as reported in Table 2.
Figure 2.

Extracellular glutamate concentration ([Glu]ex) in the control basal case and the normalized contribution of glutamate molecules from synaptic and non-synaptic sources in extracellular space (ECS). By including the cystine–glutamate exchange (xc-) as a non-synaptic release site for glutamate the model showed that extracellular concentration was primarily due to the xc- at steady state for the control basal case. This is because the synaptically released glutamate molecules were entirely consumed by transporters located on the glial folds. This study also validated that a wide range of molecular release (e.g., 1,000-22,000) could be used to satisfy [Glu]ex in control conditions.
3.2 Receptor opening during control and cocaine conditions
The AMPA/NMDA ratio was 0.8±0.33 in the control basal case and changed to 1.15±0.41 (n = 12; unpublished data; also see Kourrich et al., 2007; Conrad et al., 2008) in the cocaine basal case in the nucleus accumbens as cited previously. Figure 3 shows the percentage of receptors in the open state for AMPA and NMDA receptors during transient and steady state conditions for control and cocaine cases in the presence of synaptic and non-synaptic sources. Percentage of receptors in the open state was defined as the ratio of receptors that reached the open state as modulated by synaptic and non-synaptic glutamate to the total number of receptors (AMPA or NMDA) in the volume considered. As cited, Table 3 shows the surface density and the equivalent number of receptor molecules that were randomly distributed. In the control cases, about 5 % of AMPA receptors were in the open state during the transient phase. The AMPA receptors in the open state dropped to about 3 % in the cocaine cases despite the total number of AMPA receptors being higher (see Table 3). Although, most of the AMPA receptors were activated by synaptically released glutamate, only <10 % reached the open state with many AMPA receptors existing in one of the intermediate states (data not shown). As observed in Figure 3, steady state NMDA receptor activity/opening was also mediated by non-synaptic glutamate sources during control and cocaine basal conditions. Thus, on average in between spike events, glutamate molecules (non-synaptic origin) from ECS diffused into the cleft and this resulted in <2 % of the high affinity NMDA receptors being in the open state during the homeostatic control basal case (see Table 3). Since AMPA receptors in the open state were <1 %, the predicted level of NMDA receptors open would not lead to postsynaptic signaling (Parsons, Danysz, & Zieglgansberger, 2005).
Figure 3.

% of AMPA and NMDA receptors in the open state based on synaptic and non-synaptic neurotransmitter sources. Percentage of receptors in the open state was defined as the ratio of the receptors that are present in the open state to the total receptors present. The arrows are representative of the times at which release occurred in the control basal, natural reward seeking, cocaine basal and cocaine seeking cases with presynaptic firing frequencies: 4.167 Hz, 0.667 Hz, 3.125 Hz, and 0.222 Hz respectively. On average, in the control conditions, about 5 % of AMPA receptors were in the open state during in the transient state (i.e., immediately after release). The AMPA receptors in the open state however dropped to about 3 % in the cocaine cases despite the number of AMPA receptors being higher. Also, the steady influx of molecules from the extracellular space to the perisynaptic environment resulted in the high affinity NMDA receptors being in the open state. In the absence of AMPA mediated depolarization (i.e., <1 % in the open state), this would not lead to post synaptic signaling.
3.3 Perturbation studies
A perturbation analysis was used to rank the following model parameters using the configuration in Figure 1: total transporter molecules, non-synaptic glutamate molecules, number of molecules/release, diffusion coefficient, and volume fraction. Each parameter was varied by +/-10 % around the model value in Table 1, to find their relative effect on the steady state [Glu]syn, and [Glu]ex. The differences in the outputs (%) based on this +/-10 % change were then normalized by dividing with the largest value across all parameters. The resulting normalized numbers reported in Table 4 were indicative of the relative importance (rank) of the parameters as far as their effect on the output was concerned. The details of the % variation in the parameters of interest compared to the control basal case are reported below.
Table 4.
Normalized perturbation analysis to rank the parameters for the example case cortico-accumbens synapse in Figure 1.
| Parameters | Steady state glutamate concentrations* | |
|---|---|---|
| [Glu]syn | [Glu]ex | |
| Transporters (molecules) | 1.00 | 1.00 |
| Diffusion (μm2/ms) | −0.54 | 0.34 |
| xc-(molecules) | −0.23 | −0.86 |
| No. of molecules per release (molecules) | 0.01 | −0.01 |
| mGluR2/3 (molecules) | −0.04 | 0.03 |
The signs indicate direction of change when the parameter varied from -10% to+10% around the model values listed in Table 1.
(a) Total transporters
A +/-10 % change in XAG on all sheaths G1–3 resulted in a change in [Glu]syn by -25/+37%; and in [Glu]ex by -8/+9 %. Further, transporters on each glial sheath were varied independently to quantify their role on the outputs of interest. A +/-10 % change in transporters on G1 alone resulted in a change in [Glu]synby -11/+11 % and as expected, resulted in no significant variation in [Glu]ex. A +/-10 % change in XAG for G2 alone resulted in change in [Glu]synby -6/+4 % and less than 1% change in [Glu]ex. A +/-10 % change in XAG on G3 alone resulted in a change in [Glu]syn by -12/+12 % and in [Glu]ex by -7/+8 %. This study verified the significant role glial sheath G3 played in regulating influx of molecules from the ECS into the perisynapse at steady state, thereby controlling [Glu]syn along with maintaining [Glu]ex.
(b) Non-synaptic sources
A +/-10 % change in xc- resulted in an change in [Glu]synby +12/-3 %, and in [Glu]ex by +11/-4 %. This variation could be attributed to the contribution of non-synaptic sources in maintaining [Glu]ex. An increase in xc- resulted in an increase [Glu]ex thereby affecting molecular influx to the perisyanpse and thus increasing [Glu]syn. This trend was consistent with when xc- is reduced, albeit not linear.
(c) Molecules per release
A +/-10 % change in the number of molecules per release resulted in no change in [Glu]syn, and in less than 0.5 % change in [Glu]ex. This showed that synaptically released glutamate was consumed entirely by XAG in the control basal case. This also demonstrated that facilitation/depression of presynaptic release had a minor influence on extracellular concentrations. Thus, a wide range of molecular release could satisfy all study cases besides cocaine drug seeking, as cited previously.
(d) Diffusion coefficient, D
A +/-10 % change in diffusion coefficient resulted in an change in [Glu]synby +19/-16 %, and a change in [Glu]ex by -3/+3 %. Reducing D restricted efflux of molecules to the ECS after a release and this increased the availability of molecules to the glial rich transporters in the perisynaptic environment. At the same time, a lower D constrained influx of molecules from the ECS to the perisynapse during steady state. Increasing D resulted in a greater movement of molecules in the perisyanptic environment thereby significantly increasing [Glu]syn.
(e) Volume fraction, α
To study the effect of volume fraction, an extreme case of no glial boulders in the region outside glial sheath G3 was considered. This led to a four-fold increase in α from 0.2 to 0.9, which in turn resulted in an increase in [Glu]syn by 17 %, and in [Glu]ex by 10 %. The absence of glial boulders in the ECS resulted in a drop in uptake by glial sheath G3, thus, increasing [Glu]ex and subsequently affecting [Glu]syn. As this study highlights, although the glial boulders lacked XAG, their presence in the model improved the uptake efficiency of XAG present on G3.
Example case synapse – generalized study
3.4 Characterizing isolation for a general synapse based on glial sheath geometry
Certain synapses are tightly ensheathed by glial processes while others are left open (Sykova, 2004; Rollenhagen & Lubke, 2006). The generalized study considered the following question – Given the same parameter set, how do configurations A–F in Figure 4 compare in maintaining a specific neurotransmitter gradient? To characterize diffusion path length (defined as the distance that a molecule travels from the synaptic cleft to the ECS) and synaptic isolation, the stochastic framework for the example case cortico-accumbens synapse was generalized. This was done by considering a lower [Glu]ex of 1 μM, and comparing three types of glial configurations akin to those previous proposed (e.g., Barbour, 2001; Rusakov, 2001), namely, porous (i.e., no glial sheaths and with transporters distributed uniformly in the perisynaptic region), one, and two glial sheaths (see Figure 4). The key difference between the configurations in Figure 4 was their orientation, coverage, placement and number of glial sheaths that in turn resulted in different diffusion path lengths. The two sheath model with the longest path length (configuration G) was set as the baseline model. For this configuration, the diffusion coefficient, number of the transporter and non-synaptic molecules, were iteratively determined to satisfy the following constraints: [Glu]syn of 0.2 μM while maintaining [Glu]ex of 1 μM to establish a neurotransmitter gradient ([Glu]ex-[Glu]syn) of 0.8 μM.
Figure 4.

2-D schematic of the three distinct types of 3-D glial configurations (porous, one, and two sheaths) used to characterize diffusion path length and synaptic isolation for a general synapse with 1 μM extracellular concentration, using the same legends as in Figure 1. Glial transporters were randomly distributed in the shaded region. Configurations B and C with different orientation of glial openings on pre- and post synaptic regions represent the one sheath glial cases, and configurations D-G represent two sheath glial cases considered. The diffusion path length increased from configurations A to G, with configuration G as the baseline model.
Further, due the variability that existed between the models (A-F), for consistency, we constrained the parameters to be the same and thus report below the total molecules used. Thus, the resulting parameter set for the baseline model (configuration G, see Figure 4) was as follows: Molecules per release = 2000, Total transporter molecules (G1–2) = 2150, Non-synaptic source molecules = 38, with kinetic schemes as cited previously (see Section 2.4), and all other parameters as reported in Table 1. By having all parameter values constrained as in the baseline model, the comparative study determined the relative effectiveness of configurations A–G in maintaining a specified neurotransmitter gradient.
Figure 5 shows the variation in [Glu]syn, and [Glu]ex across all the glial configurations A-G in Figure 4. The dotted line in Figure 5 connects the concentration gradients ([Glu]ex-[Glu]Syn) achieved by each of these configurations. As expected, for the porous geometry in configuration A, [Glu]syn and [Glu]ex was the same at 0.52 μM, resulting in no concentration gradient. For the one sheath glial geometries (configuration B and C), [Glu]syn dropped from 0.37 to 0.29 μM while [Glu]ex increased from 0.48 to 0.53 μM. For all the configurations considered, geometries with two glial sheaths (configurations D-G) showed the largest gradient (see Figure 5), thus suggesting that higher gradients were based on the amount of synaptic isolation the glia provides. For instance, [Glu]syn dropped from 0.35 to 0.15 μM going from configuration D to G (see Figure 5).
Figure 5.

Comparison of [Glu]syn and [Glu]ex under control basal conditions for various glial configurations shown in Figure 4, using the same set of parameters, with configuration G as the baseline model. As expected, porous glia (configuration A) with zero diffusion path length supported no neurotransmitter gradient. The dotted line connects the gradient ([Glu]ex - [Glu]syn) achieved by each of these configurations. The diffusion path length increased from configuration A to G, and this path length was correlated to the neurotransmitter gradient between the ECS and the synaptic cleft.
Further, to compare different modeling approaches (stochastic vs. continuum) we investigated differences in transporter efficiency between volume populated (Pendyam et al., 2009) and surface populated cases based on configuration G in Figure 4. The details of the volume population methodology used in the continuum case could be found in Pendyam et al. (2009). Due to volume population of glial transporters, the continuum model (Pendyam et al., 2009) provided more space between the glial sheaths for molecular diffusion, i.e., 140 nm which comprised of 100 nm of the glial volume (i.e., 50 nm on either side of an impermeable center line) and 40 nm for the ECS gap. This compared to only 40 nm, which was the ECS gap in the stochastic model. Thus, the volume populated continuum model resulted in an approximately 100 % increase in [Glu]syn and [Glu]mGluR (i.e., 0.35 μM and 0.38 μM, respectively), while [Glu]ex rose only by 10 % to 1.1 μM compared to the stochastic model. Although, the continuum model maintained a concentration gradient between the synaptic and extracellular space, it did not establish the required model constraints. The cause for this was a 50 % decrease in transporter efficiency in the volume populated model.
4. Discussion
Neurotransmitter homeostasis was modeled using a three–dimensional stochastic diffusion model of an example cortico-accumbens synapse to provide molecular level insights. Previous stochastic models of synaptic environments have not typically considered a non-synaptic release site for glutamate or modeled neurotransmitter gradients, both of which were included in the models considered in the present study. The example case synapse was further generalized to investigate the effect of diffusion path length (defined as the distance that a molecule travels from the synaptic cleft to the ECS) on synaptic isolation using several feasible glial geometries. The insights provided by the models are described next.
Example case synapse – control and cocaine cases
4.1 Stochastic molecular model quantifies the role of non-synaptic neurotransmitter sources in control and cocaine conditions
Homeostasis
By combining physiological values from the literature and empirically derived changes due to chronic cocaine, the example case cortico-accumbens model reproduced experimentally observed glutamate concentrations for various cases (see Table 2 for model constraints). The model further provided molecular level details not predicted by the continuum-based approach (Pendyam et al., 2009). Specifically, by labeling glutamate from synaptic and non-synaptic sources, the model showed that the non-synaptic source contribution to the homeostatic extracellular concentration varied from 100 % (i.e., ∼4000 molecules total) in the control basal case to 84 % (i.e., ∼5000 molecules total) and 24 % (i.e., ∼12,000 molecules total) in the control natural reward and cocaine drug seeking cases, respectively. This study established that only non-synaptic sources maintained homeostatic concentration levels in the control basal condition for such synapses and acted as the source for the steady influx of molecules from the ECS to the perisynaptic environment. The model also shed light on experimental estimates of steady state concentrations measured in the synapse that may be due to the intermittent presence of a single glutamate molecule. Such fine grained view of molecular activity in steady state is not feasible using continuum approaches.
Receptor activity
The model also provided molecular insights related to % of receptors (AMPA or NMDA) in the open state. In the control basal case, before a synaptic release almost all the AMPA receptors were in the closed state. However, after a synaptic release, it was observed that although most of AMPA receptors were activated, they did not always result in AMPA receptors reaching the open state. The choice of molecules released per synaptic firing, number of receptors in the synaptic cleft, D, glial geometry and number of receptors in the perisynaptic vicinity play an important role in shaping the characteristics of receptor activity. Although, not the primary focus of this paper, the study showed that the receptor activity in the synaptic cleft during homeostasis was affected by synaptic and non-synaptic sources of glutamate.
Also, the configuration in Figure 1 showed that, with an average [Glu]ex of 4.79 μM, there was a constant influx of 5 molecules/ms from the ECS into the glial environment measured at the G3 opening, between release events in the control basal case. As the molecules diffused towards the synaptic cleft from the opening in glial sheath, G3, the transporter rich glial path reduced this flow of molecules from 5/ms to 2/ms near the mGluR2/3 region. The reduction in the number of molecules was caused by the uptake of diffusing molecules by the transporter rich glial path.
As shown in Table 3, mGluR2/3 occupancy increased to 100 % during cocaine drug seeking conditions. The steady state [Glu]ex in the cocaine drug seeking case was approximately three times higher compared to the control basal case, and combined with the down-regulation of glial transporters by 40 % resulted in an increased influx of glutamate molecules from ECS rendering mGluR2/3 ineffective. By comparing [Glu]mGluR, mGluR occupancy, with release probabilities, an interesting observation was that steady state mGluR occupancy was dependent upon synaptic firing frequency/release and possibly slower Glu-mGluR2/3 binding kinetics. It should be noted that a higher mGluR2/3 occupancy in control natural rewards would result in a suppression of synaptic release whereas, the high numbers in cocaine drug seeking are representative of a lack of presynaptic firing inhibition. In conclusion, the computational model structure enabled molecular level quantification of the contribution of non-synaptic glutamate sources to the regulation of homeostasis and receptor activity.
4.2 Glial glutamate transporters had the largest effect on glutamate concentrations
The signs on the various perturbation numbers in Table 4 followed expected biological trends during steady state conditions. By considering changes in glutamate concentrations from the nominal values at the three locations for the configuration in Figure 1, total transporters were found to be most important parameter in controlling [Glu]syn and [Glu]ex. Counter to intuition, it was found that independently varying transporters by ±10 % on glial sheath G3 (see results) had a greater effect on [Glu]syn as compared to a similar change on G1. Another observation was that, around the nominal operating point, variation of ±10 % in non-synaptic source molecules was ranked second (after transporters) as far as its effect on [Glu]ex was concerned (see Table 4). Thus, the study helped highlight the role of glial sheaths and XAG in regulating molecular influx rates at steady state that may be critical for perisynaptic receptor activity. These observations, although specific to the example case, should hold for other geometries that isolate the synapse and support neurotransmitter gradients.
Example case synapse – generalized study
4.3 Diffusion path length correlates with degree of synaptic isolation and magnitude of neurotransmitter gradient
A generalized study of the example synapse was considered to characterize the role of glial geometry in supporting gradients and subsequently diffusion path length, i.e., Which of the configurations in Figure 4 (with baseline model being configuration G, and [Glu]ex = 1 μM) yielded the largest gradient?
As expected, it was found that the porous glial geometry of configuration A could not support neurotransmitter concentration gradients, as shown in Figure 5. The one sheath glial configuration (B and C) showed that a structured glial configuration ensured better utilization of transporters as compared to configuration A. This was reflected by the increased concentration gradient as shown in Figure 5. Configurations D and E represented the two-sheath versions of configurations B and C. As seen in Figure 5, by comparing configurations D and E, it was observed that while [Glu]syn decreased, there was a corresponding increase in [Glu]ex. Thus, by increasing the interaction of the diffusing molecules with transporters, configurations D and E supported higher neurotransmitter gradient as compared to their corresponding one sheath models B and C. Interestingly, in spite of having just one glial sheath, configuration C maintained a higher gradient than D. This highlighted the importance of regulating molecular flow to the synapse that helped maintain a gradient between the synapse and extracellular space. The dotted line in Figure 5 summarized the finding in this comparative study, that is, for the same set of parameters; diffusion path length was proportional to the gradient supported.
A comparative analysis of transporter efficiency revealed that volume populating transporters (continuum approach) was found to be 50 % less efficient compared to the surface populated case (stochastic approach), for the baseline configuration, G. This was because the volume population of transporters in space compartments made them less concentrated and hence, less efficient, i.e., uptake rate decreased. The results suggested that by reducing the size of the space compartments, the continuum model would better approximate the surface populated stochastic model as also noted by others (Stiles & Bartol, 2001; Franks et al., 2002).
4.4 Limitations
As cited, glial configurations and diffusion very close to synapses (∼1 μm) are not well understood, particularly for synapses that support gradients between the cleft and the ECS. Hence, the glial configurations considered should be viewed as being only ‘equivalent’ in that they provide the same resistance to the flow of neurotransmitter observed in vivo. Secondly, the example case synapse considered only one neurotransmitter and stimulation of several of its receptors. Finally, it is noted that the iterative process proposed could be used to determine alternate glial configurations with different XAG and xc- densities to satisfy all constraints simultaneously, for changes to any of the assumptions made in this study. For instance, steady state mGluR2/3 occupancy in the cortico-accumbens synapse was assumed to be 85 %. If a different value is to be tested, the iterative methodology proposed could be used to determine appropriate parameter estimates for the configuration.
Future studies could also examine the effect of synaptic plasticity including potentiation and depression of release probability during trains of action potentials. This would be relevant to modeling addiction related neuropathology since the ability to either potentiate or depotentiate synapses in attenuated at accumbens glutamatergic synapses after withdrawal from cocaine (Martin, Chen, Hopf, Bowers, & Bonci, 2006; Moussawi et al., 2009). The model could also incorporate other neurotransmitters such as dopamine and GABA that might additionally modulate the homeostatic mechanisms. Indeed, both dopamine and GABA transmission are altered followed chronic cocaine administration (Xi et al., 2003; Volkow et al., 2006), and modeling their influences on excitatory transmission should reveal a more complete portrait of cocaine-induced neuropathologies (Sun, Milovanovic, Zhao, & Wolf, 2008).
Conclusion
A biophysically realistic stochastic modeling framework was proposed to study neurotransmitter homeostasis around a class of synapses that supported neurotransmitter gradients. An example case of a cortico-accumbens synapse in control and cocaine conditions was considered to obtain molecular level insights including how non-synaptic sources affected homeostasis. By incorporating cystine–glutamate exchanger as a non-synaptic release site for glutamate, the model showed how cocaine–induced neuroadaptations influence glutamate transmission at accumbens synapses. This study further provided another approach to validate the prediction of cocaine-induced down-regulation of the glial glutamate transporter. Generalized models of the example case were also considered which shed light on the role of glial configurations in maintaining neurotransmitter gradients. While porous approximations of the neuropil could only describe average behaviors of molecules, the configurations considered showed that glial geometries had characteristic diffusion path lengths that were correlated to the achievable gradients. Thus, such modeling approaches provide guidance about glial morphology around a class of synapses the support neurotransmitter gradients.
Acknowledgments
We thank Dr. Markus Dittrich, Pittsburg Supercomputing Center for providing assistance with the MCell software and for helpful comments on an earlier draft. We also thank the two anonymous reviewers for their comments that helped improve the manuscript. This research was supported in part by USPHS grants DA015369, DA03906 (PWK), and subcontract from DA015369 and PSC grant IBN090001P to University of Missouri (SSN).
References
- Alagarsamy S, Sorensen SD, Conn PJ. Coordinate regulation of metabotropic glutamate receptors. Cur Op Neurobiol. 2001;11:357–362. doi: 10.1016/s0959-4388(00)00219-1. [DOI] [PubMed] [Google Scholar]
- Attwell D, Gibb A. Neuroenergetics and the kinetic design of excitatory synapses. Nat Rev Neurosci. 2005;6:841–849. doi: 10.1038/nrn1784. [DOI] [PubMed] [Google Scholar]
- Baker DA, McFarland K, Lake RW, Shen H, Tang XC, Toda S, Kalivas PW. Neuroadaptations in cystine–glutamate exchange underlie cocaine relapse. Nat Neurosci. 2003;6:743–749. doi: 10.1038/nn1069. [DOI] [PubMed] [Google Scholar]
- Barbour B. An evaluation of synapse independence. J Neurosci. 2001;21(20):7969–7984. doi: 10.1523/JNEUROSCI.21-20-07969.2001. [DOI] [PMC free article] [PubMed] [Google Scholar]
- Bergles DE, Jahr CE. Synaptic activation of glutamate transporters in hippocampal astrocytes. Neuron. 1997;19:1297–1308. doi: 10.1016/s0896-6273(00)80420-1. [DOI] [PubMed] [Google Scholar]
- Billups B, Graham BP, Wong AY, Forsythe ID. Unmasking group III metabotropic glutamate autoreceptor function at excitatory synapses in the rat CNS. J Physiol. 2005;565:885–896. doi: 10.1113/jphysiol.2005.086736. [DOI] [PMC free article] [PubMed] [Google Scholar]
- Bruns D, Jahn R. Real–time measurement of transmitter release from single synaptic vesicles. Nature. 1995;377:62–65. doi: 10.1038/377062a0. [DOI] [PubMed] [Google Scholar]
- Cavelier P, Hamann M, Rossi D, Mobbs P, Attwell D. Tonic excitation and inhibition of neurons: ambient transmitter sources and computational consequences. Prog Biophys Mol Biol. 2005;87:3–16. doi: 10.1016/j.pbiomolbio.2004.06.001. [DOI] [PMC free article] [PubMed] [Google Scholar]
- Chang JY, Zhang L, Janak PH, Woodward DJ. Neuronal responses in prefrontal cortex and nucleus accumbens during heroin self–administration in freely moving rats. Brain Res. 1997;754:12–20. doi: 10.1016/s0006-8993(97)00012-7. [DOI] [PubMed] [Google Scholar]
- Clements JD, Robin A, Lester J, Tong G, Jahr CE, Westbrook GL. The time course of glutamate in the synaptic cleft. Science. 1992;258:1498–1501. doi: 10.1126/science.1359647. [DOI] [PubMed] [Google Scholar]
- Clements JD. Transmitter time course in the synaptic cleft: its role in central synaptic function. Trends in Neuroscience. 1996;19:163–171. doi: 10.1016/s0166-2236(96)10024-2. [DOI] [PubMed] [Google Scholar]
- Conrad KL, Tseng KY, Uejima JL, Reimers JM, Hen LJ, Shaham Y, Marinelli M, Wolf ML. Formation of accumbens GluR2–lacking AMPA receptors mediates incubation of cocaine seeking. Nature. 2008;454(7200):118–121. doi: 10.1038/nature06995. [DOI] [PMC free article] [PubMed] [Google Scholar]
- Czech J, Dittrich M, Stiles JR. Rapid creation, monte carlo simulation, and visualization of realistic 3D cell models. In: Maly IV, editor. Methods in molecular biology, Systems Biology. Clifton, NJ: Humana Press; 2009. pp. 237–287. [DOI] [PubMed] [Google Scholar]
- Danbolt NC. Glutamate uptake. Prog Neurobiol. 2001;65:1–105. doi: 10.1016/s0301-0082(00)00067-8. [DOI] [PubMed] [Google Scholar]
- Diamond JS. Deriving the glutamate clearance time course from transporter currents in CA1 hippocampal astrocytes: transmitter uptake gets faster during development. J Neurosci. 2005;25:2906–2916. doi: 10.1523/JNEUROSCI.5125-04.2005. [DOI] [PMC free article] [PubMed] [Google Scholar]
- Franks KM, Bartol TM, Sejnowski TJ. A Monte Carlo model reveals independent signaling at central glutamatergic synapses. Biophys J. 2002;83:2333–2348. doi: 10.1016/S0006-3495(02)75248-X. [DOI] [PMC free article] [PubMed] [Google Scholar]
- Geiger JRP, Roth A, Taskin B, Jonas P. In: Handbook of experimental pharmacology. Jonas P, Monyer H, editors. Berlin: Springer; 1999. pp. 363–398. [Google Scholar]
- Haydon P. Glia: listening and talking to the synapse. Nat Neurosci. 2001;2:2185–191. doi: 10.1038/35058528. [DOI] [PubMed] [Google Scholar]
- Herman MA, Jahr CE. Extracellular glutamate concentration in hippocampal slice. J Neurosci. 2007;27:9736–9741. doi: 10.1523/JNEUROSCI.3009-07.2007. [DOI] [PMC free article] [PubMed] [Google Scholar]
- Holmes WR. Modeling the effect of glutamate diffusion and uptake on NMDA and non-NMDA receptor saturation. Biophys J. 1995;69:1734–1747. doi: 10.1016/S0006-3495(95)80043-3. [DOI] [PMC free article] [PubMed] [Google Scholar]
- Hrabe J, Harbetova S, Segeth K. A model of effective diffusion and tortuosity in the extracellular space of the brain. Biophys J. 2004;87:1606–1617. doi: 10.1529/biophysj.103.039495. [DOI] [PMC free article] [PubMed] [Google Scholar]
- Jonas P, Major G, Sakmann B. Quantal components of unitary EPSCs at the mossy fibre synapse on CA3 pyramidal cells of rat hippocampus. J Physiol. 1993;472:615–663. doi: 10.1113/jphysiol.1993.sp019965. [DOI] [PMC free article] [PubMed] [Google Scholar]
- Kalivas PW, Volkow N, Seamans J. Unmanageable motivation in addiction: pathology in prefrontal–accumbens glutamate transmission. Neuron. 2005;45:647–650. doi: 10.1016/j.neuron.2005.02.005. [DOI] [PubMed] [Google Scholar]
- Kalivas PW. The glutamate homeostasis hypothesis of addiction. Nat Rev Neurosci. 2009;10:561–572. doi: 10.1038/nrn2515. [DOI] [PubMed] [Google Scholar]
- Kau KS, Madayag A, Mantsch JR, Grier MD, Abdulhameed O, Baker DA. Blunted cystine–glutamate antiporter function in the nucleus accumbens promotes cocaine-induced drug seeking. Neuroscience. 2008;155:530–537. doi: 10.1016/j.neuroscience.2008.06.010. [DOI] [PMC free article] [PubMed] [Google Scholar]
- Kerr RA, Bartol TM, Kaminsky B, Dittrich M, Chang JC, Baden SB, Sejnowski TJ, Stiles JR. Fast Monte Carlo simulation methods for biological reaction–diffusion systems in solution and on surfaces. SIAM J Sci Comp. 2008;30(6):3126–3149. doi: 10.1137/070692017. [DOI] [PMC free article] [PubMed] [Google Scholar]
- Kleinle J, Vogt K, Luscher HR, Muller R, Senn W, Wyler K, Streit J. Transmitter concentrations profiles in the synaptic cleft: an analytical model of release and diffusion. Biophys J. 1996;71:2413–2426. doi: 10.1016/S0006-3495(96)79435-3. [DOI] [PMC free article] [PubMed] [Google Scholar]
- Knackstedt LA, Melendez RI, Kalivas PW. Ceftriaxone Restores Glutamate Homeostasis and Prevents Relapse to Cocaine Seeking. Biol Psychiatry. 2010;67:81–84. doi: 10.1016/j.biopsych.2009.07.018. [DOI] [PMC free article] [PubMed] [Google Scholar]
- Koob GF, Le Moal M. Drug addiction, dysregulation of reward, and allostasis. Neuropsychopharmacology. 2001;24:97–129. doi: 10.1016/S0893-133X(00)00195-0. [DOI] [PubMed] [Google Scholar]
- Kourrich S, Rothwell PE, Klug JR, Thomas MJ. Cocaine experience controls bidirectional synaptic plasticity in the nucleus accumbens. J Neurosci. 2007;27:7921–7928. doi: 10.1523/JNEUROSCI.1859-07.2007. [DOI] [PMC free article] [PubMed] [Google Scholar]
- Lehre KP, Danbolt NC. The number of glutamate transporter subtype molecules at glutamatergic synapses: chemical and stereological quantification in young adult rat brain. J Neurosci. 1998;18:8751–8757. doi: 10.1523/JNEUROSCI.18-21-08751.1998. [DOI] [PMC free article] [PubMed] [Google Scholar]
- Lehre KP, Rusakov D. Asymmetry of glia near central synapse favors presynaptically directed glutamate escape. Biophys J. 2002;83:125–134. doi: 10.1016/S0006-3495(02)75154-0. [DOI] [PMC free article] [PubMed] [Google Scholar]
- Lester RA, Jahr CE. NMDA channel behavior depends on agonist affinity. J Neurosci. 1992;12:635–643. doi: 10.1523/JNEUROSCI.12-02-00635.1992. [DOI] [PMC free article] [PubMed] [Google Scholar]
- Le Meur K, Galante M, Anulo MC, Audinat E. Tonic activation of NMDA receptors by ambient glutamate of non-synaptic origin in the rat hippocampus. J Physiol. 2007;580:373–383. doi: 10.1113/jphysiol.2006.123570. [DOI] [PMC free article] [PubMed] [Google Scholar]
- Martin M, Chen BT, Hopf FW, Bowers MS, Bonci A. Cocaine self-administration selectively abolishes LTD in the core of the nucleus accumbens. Nat Neurosci. 2006;9:868–869. doi: 10.1038/nn1713. [DOI] [PubMed] [Google Scholar]
- McFarland K, Lapish CC, Kalivas PW. Prefrontal glutamate release into the core of the nucleus accumbens mediates cocaine–induced reinstatement of drug–seeking behavior. J Neurosci. 2003;23:3531–3537. doi: 10.1523/JNEUROSCI.23-08-03531.2003. [DOI] [PMC free article] [PubMed] [Google Scholar]
- McFarland K, Davidge SB, Lapish CC, Kalivas PW. Limbic and motor circuitry underlying footshock–induced reinstatement of cocaine–seeking behavior. J Neurosci. 2004;24:1551–1560. doi: 10.1523/JNEUROSCI.4177-03.2004. [DOI] [PMC free article] [PubMed] [Google Scholar]
- Melendez RI, Vuthiganon J, Kalivas PW. Regulation of extracellular glutamate in the prefrontal cortex: focus on the cystine–glutamate exchanger and group I metabotropic glutamate receptors. J Pharmacol Exp Ther. 2005;314:139–147. doi: 10.1124/jpet.104.081521. [DOI] [PubMed] [Google Scholar]
- Moussawi K, Pacchioni A, Moran M, Olive MF, Gass JT, Lavin A, Kalivas PW. N-Acetylcysteine reverses cocaine-induced metaplasticity. Nat Neurosci. 2009;12:182–189. doi: 10.1038/nn.2250. [DOI] [PMC free article] [PubMed] [Google Scholar]
- Murthy VN, Sejnowski TJ. Heterogeneous release properties of visualized individual hippocampal synapses. Neuron. 1997;18:599–612. doi: 10.1016/s0896-6273(00)80301-3. [DOI] [PubMed] [Google Scholar]
- Nicholson C. Diffusion and related transport mechanism in brain tissue. Reports on progress in physics. 2001;64:815–884. [Google Scholar]
- Nicholson C, Sykova E. ECS structure revealed by diffusion analysis. Trends in Neuroscience. 1998;21(5):207–215. doi: 10.1016/s0166-2236(98)01261-2. [DOI] [PubMed] [Google Scholar]
- Parsons CG, Danysz W, Zieglgansberger W. Excitatory amino acid neurotransmission. Handbook Exp Pharmacol. 2005;169:249–303. doi: 10.1007/3-540-28082-0_10. [DOI] [PubMed] [Google Scholar]
- Patneau DK, Mayer ML. Structure–activity relationships for amino acid transmitter candidates acting at N–methyl–D–aspartate and quisqualate receptors. J Neurosci. 1990;10:2385–2399. doi: 10.1523/JNEUROSCI.10-07-02385.1990. [DOI] [PMC free article] [PubMed] [Google Scholar]
- Pendyam S, Mohan A, Kalivas PW, Nair SS. Computational model of extracellular glutamate in the nucleus accumbens incorporates neuroadaptations by chronic cocaine. Neuroscience. 2009;158:1266–1276. doi: 10.1016/j.neuroscience.2008.11.014. [DOI] [PMC free article] [PubMed] [Google Scholar]
- Robinson TE, Kolb B. Alterations in the morphology of dendrites and dendritic spines in the nucleus accumbens and prefrontal cortex following repeated treatment with amphetamine or cocaine. Eur J Neurosci. 1999;11:1598–604. doi: 10.1046/j.1460-9568.1999.00576.x. [DOI] [PubMed] [Google Scholar]
- Rollenhagen A, Lubke JHR. The morphology of excitatory central synapses: from structure to function. Cell Tissue Res. 2006;326:221–237. doi: 10.1007/s00441-006-0288-z. [DOI] [PubMed] [Google Scholar]
- Rusakov DA. The role of perisynaptic glial sheaths in glutamate spillover and extracellular Ca2+ depletion. Biophys J. 2001;81:1947–1959. doi: 10.1016/S0006-3495(01)75846-8. [DOI] [PMC free article] [PubMed] [Google Scholar]
- Rusakov DA, Kullmann DM. Extrasynaptic glutamate diffusion in the hippocampus: ultrastructural constraints, uptake, and receptor activation. J Neurosci. 1998;18:3158–3170. doi: 10.1523/JNEUROSCI.18-09-03158.1998. [DOI] [PMC free article] [PubMed] [Google Scholar]
- Saftenku EE. Modeling of slow glutamate diffusion and AMPA receptor activation in the cerebellar glomerulus. J Theo Bio. 2005;234:363–382. doi: 10.1016/j.jtbi.2004.11.036. [DOI] [PubMed] [Google Scholar]
- Savtchenko LP, Rusakov DA. The optimal height of the synaptic cleft. Proc Natl Acad Sci USA. 2007;104(6):1823–1828. doi: 10.1073/pnas.0606636104. [DOI] [PMC free article] [PubMed] [Google Scholar]
- Schoepp DD, True RA. 1S, 3R–ACPD–sensitive (metabotropic) [3H] glutamate receptor binding in membranes. Neurosci Lett. 1992;145:100–104. doi: 10.1016/0304-3940(92)90213-q. [DOI] [PubMed] [Google Scholar]
- Stiles JR, Bartol TM. In: Computational Neuroscience: Realistic Modeling for Experimentalists. De Schutter E, editor. Boca Raton: CRC Press; 2001. pp. 87–127. [Google Scholar]
- Stiles JR, Van Helden D, Bartol TM, Jr, Salpeter EE, Salpeter MM. Miniature endplate current rise times <100 μs from improved dual recordings can be modeled with passive acetylcholine diffusion from a synaptic vesicle. Proc Natl Acad Sci USA. 1996;93:5747–5752. doi: 10.1073/pnas.93.12.5747. [DOI] [PMC free article] [PubMed] [Google Scholar]
- Sun W, Rebec GV. Repeated cocaine self–administration alters processing of cocaine–related information in rat prefrontal cortex. J Neurosci. 2006;26:8004–8008. doi: 10.1523/JNEUROSCI.1413-06.2006. [DOI] [PMC free article] [PubMed] [Google Scholar]
- Sun X, Milovanovic M, Zhao Y, Wolf ME. Acute and chronic dopamine receptor stimulation modulates AMPA receptor trafficking in nucleus accumbens neurons cocultured with prefrontal cortex neurons. J Neurosci. 2008;28:4216–4230. doi: 10.1523/JNEUROSCI.0258-08.2008. [DOI] [PMC free article] [PubMed] [Google Scholar]
- Sykova E. The ECS in the CNS: Its regulation, volume and geometry in normal and pathological neural function. The Neuroscientist. 1997;3:28–41. [Google Scholar]
- Sykova E. Extrasynaptic volume transmission and diffusion parameters of the ECS. Neuroscience. 2004;129:861–876. doi: 10.1016/j.neuroscience.2004.06.077. [DOI] [PubMed] [Google Scholar]
- Szumlinski KK, Abernathy KE, Oleson EB, Kullmann M, Lominac KD, He DY, Ron D, During M, Kalivas PW. Homer isoforms differentially regulate cocaine–induced neuroplasticity. Neuropsychopharmacology. 2006;4:768–777. doi: 10.1038/sj.npp.1300890. [DOI] [PubMed] [Google Scholar]
- Tao A, Tao L, Nicholson C. Cell cavities increase tortuosity in brain extracellular space. J Theo Bio. 2005;234:525–536. doi: 10.1016/j.jtbi.2004.12.009. [DOI] [PubMed] [Google Scholar]
- Tao L, Nicholson C. Maximal geometrical hindrance to diffusion in brain ECS surrounding uniformly spaced convex cells. J Theo Bio. 2004;229:59–68. doi: 10.1016/j.jtbi.2004.03.003. [DOI] [PubMed] [Google Scholar]
- Thomas MJ, Beurrier C, Bonci A, Malenka RC. Long term depression in the nucleus accumbens: a neural correlate of behavioral sensitization to cocaine. Nat Neurosci. 2001;4(12):1217–1223. doi: 10.1038/nn757. [DOI] [PubMed] [Google Scholar]
- Thorne RG, Nicholson C. In vivo diffusion analysis with quantum dots and dextrans predicts the width of brain ECS. Proc Natl Acad Sci USA. 2006;103(14):5567–5572. doi: 10.1073/pnas.0509425103. [DOI] [PMC free article] [PubMed] [Google Scholar]
- Timmerman W, Westerink BH. Brain microdialysis of GABA and glutamate: what does it signify? Synapse. 1997;27:242–261. doi: 10.1002/(SICI)1098-2396(199711)27:3<242::AID-SYN9>3.0.CO;2-D. [DOI] [PubMed] [Google Scholar]
- Trantham H, Szumlinski K, McFarland K, Kalivas PW, Lavin A. Repeated cocaine administration alters the electrophysiological properties of prefrontal cortical neurons. Neuroscience. 2002;113:749–757. doi: 10.1016/s0306-4522(02)00246-4. [DOI] [PMC free article] [PubMed] [Google Scholar]
- Volkow ND, Wang GJ, Telang F, Fowler JS, Logan J, Childress AR, Jayne M, Ma Y, Wong C. Cocaine cues and dopamine in dorsal striatum: mechanism of craving in cocaine addiction. J Neurosci. 2006;26:6583–6588. doi: 10.1523/JNEUROSCI.1544-06.2006. [DOI] [PMC free article] [PubMed] [Google Scholar]
- Volynski KE, Rusakov DA, Kullmann DM. Presynaptic fluctuations and release-independent depression. Nat Neurosci. 2006;9:1091–1093. doi: 10.1038/nn1746. [DOI] [PMC free article] [PubMed] [Google Scholar]
- Wadiche JI, Arriza JL, Amara SG, Kavanaugh MP. Kinetics of a human glutamate transporter. Neuron. 1995;14:1019–1027. doi: 10.1016/0896-6273(95)90340-2. [DOI] [PubMed] [Google Scholar]
- Wolf JA, Moyer JT, Lazarewicz MT, Contreras D, Benoit-Marand M, O'Donnell P, Finkel LH. NMDA/AMPA ratio impacts state transitions and entrainment to oscillations in a computational model of nucleus acumens medium spiny projection neuron. J Neurosci. 2005;25(40):9080–9095. doi: 10.1523/JNEUROSCI.2220-05.2005. [DOI] [PMC free article] [PubMed] [Google Scholar]
- Xi ZX, Baker DA, Shen H, Carson DS, Kalivas PW. Group II metabotropic glutamate receptors modulate extracellular glutamate in the nucleus accumbens. J Pharmacol Exp Ther. 2002;300:162–171. doi: 10.1124/jpet.300.1.162. [DOI] [PubMed] [Google Scholar]
- Xi ZX, Ramamoorthy S, Shen H, Lake R, Samuvel DJ, Kalivas PW. GABA transmission in the nucleus accumbens is altered after withdrawal from repeated cocaine. J Neurosci. 2003;23:3498–3505. doi: 10.1523/JNEUROSCI.23-08-03498.2003. [DOI] [PMC free article] [PubMed] [Google Scholar]
- Zheng K, Scimemi A, Rusakov DA. Receptor actions of synaptically released glutamate: The role of transporters on the scale from nanometers to microns. Biophys J. 2008;95:4584–4596. doi: 10.1529/biophysj.108.129874. [DOI] [PMC free article] [PubMed] [Google Scholar]