

Abstract
RNA modifications, especially methylation of the N6 position of adenosine (A)—m6A, represent an emerging research frontier in RNA biology. With the rapid development of high-throughput sequencing technology, in-depth study of m6A distribution and function relevance becomes feasible. However, a robust method to effectively identify m6A-modified regions has not been available yet. Here, we present a novel high-efficiency and user-friendly analysis pipeline called MeRIP-PF for the signal identification of MeRIP-Seq data in reference to controls. MeRIP-PF provides a statistical P-value for each identified m6A region based on the difference of read distribution when compared to the controls and also calculates false discovery rate (FDR) as a cut off to differentiate reliable m6A regions from the background. Furthermore, MeRIP-PF also achieves gene annotation of m6A signals or peaks and produce outputs in both XLS and graphical format, which are useful for further study. MeRIP-PF is implemented in Perl and is freely available at http://software.big.ac.cn/MeRIP-PF.html.
Keywords: RNA modification, m6A, Peak finding, MeRIP-Seq
Introduction
Multiple layers of epigenetic regulation including modification of DNA, RNA and proteins have been intensively explored. One of the major RNA modifications, m6A—methylation of the N6 position of adenosine (A)—represents an emerging research frontier in RNA biology and medicine [1]. Post transcriptionally added, m6A is an enzymatic modification of RNAs and the most common form found in the internal sequences of mRNAs in eukaryotes, as well as RNAs in nuclear-replicating viruses [2]. Unlike A-to-I RNA editing, m6A is nonstoichiometric and does not alter the coding capacity of transcripts [3,4] and may play roles in regulating RNA expression [1].
Along with the development of analytical and detection methods, such as MeRIP-Seq or m6A-seq [4,5], researchers are now able to carry out in-depth studies on m6A distribution and function of related genes. Next-generation sequencing (NGS) technologies render the identification of m6A-specific methylation of mRNAs possible through target enrichment, including immunoprecipitation [4,5]. As this strategy becomes popular, challenges are yet to be met for efficient data analysis, especially in peak finding. Due to fundamental technical differences of experimental protocols and the nature of the raw data, the existing peak-finding software packages, such as MACS [6] for ChIP-Seq and PARalyzer [7] for PAR-CLIP, are not suitable for MeRIP-Seq peak-finding. More importantly, there have not been tools or algorithms publically available for MeRIP-Seq data analysis yet.
Here, we present a highly-efficient and easy-to-use analysis pipeline, named MeRIP-PF (MeRIP-Seq data peak finding), which is a publicly-available tool and specially developed for the peak-calling of MeRIP-Seq data. MeRIP-PF has a powerful graphical display and can be readily used for the identification of m6A-modified regions and gene annotation.
Method
Formulation
If an mRNA contains m6A modification sites, the RNA fragment containing the sites can be pulled down by the anti-m6A antibody and sequenced subsequently. The m6A modified regions can be identified by mapping the sequencing reads to the reference sequence of a genome through comparison of read counts between the sample and the control (Figure 1A).
Figure 1.
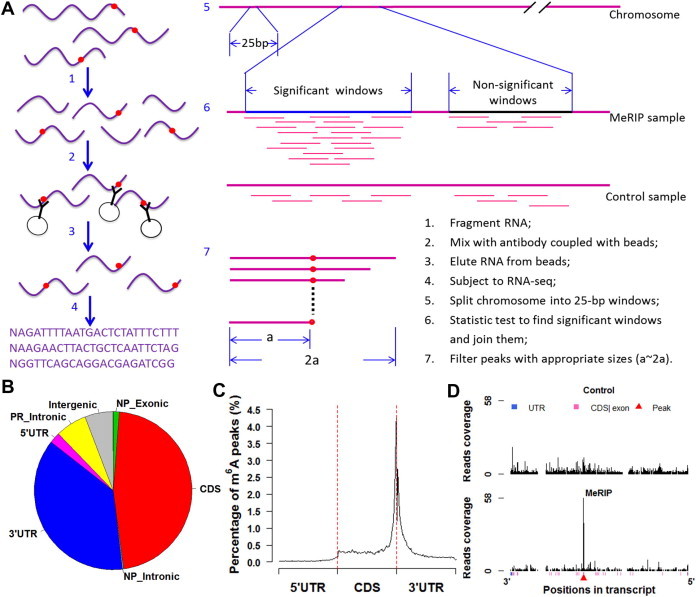
MeRIP-Seq, MeRIP-PF and result processing A. Schematic of MeRIP-Seq and MeRIP-PF pipelines (red dots indicate m6A sites). B. Distribution of m6A peaks in different regions of transcripts. Pie chart showing the percentage of m6A peaks within distinct regions of RNA. NP, non-protein-coding genes; PR, protein-coding genes. C. Distribution of m6A peaks along mRNAs. 5′ UTRs, CDSs and 3′ UTRs of every transcript are separately binned into regions spanning 1% of their total lengths. Y-coordinates represent percentage of m6A peaks located in every bin. D. An example of transcripts in wig plot. Y-coordinates show the read coverage of every position in transcripts. NM_009484 was taken as an example. Different regions of transcripts are color coded with UTR indicated in blue and CDS in pink, and intronic regions are indicated with blank space. Red triangle indicates the position of m6A peaks.
Input data
The pipeline requires two Fastq-formatted data. One is sequencing reads from m6A-containing RNA immunoprecipitated (MeRIP) sample, and the other is the corresponding reads from non-IP transcriptome, which serves as the background control. Additionally, users also need to prepare the genome reference sequence of the species and several annotated BED files with gene structure information, which we recommend downloading from the UCSC database (http://genome.ucsc.edu/cgi-bin/hgTables) directly.
Processing
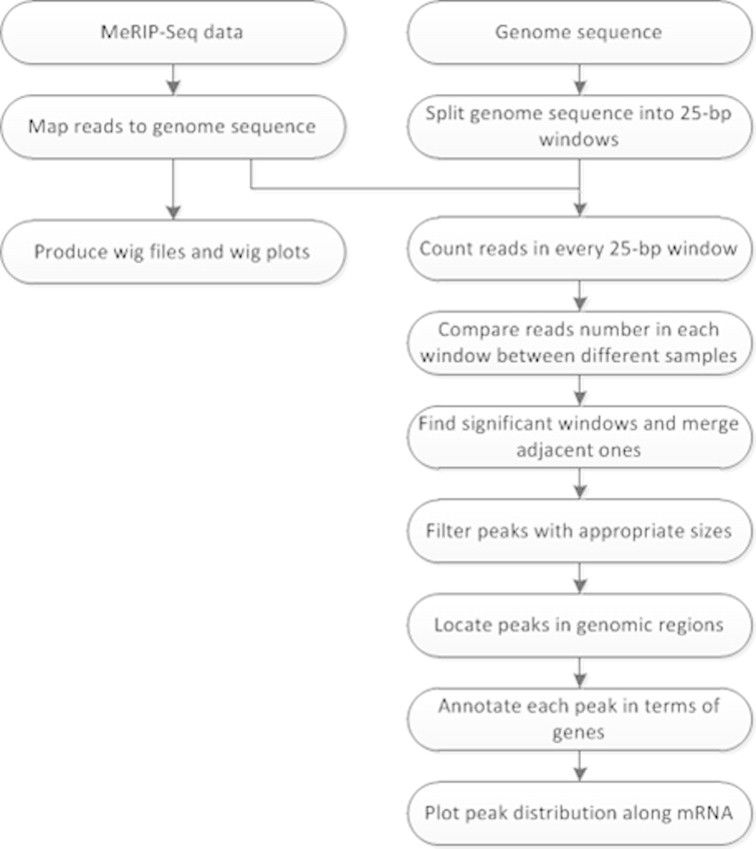
Figure 1A shows the process of MeRIP-Seq and the method for detecting m6A peaks (see detailed steps in Figure S1). We integrated four modules, including mapping, testing, annotating and plotting, into one command program to complete the analysis. The first module, i.e., sequence mapping, specifically yields two datasets in SAM-format, one from the MeRIP sample and the other from the control, by using the BWA software [8]. The uniquely-mapped reads (MAPQ ⩾ 20) are converted into BED files using SAMtools [9] and BEDTools [10]. The second module identifies m6A-modified regions in high resolution in reference to read coverage. The m6A signal peaks are defined based on comparison of read counts between the MeRIP data and the control data with a fixed 25-bp window across the genome. Based on one-tailed Fisher’s exact test and Benjamini–Hochberg method [11], both P-value and adjusted P-value (FDR) for each 25-bp window are calculated continuously to define significant sequence windows (FDR ⩽ 0.05). The significant and adjacent (no gaps present) windows are concatenated, while only those with appropriate sizes are considered as reliable and real peaks. The third module is used to annotate each peak in terms of peaks and genes (see Tables S1 and S2 where we just presented partial results derived from the published data [5]), and an enrichment score for each peak is also calculated. The fourth module is used to analyze m6A peak distribution at transcriptomic level and display read distribution along transcripts graphically. The peak counts are based on non-protein-coding and protein-coding genes, which are further divided into coding sequences (CDSs), introns, and untranslated regions (UTRs).
Output
MeRIP-PF generates 4 output files that contain the complete information of m6A modification profile. “Reads_Overview.txt” file supplies the basic status of the two sequencing datasets; “Peak_All.xls” file provides the absolute positions of m6A peaks in genome and mRNA regions; “Gene_List.xls” file presents the annotating information of m6A peaks at the gene level; and “Plot_Fig.pdf” file shows read distribution in the control and peak distribution in the MeRIP sample (Figure 1B), the distribution of m6A peaks along mRNAs (Figure 1C), and wig plots for transcripts with m6A peaks (Figure 1D).
Implementation
The pipeline program is written in Perl and runs in a Linux machine cluster with each node consisting of 8 cores with 2.00 GHz processor and 16G RAM. MeRIP-PF requires the installation of Perl and R language program, BWA, SAMtools and BEDTools. MeRIP-PF, along with an implementation file of the described method and Demo Datasets can be downloaded from the project website http://software.big.ac.cn/MeRIP-PF.html. The package requires the programming environment R. The R software is available at the website “The R Project for Statistical Computing” (http://www.r-project.org/).
Results and discussion
We tested MeRIP-PF performance using published adult mouse brains data (GSM854223 and GSM854224) with more than 30 millions reads for each sample [5]. By MeRIP-PF, we caught all high-confidence peaks in the previous study [5], which we named as “HC peaks”, but there are some differences between these two reports, which were shown in Table 1. We classified all peaks into four groups according to the fraction of peak region overlapping. In group A, 9555 peaks were “identical” between MeRIP-PF and “HC peaks”, which showed more than 75% overlap for each peak region. In group B, 3719 peaks were “similar”, which had 50–75% overlap for each peak region. In group C, 1772 peaks of MeRIP-PF had 0–50% overlap with 147 peaks in “HC peaks”, and we defined this group as “different”. In group D, there were 5153 peaks that had no overlap with “HC peaks” and we defined this group as “new”.
Table 1.
Peak-finding performance of MeRIP-PF
| Methods | No. of peaks | Group A |
Group B |
Group C |
Group D |
|---|---|---|---|---|---|
| Identical peaks (overlap ⩾ 75%) | Similar peaks (50% ⩽ overlap < 75%) | Different peaks (overlap < 50%) | New peaks (overlap = 0%) | ||
| Ref. [5] | 13,471 | 9555 | 3719 | 197 | |
| MeRIP-PF | 20,199 | 9555 | 3719 | 1772 | 5153 |
Note: The “overlap” we mean is reciprocal for peak M and peak N. In other words, if “overlap” is more than 75%, it requires that peak N overlaps at least 75% of peak M and that peak M also overlaps at least 75% of peak N.
We detected all the high-confidence peaks in the previous report [5], but there remained some differences in some peak regions in group A, B and C. Since the two methods were similar, the peak region differences might be due to the following two reasons: (1) although we both used default parameters of BWA software for reads mapping, use of different versions may contribute to difference of mapping results (we used bwa-0.6.2); (2) although uniquely-mapped reads were taken for further peaks calling in both reports, we regarded reads with MAPQ (mapping quality) ⩾ 20 as uniquely-mapped, while their criterion of filtering was not very clear. The differences of total uniquely-mapped read count and read number falling in each 25-bp window resulted in shift of peak regions. About those “new” peaks in group D, besides the aforementioned explanations, more importantly, they used multiple replicates samples to improve the confidence of m6A peaks [5]. We only used one replicate for analysis, so the “new” peaks are probably the low-confidence peaks. The distribution of time spent on processing GSM854223 and GSM854224 datasets is presented in Table 2. Apparently, the total time required depends much on mapping procedure which is closely related to sequencing quantity.
Table 2.
| Process | Timing (min) |
|---|---|
| Mapping | ∼200 |
| Statistical test | ∼15 |
| Annotation | ∼10 |
| Plotting | ∼10 |
Conclusion
As the first specific and easy-to-use pipeline for MeRIP-Seq data, MeRIP-PF provides outputs in both XLS and graphical format, which are important for deep analysis of m6A modification. We integrated four modules, including mapping, testing, annotating and plotting, into one command program to complete the analysis. The pipeline applies to MeRIP-Seq data with corresponding control samples.
Authors’ contributions
YL drafted the manuscript and developed the software. CL participated in the software design. SS proposed the idea of the software and revised the manuscript. JY revised the manuscript. All authors have read and approved the final manuscript.
Competing interests
The authors have no competing interests to declare.
Acknowledgements
We would like to thank all the members of Genome and Bioinformatics platform in Beijing Institute of Genomics for their assistance during the pipeline development. This work was supported by Grants from the Ministry of Science and Technology of China (Grant No. 2011CB944100) to JY, the Natural Science Foundation (Grant No. 30900831 and 31271372) and Beijing Nova Program (Grant No. Z121105002512060) to SS.
Footnotes
Peer review under responsibility of Beijing Institute of Genomics, Chinese Academy of Sciences and Genetics Society of China.

Appendix Supplementary. material
Supplementary Fig. S1.
References
- 1.He C. Grand challenge commentary: RNA epigenetics? Nat Chem Biol. 2010;6:863–865. doi: 10.1038/nchembio.482. [DOI] [PubMed] [Google Scholar]
- 2.Bokar J.A. In: Grosjean H., editor. vol. 12. Springer; 2005. pp. 141–177. (Fine-tuning of RNA functions by modification and editing). [Google Scholar]
- 3.Dai Q., Fong R., Saikia M., Stephenson D., Yu Y.T., Pan T. Identification of recognition residues for ligation-based detection and quantitation of pseudouridine and N6-methyladenosine. Nucleic Acids Res. 2007;35:6322–6329. doi: 10.1093/nar/gkm657. [DOI] [PMC free article] [PubMed] [Google Scholar]
- 4.Dominissini D., Moshitch-Moshkovitz S., Schwartz S., Salmon-Divon M., Ungar L., Osenberg S. Topology of the human and mouse m6A RNA methylomes revealed by m6A-seq. Nature. 2012;485:201–206. doi: 10.1038/nature11112. [DOI] [PubMed] [Google Scholar]
- 5.Meyer K.D., Saletore Y., Zumbo P., Elemento O., Mason C.E., Jaffrey S.R. Comprehensive analysis of mRNA methylation reveals enrichment in 3′ UTRs and near stop codons. Cell. 2012;149:1635–1646. doi: 10.1016/j.cell.2012.05.003. [DOI] [PMC free article] [PubMed] [Google Scholar]
- 6.Zhang Y., Liu T., Meyer C.A., Eeckhoute J., Johnson D.S., Bernstein B.E. Model-based analysis of ChIP-Seq (MACS) Genome Biol. 2008;9:R137. doi: 10.1186/gb-2008-9-9-r137. [DOI] [PMC free article] [PubMed] [Google Scholar]
- 7.Corcoran D.L., Georgiev S., Mukherjee N., Gottwein E., Skalsky R.L., Keene J.D. PARalyzer: definition of RNA binding sites from PAR-CLIP short-read sequence data. Genome Biol. 2011;12:R79. doi: 10.1186/gb-2011-12-8-r79. [DOI] [PMC free article] [PubMed] [Google Scholar]
- 8.Li H., Durbin R. Fast and accurate short read alignment with Burrows–Wheeler transform. Bioinformatics. 2009;25:1754–1760. doi: 10.1093/bioinformatics/btp324. [DOI] [PMC free article] [PubMed] [Google Scholar]
- 9.Li H., Handsaker B., Wysoker A., Fennell T., Ruan J., Homer N. The sequence alignment/map format and SAMtools. Bioinformatics. 2009;25:2078–2079. doi: 10.1093/bioinformatics/btp352. [DOI] [PMC free article] [PubMed] [Google Scholar]
- 10.Quinlan A.R., Hall I.M. BEDTools: a flexible suite of utilities for comparing genomic features. Bioinformatics. 2010;26:841–842. doi: 10.1093/bioinformatics/btq033. [DOI] [PMC free article] [PubMed] [Google Scholar]
- 11.Benjamini Y., Hochberg Y. Controlling the false discovery rate: a practical and powerful approach to multiple testing. J R Stat Soc B. 1995;57:289–300. [Google Scholar]
Associated Data
This section collects any data citations, data availability statements, or supplementary materials included in this article.