

Abstract
Endogenously-encoded microRNAs (miRNAs) are a class of small regulatory RNAs that modulate gene expression at the post-transcriptional level. In plants, miRNAs have increasingly been identified by experiments based on next-generation sequencing (NGS). However, promoter organization is currently unknown for most plant miRNAs, which are transcribed by RNA polymerase II. This deficiency prevents a comprehensive understanding of miRNA-mediated gene networks. In this study, by analyzing full-length cDNA sequences related to miRNAs, we mapped transcription start sites (TSSs) for 62 and 55 miRNAs in Arabidopsis and rice, respectively. The average free energy (AFE) profiles in the vicinity of TSSs were studied for both species. By employing position weight matrices (PWM) for 99 plant cis-elements, we discovered that three cis-elements were over-represented in the miRNA promoters of both species, while four and ten cis-elements were over-represented in Arabidopsis only and in rice only. Thus, comparison of miRNA promoters between Arabidopsis and rice provides a new perspective for studying miRNA regulation in plants.
Keywords: Promoter, MicroRNA, Gene expression, Arabidopsis, Rice, Comparative genomics
Introduction
Following the initial discovery in the worm Caenorhabditis elegans [1,2], microRNAs (miRNAs) are increasingly recognized as an important class of regulatory small RNA molecules in both animals and plants [3,4]. Endogenous miRNAs are encoded by MIR genes that are transcribed by RNA polymerase II [3,4]. The 20–24 nucleotide long mature miRNAs are processed from the primary transcripts called pri-miRNAs via stem-loop structured intermediates called pre-miRNAs [3–5]. In higher plants, both pri-miRNAs and pre-miRNAs are processed in the nucleus mainly by the endonuclease DICER-LIKE1 [6]. Mature miRNAs are then transported to the cytoplasm and integrated into the RNA-induced silencing complex (RISC) [7,8]. After integration into RISC, miRNAs interact with their cognate target transcripts through base pairing. In plants, such interactions typically lead to repression of gene expression through cleavage [9,10] or translational inhibition of the target mRNA [11]. Down regulation of transcription by miRNA-directed DNA methylation at the target loci has also been reported in plants [12].
Given the critical role of miRNAs in gene regulation, temporal and spatial control of the expression of individual MIR genes needs to be elucidated before arriving at a complete understanding of the gene networks mediated by miRNAs. In plants, several studies have been carried out to computationally identify and analyze the miRNA promoters [13,14]. Results from these studies indicate that there are certain cis-regulatory elements enriched in the miRNA promoters [13]. In contrast to well-established programs for predicting the secondary structure of miRNA precursors or the miRNA-target interactions, computational methods to identify the promoter regions only have limited success.
Pinpointing the transcription start site (TSS) by locating the 5′ end of primary transcript represents another approach to map the miRNA promoter. Using experimentally-obtained 5′ transcript ends, Xie et al. successfully mapped the TSSs for 52 MIR genes in Arabidopsis [15]. However, technical demands of this approach indicate that it is impractical for other plant species. On the other hand, full-length cDNA clones are regarded as critical resources for post-genomic research and have been extensively collected and sequenced in Arabidopsis, rice and tomato [16–19]. Utilization of these resources should generate knowledge on miRNA primary transcripts and facilitate further understanding of cis-regulatory elements governing miRNA transcription.
The goal of the current study is to identify and compare the promoter regions of miRNA genes between Arabidopsis and rice. Toward this goal, we mapped full-length cDNA sequences available to annotated miRNAs and collected TSS information for 62 and 55 miRNAs in Arabidopsis and rice, respectively. We then employed 99 position weight matrices (PWM) and discovered cis-elements that are statistically over-represented in Arabidopsis or rice miRNA promoters. This work thus represents a step forward in understanding regulation of miRNA genes in plants.
Results and discussion
Determination of TSSs for miRNAs by full-length cDNA mapping
The overall workflow of the current work is to employ full-length cDNA available in the model plants Arabidopsis and rice to precisely pinpoint the TSS for miRNA genes, and then use such information to analyze and compare the promoter features between the two species. To this end, we first mapped to the genome sequences the 299 and 591 annotated miRNA precursors in Arabidopsis and rice [20], respectively. We then mapped >155,000 full length-cDNA sequences in Arabidopsis [16] and >28,000 in rice [17] to the corresponding genomes. Inspection of the mapping results indicates that there are 40 miRNA precursors located within full-length cDNA mapped loci in Arabidopsis. Further aligning the mapped regions to the annotated gene models revealed that out of the 40 miRNAs, one resides in the 5′ UTR of protein-coding genes, one in exonic region, 13 in the intronic region, and four in the 3′ UTR (Figure 1). Because these miRNAs are embedded within other genes and likely controlled by the host gene promoter [21], they were excluded from further analysis. For the 21 miRNAs mapped to full-length cDNA and intergenic region, we consider the 5′ end of the corresponding full length-cDNA sequence as the TSS for the miRNA. Combining this data with the previous dataset [15], we came up with a total of 62 miRNAs with experimentally-determined TSSs in Arabidopsis.
Figure 1.
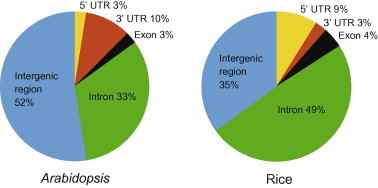
Distribution of full-length cDNA supported miRNAs in the annotated gene structures in Arabidopsis and rice Pre-miRNAs and full-length cDNA sequences were aligned to the corresponding genome. Mapped pre-miRNAs in each species were grouped based on their physical relation with annotated gene models.
In rice, 157 miRNA precursors were found to be supported by full-length cDNA sequences. Of these, 77 reside in the intron of protein-coding genes, 14 in the 5′ UTR, four in the 3′ UTR, and seven in the exon (Figure 1). After excluding miRNAs embedded in protein-coding genes, 55 miRNAs in rice were found in intergenic regions and their TSSs were assigned based on the full-length cDNA sequences. Even though the sample size is small for both species, it is interesting to notice that the proportions of miRNAs mapped to the introns and the intergenic regions are reversed in rice compared to those in Arabidopsis. It is currently unknown whether this phenomenon reflects different genome organization of miRNAs genes in the two species or is related to the quality of miRNA annotation.
DNA features at the miRNA TSSs
To systematically compare miRNA promoters between Arabidopsis and rice, we first calculated the distance from the TSS to the first nucleotide of the miRNA precursors. Consistent with the compact genome, more than 85% miRNAs in Arabidopsis have a distance between TSS and the stem-loop structured precursor of <1 kb. This distance is less than 200 bp for more than 70% miRNAs in Arabidopsis (Figure 2). By contrast, just over one third miRNAs in rice have their TSSs within 200 bp from the precursors and this distance can be as far as more than 3 kb (Figure 2). Therefore, this analysis indicates that, if our finding is applicable to all miRNAs, it is not suitable to use the first nucleotide of the miRNA precursor as the surrogate for TSS in functional studies of the promoters in rice.
Figure 2.
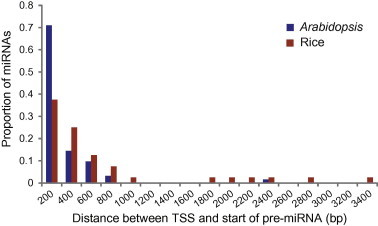
Distance between TSS and the start of miRNA precursor Distance in nucleotides between the TSS and the first nucleotide of the pre-miRNA was calculated for 62 miRNAs in Arabidopsis and 55 in rice. The proportion of miRNAs having a given distance in 200 bp intervals in both species is respectively plotted.
We next compared the DNA structural features around miRNA TSSs between Arabidopsis and rice. To this end, average free energy (AFE) profiles in DNA melting were generated for genomic regions at the vicinity of TSSs in both plants. Using random sequences as a control, we found that Arabidopsis miRNAs exhibit higher AFE (∼1.5 kcal/mol) upstream of the TSS than the downstream region (Figure 3). Further, a sharp spike immediately upstream of the TSS is observed (Figure 3), similar to what was reported for protein-coding genes in Arabidopsis [22]. As previously reported [22], DNA corresponding to the spike was found to be enriched with several AT-rich tetramers such as TATA-box. Overall, the AFE profile around the TSS of miRNAs is consistent with the regulatory landscape that the promoter region is thermodynamically less stable than the downstream transcribed region to favor transcription factor binding and transcription initiation.
Figure 3.
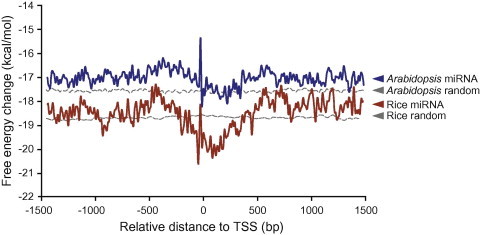
Comparison of AFE profiles in the vicinity of miRNA TSS in Arabidopsis and rice AFE profiles were generated over the −1500 to +1500 bp region with respect to TSS of miRNAs using a sliding window approach. The AFE values for 1000 randomly-selected genomic sequences in Arabidopsis and rice was calculated as a control and shown as dashed lines. AFE, average free energy.
In rice, AFE profiles for both the genomic control and the miRNAs have lower values than those in Arabidopsis (Figure 3). As GC-rich sequences tend to be more stable in DNA melting, this observation could be accounted for by the higher GC content in the rice genome. Compared to genomic control, significant AFE changes (∼3 kcal/mol) between upstream and downstream regions of TSS were observed in rice as well as the spike immediately upstream of TSS (Figure 3). Taken together, the AFE profiles around TSS indicate high similarity of DNA structural features between miRNA genes in Arabidopsis and rice and between miRNAs and protein-coding genes.
Analyzing the cis-regulatory elements in miRNA promoters
The TSS information for miRNAs in Arabidopsis and rice enabled us to precisely pinpoint the promoter region and study the composition of cis-regulatory motifs. Previously, 99 PWM derived from known transcription factor binding sites were used to search 52 miRNA promoters in Arabidopsis [13]. It was shown that 90% of predicted cis-elements were within the 800 bp upstream region from TSS and that four cis-elements, TATA-box, AtMYC2, ARF, and SORLREP3 were most enriched in miRNA promoters based on posterior probability against random genomic sequences [13]. In this study, we used DNA fragment corresponding to the 1 kb upstream region from TSS to comprehensively identify putative cis-regulatory elements. Using the same PWM procedure, we analyzed miRNA promoters in both Arabidopsis and rice. We found from the expanded Arabidopsis miRNA dataset that three of the four motifs (except ARF) were indeed over-represented in miRNA promoters. Additionally, we found four more cis-elements (G-box, RY-repeat, LTRE and AtMYB2) that also show significant enrichment in Arabidopsis miRNA promoters based on high posterior probability (P(PmiRNA > Prandom) > 0.85; Figure 4).
Figure 4.
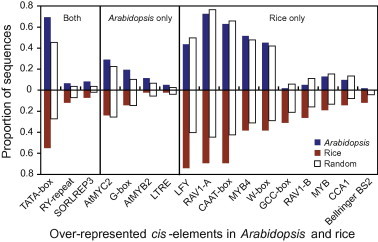
Over-represented cis-elements in miRNA promoters Upstream 1 kb regions from the TSS of miRNAs in Arabidopsis and rice were scanned for cis-elements using 99 PWM. Compared to random genomic sequences in the two species, cis-elements with posterior probability (PmiRNA > Prandom) greater than 0.85 were considered to be over-represented in miRNA promoters. Proportion of miRNA promoters containing a given cis-element is shown as blue (Arabidopsis) and red (rice) bars while proportion of the random genome loci containing these cis-elements is shown as blank bars. Cis-elements over-represented in both Arabidopsis and rice, in Arabidopsis or rice alone are shaded as indicated.
In rice, using the same cutoff of posterior probability (P(PmiRNA > Prandom) > 0.85), we identified a total of 13 cis-elements enriched for miRNA promoters. By comparing rice and Arabidopsis, we found that three of these elements, TATA-box, RY-repeat and SORLREP3, are enriched for miRNA promoters in both species (Figure 4), suggesting that these cis-elements are fundamental to the expression of miRNAs. However, the other 10 enriched cis-elements (LFY, RAV1A, CAAT-box, MYB4, W-box, GCC-box, RAV1B, MYB, CCA1 and Bellringer BS2) in rice were not found to be over-represented in Arabidopsis. Conversely, the four cis-elements (AtMYC2, G-box, AtMYB2, and LTRE) enriched for Arabidopsis miRNAs were not over-represented in rice (Figure 4). As the PWM were primarily derived from data in Arabidopsis, these findings will need to be validated with data from rice in the future.
Arabidopsis and rice are respective models for dicotyledonous and monocotyledonous plants. In the current work, genome-wide searches of full-length cDNA yielded a sizable number of TSSs for miRNAs in both species. Our analysis indicates that the general structural features of miRNA promoters are similar to those of the protein-coding genes, which is consistent with the observation that most MIR genes are transcribed by RNA polymerase II [15,23,24]. Based on available PWM, cross-species comparison suggests that putative cis-regulatory elements in miRNA promoters display different degree of conservation. It is believed that new miRNAs have continuously appeared during evolution. These miRNAs, once incorporated into the gene regulatory networks, could generate genetic novelty in different plant lineages if their regulatory regions are different. Additional studies aimed at determining the precise function of the cis-elements should provide further insight into the complexity and evolution of miRNA-mediated gene networks in plants.
Methods
Data source
Annotated whole genome sequences, intron sequences and other gene model features of Arabidopsis and rice used in this study were downloaded from release 10 of The Arabidopsis Information Resource (TAIR) database (http://www.arabidopsis.org/) and release 6.1 of the Rice Genome Annotation Project (http://www.rice.plantbiology.msu.edu/). Arabidopsis and rice miRNA datasets were obtained from the miRBase [20] (release 19.0; http://www.mirbase.org/). Full-length cDNA sequences in Arabidopsis [16] and rice [17] were downloaded from http://www.rarge.psc.riken.jp/ and http://www.cdna01.dna.affrc.go.jp/cDNA/, respectively.
Mapping of full-length cDNA sequences
The >155,000 full-length cDNA sequences from Arabidopsis and >28,000 from rice were mapped to the corresponding genome assemblies using the BLAT program [25]. Following previously-reported criteria [18], only alignment has >90% coverage and >95% identity was accepted. Only the sequence hit with the highest score was considered as the correctly-mapped locus and the genomic position was recorded [18]. Full-length cDNA sequences that can be mapped to more than one locus with similarly high scores were excluded.
Generation of AFE profiles
The 62 and 55 miRNA loci in Arabidopsis and rice, respectively, were aligned within each group with the TSS set as the 0 position. The genomic sequences in the −1500 to 1500 region relative to the TSS were scanned by calculating the mean value of free energy in DNA melting at each position to generate the AFE profiles. The calculation was performed using dinucleotide parameters in DNA melting based on previous models [26,27]. A previously-described method was then employed to reduce noise [22], in which the dinucleotide parameters were averaged over a 15 bp sliding window with one nucleotide step. After that, the mean value assigned to the midpoint of each window was used to generate the AFE profile over the entire sequences. As a control in both Arabidopsis and rice, 1000 3-kb-long genomic sequences were randomly selected and subject to the same AFE profiling procedure.
Analysis of cis-elements
A previously-described method [13] was followed to identify putative cis-regulatory elements in the miRNA promoters. In brief, PWM for 99 transcription factor binding sites [13] were used to scan the 1 kb region upstream of the TSS for 62 and 55 miRNA genes in Arabidopsis and rice. Threshold employed for a specific matrix was set as the lowest score from using the matrix against all validated binding sites. As controls, 1000 genomic sequences (1 kb long each) from Arabidopsis and rice were randomly selected and subject to PWM analysis. For each cis-element identified in the miRNA promoters, proportion of sequences found to contain at least one copy of the cis-element was calculated for miRNA genes (PmiRNA) and the random sequences (Prandom) in both species. Posterior probability for two comparisons (PmiRNA > Prandom and PmiRNA < Prandom) was calculated using 10,000 times Monte Carlo simulation in Matlab. For a given cis-element, if the posterior probability of (PmiRNA > Prandom) is greater than 0.85, it was considered to be enriched in miRNA promoters.
Authors’ contributions
LL designed the project. XZ performed the experiments and wrote the manuscript. LL revised the manuscript. Both authors read and approved the final manuscript.
Competing interests
The authors have declared that no competing interests exist.
Acknowledgements
This work was supported by a Grant from the National Science Foundation (Grant No. DBI-0922526).
Footnotes
Peer review under responsibility of Beijing Institute of Genomics, Chinese Academy of Sciences and Genetics Society of China.

References
- 1.Lee R.C., Feinbaum R.L., Ambros V. The C. elegans heterochronic gene lin-4 encodes small RNAs with antisense complementarity to lin-14. Cell. 1993;75:843–854. doi: 10.1016/0092-8674(93)90529-y. [DOI] [PubMed] [Google Scholar]
- 2.Wightman B., Ha I., Ruvkun G. Posttranscriptional regulation of the heterochronic gene lin-14 by lin-4 mediates temporal pattern formation in C. elegans. Cell. 1993;75:855–862. doi: 10.1016/0092-8674(93)90530-4. [DOI] [PubMed] [Google Scholar]
- 3.Bartel D.P. MicroRNAs: genomics, biogenesis, mechanism and function. Cell. 2004;116:281–297. doi: 10.1016/s0092-8674(04)00045-5. [DOI] [PubMed] [Google Scholar]
- 4.Voinnet O. Origin, biogenesis, and activity of plant microRNAs. Cell. 2009;136:669–687. doi: 10.1016/j.cell.2009.01.046. [DOI] [PubMed] [Google Scholar]
- 5.Yang X., Zhang H., Li L. Alternative mRNA processing increases the complexity of microRNA-based gene regulation in Arabidopsis. Plant J. 2012;70:421–431. doi: 10.1111/j.1365-313X.2011.04882.x. [DOI] [PubMed] [Google Scholar]
- 6.Papp I., Mette M.F., Aufsatz W., Daxinger L., Schauer S.E., Ray A. Evidence for nuclear processing of plant micro RNA and short interfering RNA precursors. Plant Physiol. 2003;132:1382–1390. doi: 10.1104/pp.103.021980. [DOI] [PMC free article] [PubMed] [Google Scholar]
- 7.Khvorova A., Reynolds A., Jayasena S.D. Functional siRNAs and miRNAs exhibit strand bias. Cell. 2003;115:209–216. doi: 10.1016/s0092-8674(03)00801-8. [DOI] [PubMed] [Google Scholar]
- 8.Schwarz D.S., Hutvagner G., Du T., Xu Z., Aronin N., Zamore P.D. Asymmetry in the assembly of the RNAi enzyme complex. Cell. 2003;115:199–208. doi: 10.1016/s0092-8674(03)00759-1. [DOI] [PubMed] [Google Scholar]
- 9.Llave C., Xie Z., Kasschau K.D., Carrington J.C. Cleavage of Scarecrow-like mRNA targets directed by a class of Arabidopsis miRNA. Science. 2002;297:2053–2056. doi: 10.1126/science.1076311. [DOI] [PubMed] [Google Scholar]
- 10.Reinhart B.J., Weinstein E.G., Rhoades M.W., Bartel B., Bartel D.P. MicroRNAs in plants. Genes Dev. 2002;16:1616–1626. doi: 10.1101/gad.1004402. [DOI] [PMC free article] [PubMed] [Google Scholar]
- 11.Brodersen P., Sakvarelidze-Achard L., Bruun-Rasmussen M., Dunoyer P., Yamamoto Y.Y., Sieburth L. Widespread translational inhibition by plant miRNAs and siRNAs. Science. 2008;320:1185–1190. doi: 10.1126/science.1159151. [DOI] [PubMed] [Google Scholar]
- 12.Wu L., Zhou H., Zhang Q., Zhang J., Ni F., Liu C. DNA methylation mediated by a microRNA pathway. Mol Cell. 2010;38:465–475. doi: 10.1016/j.molcel.2010.03.008. [DOI] [PubMed] [Google Scholar]
- 13.Megraw M., Baev V., Rusinov V., Jensen S.T., Kalantidis K., Hatzigeorgiou A.G. MicroRNA promoter element discovery in Arabidopsis. RNA. 2006;12:1612–1619. doi: 10.1261/rna.130506. [DOI] [PMC free article] [PubMed] [Google Scholar]
- 14.Zhou X., Ruan J., Wang G., Zhang W. Characterization and identification of microRNA core promoters in four model species. PLoS Comput Biol. 2007;3:e37. doi: 10.1371/journal.pcbi.0030037. [DOI] [PMC free article] [PubMed] [Google Scholar]
- 15.Xie Z., Allen E., Fahlgren N., Calamar A., Givan S.A., Carrington J.C. Expression of Arabidopsis MIRNA genes. Plant Physiol. 2005;138:2145–2154. doi: 10.1104/pp.105.062943. [DOI] [PMC free article] [PubMed] [Google Scholar]
- 16.Seki M., Satou M., Sakurai T., Akiyama K., Iida K., Ishida J. RIKEN Arabidopsis full-length (RAFL) cDNA and its applications for expression profiling under abiotic stress conditions. J Exp Bot. 2004;55:213–223. doi: 10.1093/jxb/erh007. [DOI] [PubMed] [Google Scholar]
- 17.Rice Full-Length cDNA Consortium Collection, mapping, and annotation of over 28,000 cDNA clones from japonica rice. Science. 2003;301:376–379. doi: 10.1126/science.1081288. [DOI] [PubMed] [Google Scholar]
- 18.Satoh K., Doi K., Nagata T., Kishimoto N., Suzuki K., Otomo Y. Gene organization in rice revealed by full-length cDNA mapping and gene expression analysis through microarray. PLoS One. 2007;2:e1235. doi: 10.1371/journal.pone.0001235. [DOI] [PMC free article] [PubMed] [Google Scholar]
- 19.Aoki K., Yano K., Suzuki A., Kawamura S., Sakurai N., Suda K. Large-scale analysis of full-length cDNAs from the tomato (Solanum lycopersicum) cultivar Micro-Tom, a reference system for the Solanaceae genomics. BMC Genomics. 2010;11:210. doi: 10.1186/1471-2164-11-210. [DOI] [PMC free article] [PubMed] [Google Scholar]
- 20.Kozomara A., Griffiths-Jones S. MiRBase: integrating microRNA annotation and deep-sequencing data. Nucleic Acids Res. 2011;39:D152–D157. doi: 10.1093/nar/gkq1027. [DOI] [PMC free article] [PubMed] [Google Scholar]
- 21.Baskerville S., Bartel D.P. Microarray profiling of microRNAs reveals frequent coexpression with neighboring miRNAs and host genes. RNA. 2005;11:241–247. doi: 10.1261/rna.7240905. [DOI] [PMC free article] [PubMed] [Google Scholar]
- 22.Morey C., Mookherjee S., Rajasekaran G., Bansal M. DNA free energy-based promoter prediction and comparative analysis of Arabidopsis and rice genomes. Plant Physiol. 2011;156:1300–1315. doi: 10.1104/pp.110.167809. [DOI] [PMC free article] [PubMed] [Google Scholar]
- 23.Cai X., Hagedorn C.H., Cullen B.R. Human microRNAs are processed from capped, polyadenylated transcripts that can also function as mRNAs. RNA. 2004;10:1957–1966. doi: 10.1261/rna.7135204. [DOI] [PMC free article] [PubMed] [Google Scholar]
- 24.Lee Y., Kim M., Han J., Yeom K.H., Lee S., Baek S.H. MicroRNA genes are transcribed by RNA polymerase II. EMBO J. 2004;23:4051–4060. doi: 10.1038/sj.emboj.7600385. [DOI] [PMC free article] [PubMed] [Google Scholar]
- 25.Kent W.J. BLAT: the BLAST-like alignment tool. Genome Res. 2002;12:656–664. doi: 10.1101/gr.229202. [DOI] [PMC free article] [PubMed] [Google Scholar]
- 26.Allawi H.T., SantaLucia J., Jr. Thermodynamics and NMR of internal GT mismatches in DNA. Biochemistry. 1997;36:10581–10594. doi: 10.1021/bi962590c. [DOI] [PubMed] [Google Scholar]
- 27.SantaLucia J., Jr. A unified view of polymer, dumbbell, and oligonucleotide DNA nearest-neighbor thermodynamics. Proc Natl Acad Sci U S A. 1998;95:1460–1465. doi: 10.1073/pnas.95.4.1460. [DOI] [PMC free article] [PubMed] [Google Scholar]