

Abstract
The chain of events leading from a toxic compound exposure to carcinogenicity is still barely understood. With the emergence of high-throughput sequencing, it is now possible to discover many different biological components simultaneously. Using two different RNA libraries, we sequenced the complete transcriptome of human HepG2 liver cells exposed to benzo[a]pyrene, a potent human carcinogen, across six time points. Data were integrated in order to reveal novel complex chemical–gene interactions. Notably, we hypothesized that the inhibition of MGMT, a DNA damage response enzyme, by the over-expressed miR-181a-1_3p induced by BaP, may lead to liver cancer over time.
INTRODUCTION
For over 40 years, chemical carcinogenesis has been assessed using the 2-year rodent bioassay. This expensive, time consuming and laborious test is highly criticized for its low correlation percentage of relevance with human observations (1). Several initiatives proposed to evolve toxicology beyond this state of mainly observational science to a more predictive oriented field, by notably replacing the 2-year rodent assay by high-throughput datasets of human in vitro exposed cell models (2). These new toxicogenomics methods have already generated interesting classification results for predicting compound genotoxicity (3) or liver carcinogenicity (4).
With the majority of toxicogenomics research up to now involving DNA microarray technologies, the exploding high-throughput sequencing (HTS) techniques will certainly become the golden standard for understanding molecular mechanisms leading to toxicity or carcinogenicity (5). Previously, we applied this technology to assess the mRNA expression profile of HepG2 cells exposed to the prototypical human carcinogen benzo[a]pyrene (BaP) over a period of 24 h (6). BaP is a polycyclic aromatic hydrocarbon (PAH) widespread in the environment and in food, and is formed mainly during incomplete combustion of organic material (such as fossil fuels) or by smoking. BaP possesses heterogeneous toxic properties and its metabolites are not only known to be DNA-reactive and to generate reactive oxygen species (7) but BaP is also assumed to activate the transcription factor AhR (aryl hydrocarbon receptor), which was shown to be able to mediate hepatocarcinogenesis in humans (8). In our pilot study, HTS pointed out novel isoforms and alternative transcripts resulting from BaP exposure, notably from genes involved in DNA damage response and apoptosis (TP53, BCL2 and XPA).
In order to enrich our understanding of chemically induced mechanism leading to carcinogenicity, we now explored the variety of biological entities across time. Thus, we sequenced the complete RNA panel, after the depletion of ribosomal RNA. Furthermore, since microRNAs (miRNAs) have been shown to have a key role in toxicological responses in cells (9), we also sequenced libraries of small RNA obtained from the same biological samples.
Having generated complete RNA-seq libraries, we also had the opportunity to study a recently discovered new class of RNA: the circular RNAs (10–12). In particular, the circRNA CDR1as works as a post-transcriptional regulator by having 63 conserved targets against miR-7.
In order to integrate results on RNAs, miRNAs and circRNAs in a mechanistically plausible manner, where it is postulated that processes which cluster over time, are functionally interrelated, we evaluated data generated at six different time points during BaP exposure (6, 12, 18, 24, 36 and 48 h).
MATERIALS AND METHODS
Chemicals
Benzo[a]pyrene (inchikey FMMWHPNWAFZXNH-UHFFFAOYSA-N) of 96% purity was purchased from Sigma–Aldrich (Zwijndrecht, the Netherlands). The compound was dissolved in dimethylsulfoxide (DMSO) obtained from Sigma–Aldrich.
Cell culture and treatment
Human hepatocellular carcinoma HepG2 cells obtained from ATCC (HB-6065) were used as a cell model. HepG2 cells were cultured as a monolayer in 95% humidity, with 5% CO2 atmosphere at 37°C. The cells were cultured in a minimal essential medium (MEM) with 10% of fetal bovine serum (FBS), 1% penicillin/streptomycin, 1% sodium-pyruvate and 1% non-essential amino acids. All reagents were obtained from Gibco BRL (Breda, the Netherlands). Passages were done at pre-confluent densities by standard trypsin–ethylenediaminetetraacetic acid (EDTA) solution. Three hundred thousand cells were used in each well of a six-wells microtiter plate. At 80% confluence, the medium was replaced with fresh medium containing either 2 mM of BaP or by the control vehicule (0.5% DMSO) during six different exposure time (6, 12, 18, 24, 36 and 48 h) in two independent experiments (biological replicates).
RNA isolation
Total RNA from the cell culture was isolated from each sample using the miRNeasy mini kit (Qiagen Westburg BV, Leusden, the Netherlands) according to manufacturer's protocol, followed by a DNAse I treatment (Qiagen Inc). Total RNA concentration and quality were measured by means of a BioAnalyser system (Agilent Technologies, Breda, the Netherlands). All sequenced samples were generated from high quality RNA samples having a RIN number above 8.
Library preparation and sequencing of RNA
First, Total RNA was treated with the Epicentre Ribo-Zero kit (cat.#MRZH11124) to remove the all the rRNAs. The remaining RNAs were processed using the TruSeq RNA Sample Prep Kit according to the Illumina protocol. After cDNA synthesis, 6.5 pmol of DNA from each sample were clustered and sequenced on the Illumina HiSeq 2000 (Illumina) in 100 bp paired-end reads. Ribo-depleted RNA raw data are available on arrayExpress (accession number: E-MTAB-3292) Sequence quality was analyzed (Supplementary data 1) using the quality control software FastQC 0.10.1 (http://www.bioinformatics.babraham.ac.uk/projects/fastqc/).
Small RNA sequencing
Starting from the total RNA samples, small RNAs were size selected and ligated for sequencing following the TruSeq Small Prep Kit Preparation (Illumina, 15004197 Rev. D). Samples were sequenced on the HiSeq 2000 (Illumina) in paired-end 100 bp. Small RNA raw data are available on arrayExpress (accession number: E-MTAB-3251).
RNA-SEQ analysis
RNA-SEQ reads were first trimmed to the first 80 bp then aligned to the Ensembl human genome (v73) using Bowtie v0.12.9 (13) using the default parameter. The mapping was then sorted by RSEM v1.2.3 (14) which provided a read count for all the main gene and known isoforms annotated in the Ensembl genome using expectation-maximization algorithm.
miRNA analysis
Small RNA reads were first trimmed from the 5′ adapter sequence searching for a perfect match with at least the first 8 bp of the adapter. All the reads without the adapter sequence (or with a mutated adapter sequences) were removed from the libraries. Then, a second trimming round removed the reads shorter than 16 bp and longer than 35 bp. All remaining reads were used in a miRDeep2 analysis (15), which consisted of aligning the reads to the human genome to predict new putative miRNA precursors. A total of 1250 putative pre-miRNAs was added to the list of 1600 known human pre-miRs from miRBase (release19). All trimmed reads were then mapped using Patman (16) against this complete human precursor catalogue allowing no mismatches or gap (to avoid mixing the very close miRNA species coming from the same family). Mapping outputs were finally parsed to obtain the complete read count for each miRNA species (3′, 5′ as well as all possible isomirs).
circRNA prediction
Circular RNA (circRNA) sequences were predicted using the protocol used by Memczak et al.(12). Briefly, the RNA-seq reads mapping to the human genome were first discarded. Anchors of 20 bp were then extracted from both ends of the remaining reads and realigned individually to find exon splice sites. The output BED file was generated following the proposed parameters from the initial authors, and parsed using the same criteria with the exception of a minimum quality score of 35 needed for both anchors (instead of only one in the original protocol).
Selection of differentially expressed entities
Following the above primary analysis, each biological entity (RNA, miRNA and circRNA) was associated with a read count number. The raw counts were first normalized using TMM (trimmed mean of M-values) normalization provided by edgeR bioconductor package for R (17). The same criteria were then applied to estimate differentially expressed (DE) entities between the treated (BaP) and control (DMSO) samples for each exposure duration: (i) a minimum count after normalization of 10 reads, (ii) absolute fold-change ≥1.5, (iii) a false discovery rate (FDR) ≤0.05. Since we worked with two biological replicates per condition, we also removed the biological entities for which the two biological replicates at a given time point were discordant (e.g. opposite fold change direction) or for which a single sample was representing >75% of all the read counts at a given time point.
miRNA target prediction
Putative interactions between the sequenced miRNAs and the mRNA or the predicted circRNA were evaluated using miRanda, investigating only perfect seed matching without gap of Wooble pairing (‘strict’ parameter). To this end, 3′ UTR of all mRNAs expressed in our samples were downloaded using Ensembl Biomart and the circRNA BED output file were converted into FASTA format DNA sequences. A hit between any expressed miRNA (including the new predicted miRNA) and a target mRNA or circRNA was considered for a miRanda score of 140 or higher, corresponding to at least a perfect seed match.
RESULTS
Experimental design
The current default model for assessing chemical carcinogenesis is the 2-year rodent bioassay. This however is notorious for strongly over-estimating human cancer risks (18). This calls for better predictive models, and this is why human cellular models are nowadays widely considered. Since the liver represents one of the major target organs in the rodent cancer bioassay, a human liver cell model thus is a preferred option. In toxicogenomics, HepG2 has previously been shown to provide a model for classifying carcinogenic chemicals with higher accuracy that the rodent cancer bioassay (19,20). While this has been the outcome of statistical approaches, it is now tempting to also subject the HepG2 cell system to mechanistic investigations, using high throughput sequencing. Where is has been repeatedly stressed that dividing cells are more prone to carcinogenic impacts (21), it is of interest to note that HepG2 being a hepatoma cell line, are rapidly cycling. The selection of time points has been based on our previous time series analysis of BaP-exposed HepG2 cells, using microarray technology (22). At these particular time points, we noted interesting up- and down-regulations on mechanistically relevant genes.
RNA expression levels of BaP-exposed cells
A total of 24 samples, e.g. 12 HepG2 cultures exposed to BaP during 6, 12, 18, 24, 36 and 48 h (in duplicates) and 12 corresponding controls using DMSO as vehicle control, were sequenced after a ribosomal RNA depletion treatment. All samples considered, 1.89 billion reads were produced, in pair-end, with an average of 79.1 million reads per sample. Because of the sequencing of non-coding repetitive elements, 35.5% of the reads (on average, corresponding to 27.9 million reads per sample) could be mapped to the Ensembl human genome (v73, with masqued repetitive element), to be compared with the 60% of poly-A enriched RNA-SEQ which appeared mappable in our previous study (6).
Each transcript was then quantified using Bowtie and RSEM. RNA (both mRNAs and ncRNAs) expression profiles significantly modified by BaP, were retrieved for each time point (cf ‘Materials and Methods’ section). The number of differentially expressed (DE) genes for each time condition is summarized in Table 1: 1143 differentially expressed RNAs have been found across the six time points. A gene-ontology (GO)-based enrichment analysis of these genes returned the biological process ‘cellular response to xenobiotic stimulus’ (GO:0071466) to be the most significantly enriched term (P = 3.64e−7), thus confirming that HepG2 cells are indeed capable of effectively responding to BaP exposure.
Table 1. Differential expression induced by BaP.
| 6 h | 12 h | 18 h | 24 h | 36 h | 48 h | All | |
|---|---|---|---|---|---|---|---|
| RNA | 266 | 467 | 337 | 39 | 76 | 185 | 1143 |
| miRNA | 2 | 1 | 6 | 6 | 2 | 6 | 16 |
| circRNA | 26 | 39 | 18 | 18 | 48 | 46 | 163 |
Displays the number of differentially expressed sequence products (P < 0.005, absolute FC > 1.5, reads count > 10 and FDR < 0.5) after BaP exposure per time point.
Only a single gene is over-expressed during the entire time course: CYP1A1 (Figure 1), a cytochrome P450 involved in BaP metabolism. Other important genes are significantly over-expressed in BaP-exposed cell at minimally 3 time points, including the detoxifying enzyme ALDH3A1 (aldehyde dehydrogenase 3), AKR1B10, an aldo–keto reductase playing a role in carcinogenicity, or OSGIN1 (oxidative stress-induced growth inhibitor 1), an oxidative stress response gene induced by DNA damage, consistent with the observation that BaP induces reactive oxygen species (ROS) formation (23). The majority of differentially expressed genes is up-regulated and only a minority of genes is inhibited by BaP exposure (54 of the 266 DE genes at 6 h), among which are two histones genes (HIST1H3J and HIST1H2BM), which may point toward epigenomic changes induced by BaP exposure.
Figure 1.
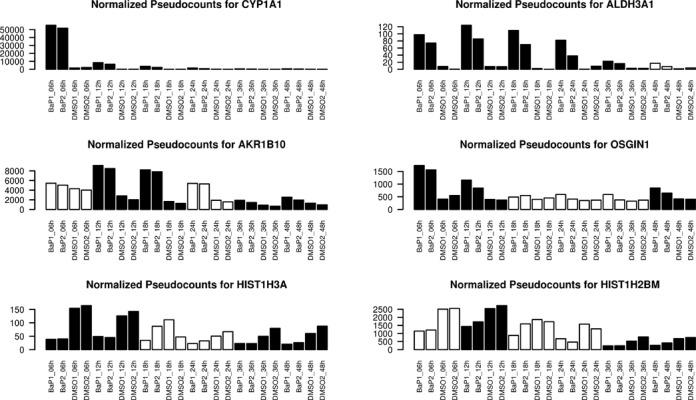
Differential expression of mRNAs induced by BaP over time. Displays the normalized pseudocounts reads (y-axis) of six genes consistently affected by BaP exposure across time: four up-regulated genes (CYP1A1, ALDH3A1, AKR1B10, OSGIN1) and two down-regulated genes (HIST1H3A and HIST1H2BM). Black bar indicates significant expression differences between treated (BaP) and control (DMSO) for this particular time point.
Being a potent genotoxicant, BaP triggers a rapid DNA damage repair response as indicated by the differential expression of several DNA repair genes. Notably, MDC1 (mediator of DNA damage checkpoint protein 1) expression levels appeared highly increased already at 6 h after BaP treatment, together with other genes known to be involved in the DNA damage response pathway (WikiPathways) such as MDM2, CDKN1A, CCND2 and SFN, all upregulated after BaP exposure. By contrast, four DNA repair genes were found to be significantly inhibited by BaP, each involved in a different repair mechanism: MGMT (direct reversal of damage), RAD51B (homologous recombination), MSH5 (mismatch excision repair) and XRCC4 (non-homologous end-joining). Thus, while being a genotoxicant, BaP seems to also impair several components of the main repair mechanisms, which suggests that the putative DNA damage is not repaired as efficiently as possible.
Interestingly, after BaP exposure some genes did not appear differentially expressed at their global expression level, but showed a clearly different isoform distribution. We were able to find 40 genes presenting a difference in their main isoform expression (Supplementary data 2). The most striking case is found with RASSF2 gene, a tumor suppressor reported in human colorectal cancer (24), for which BaP-exposed cells mainly expressed the transcript ENST00000379400 (70%, 25% in controls) whereas the transcript ENST00000379376 was more abundant in controls (66%, 10% in BaP). These alternate transcripts of RASSF2 share the same protein, but differ in their 3′UTR, ENST00000379376 3′UTR being 143 bp longer and thus may be differentially regulated by miRNAs or by other post-transcriptional regulation factors. A miRNA interaction target analysis shows than miR-766_5p, differentially expressed in BaP exposed cells, presents a perfect seed with this longer 3′UTR, and thus can interact specifically with this isoform.
Expression profile of mitochondrial genes
Next to being a carcinogen, BaP has been shown to cause mitochondrial dysfunction, by disrupting ATP generation and the activities of Na+/K+-ATPase and Ca2+/Mg2+-ATPase, leading to cell death by both apoptosis and necrosis (25). Among the 37 different genes known to be expressed in mitochondria, 15 could be detected in our libraries, with three genes in the top 100 expression level changes (MT-CO3, MT-RNR1 and MT-RNR2). We noticed that mitochondrial ribosomal RNAs are still highly expressed despite the ribo-depletion treatment, but none of these mitochondrial genes are differentially expressed by BaP exposure. However, by pulling all the reads expressed from the mitochondrial genes together for each sample and converting to the mean relative expression, we observed a clear pattern of mitochondrial gene inhibition induced across time (Figure 2). It appears that the cells start by increasing their metabolism after the initial BaP exposure which is followed by a global reduction of mitochondrial activity after 18 h, demonstrating an impaired gross rate, possibly due to overt toxicity.
Figure 2.
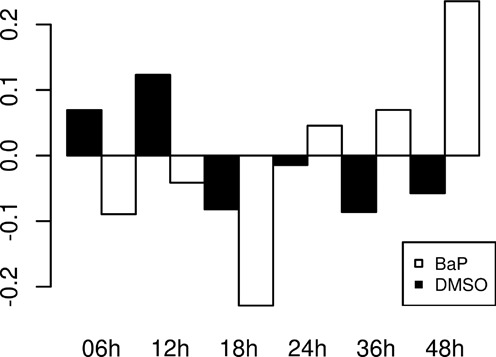
Mitochonchial genes relative expression. Displays the global expression level of all reads from mitochondria, presented as relative expression (y-axis) versus the average count number across all samples at each time point (x-axis). BaP-exposed samples are in black, control samples (DMSO) are in white.
Effect of BaP on miRNA expression on HepG2 cells
A total of 200 million reads (average 8.3 million per sample) was sequenced from small RNA libraries. A miRDeep 2.0 (26) prediction analysis generated 1860 putative new miRNA precursors, of which 153 were found expressed in all 24 samples. After a trimming step to keep the reads compatible with being miRNAs, i.e. presence of the 3′ adapter and size between 16 and 35 bp (keeping 70.5% of total reads), we mapped the reads to the complete catalogue of known human miRNA precursors from miRBase together with the miRNA precursors predicted by miRDeep. An average of 60.5% of the trimmed reads per sample (3.5 million reads) could be aligned to miRNA precursor sequences.
The three most abundantly expressed miRNAs in all 24 samples are mir-192_5p, mir-21_5p and mir-191_5p, independently of BaP treatment. Although none of these miRNAs are strictly liver-specific, mir-192 has been proposed has a biomarker of drug-induced liver damage (27). This liver-specific miR-122 family (mir-122 and mir-3591) is expressed in all 24 HepG2 samples at a stable level across time or BaP treatment. A total of 16 mature miRNAs was significantly affected by BaP exposure over time (Table 1), all identified by miRBase to be known miRNAs (Supplementary Data 2). Only one miRNA is consistently over-expressed over the entire time course, namely miR-181a-1_3p (Figure 3A). Five other DE mature miRNAs, identified at multiple time points, appear members of the miR-181 family (miR-181a-1_5p, miR-181a-2_5p, miR-181b-1_5p and 3p and miR-181b-1). Interestingly, this miR-181 family has already been shown to be involved in hepatocarcinogenic mechanisms (28). Three other DE miRNAs are member of the miR-19 family, another intensely studied family cluster in association with carcinogenesis, notably with respect to its key role in B-cell lymphoma formation (29).
Figure 3.
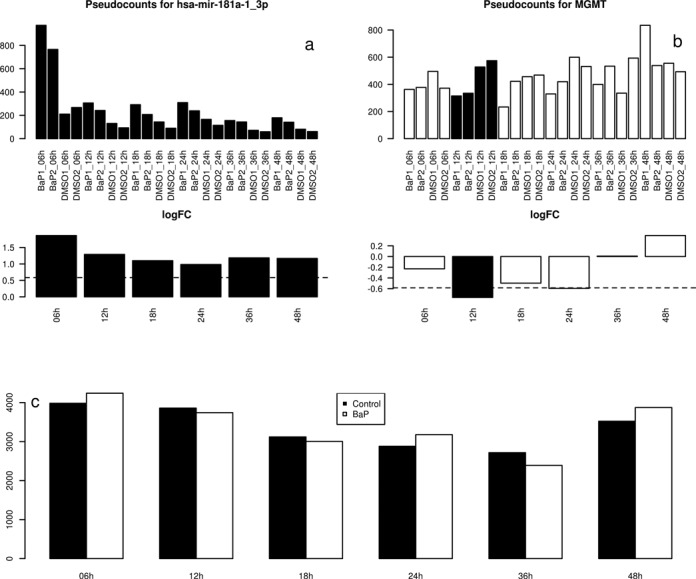
MGMT expression level. Expression level of the different entities involved in our carcinogenic mechanism. (a) Normalized pseudocount of miR-181a-1_3p read (y-axis) for each time point (x-axis). Black barpot indicates significant expression differences between BaP and DMSO. The bottom barplot represent the fold change (in log2) at each time point. (b) Normalized pseudocount (top) and fold change (bottom) of MGMT. (c) Sum of normalized reads counts (y axis) of circRNAs with at least one perfect seed with miR-181a-1_3p across the six time points.
We then checked whether BaP exposure affects the isomiRs distribution of miRNA. Contrary to our observation on mRNA isoforms, we did not observe a single miRNA which presented a different main isomiR upon comparing BaP treatment and control. However, we were able to identify two miRNAs with an isomiR profile significantly differentially distributed between BaP treatment and control. For instance, while the main isomiR form of miR-181a-1_5p (5′ aacauucaacgcugucggugagu 3′) was the same at each condition, the distribution of the second and third isomiRs, respectively 1 bp shorter or 1 bp longer in the 3′ extremity than the canonical form, was significantly different (q-value = 0.006). However, all different isomiRs still possessed the same 5′ sequence, and thus shared the same seed. This variation will then certainly have a negligible effect on mRNA inhibition, but still may be used as a biomarker of toxicity.
circRNA prediction
Since the original circRNA prediction study mentioned that circRNA seem to be very diverse across tissues and cell types, we computed de novo the putative circRNA expressed in our 24 samples based on the methodology proposed by Memczak et al.(12), which enabled us to predict circRNAs from each single read of the paired-end reads.
The first read yielded a total of 9745 different putative circRNAs entitites, against 8984 predicted from the second read of the pair. However, half (51,2% in read one, 40.3% in read two) of these predicted circRNAs are uniquely found in only one of the 24 samples, showing the very small consistency of circRNA prediction findings. The combination of both predictions shows an overlap of 5772 putative circRNAs species, with only 266 (4.6%) found in only one sample. We used this overlapping circRNA list for obtaining a better consistency (Supplementary Data 3). The average size of the predicted circRNA was 11.3 kb (SD = 15.2 kb). Only 17 circRNAs (0.3%) were predicted from all 24 samples. Interestingly, of the 1954 circRNAs predicted from human HEK293 cells in the initial study (12), 634 (40.8%) were identified in our HepG2 model.
Since for defining circRNAs, the prediction algorithm only takes into account the reads mapping the exon junction, we decided to remap the reads on the entire circRNA sequences to assess their global expression level and to determine their response to BaP exposure. Regardless of BaP exposure, some putative circRNAs appeared highly expressed across all time points. Interestingly, not a single read was mapped on 702 predicted complete circRNA sequences, thus indicating that using only the reads mapping a putative junction between distant genome localisations, is not sufficient to reliably define an expressed circular molecule.
Several circRNAs appear differentially expressed at various time points (Table 1, Supplementary Data 4) but none of them displayed a consistent pattern across the entire time course. Notably, some circRNA appeared upregulated at a particular time point, then downregulated later, while others were expressed randomly across time points (Supplementary Figure S2). Taken together, the individual circRNA expression seems to be highly random.
Time series analysis
We aimed to perform a global temporal analysis of all sequenced molecules in order to group biological entites sharing a common expression pattern across time. By applying STEM (Short Time-series Expression Miner), an algorithm designed to study short time series of eight times point or less (30), we investigated whether mRNAs, miRNAs and circRNAs shared the same temporal expression profile (Supplementary Data 5). CYP1A1 and mir-181a-1_3p, both differently expressed across the entire time course, appeared clustered in two different models, both not significantly, with respectivly 16 and 5 genes.
The most significant cluster contained 512 genes and displayed a stable expression across time, except for a peak at 24 h. A GO analysis showed that these genes are mainly involved in transmembrane transporter activity (GO:0022857, 24 genes, q-value: 0.0058) and substrate-specific transporter activity (GO:0022892, 24 genes, q-value: 0.0064). Apparently, 24 h after initiating exposure, BaP-treated cells are actively involved in transporting activity, possibly for the purpose of excreting BaP metabolites. No relevant clustering pattern over time was observed for miRNAs, which were found scattered across the different cluster.
Since the predicted circRNA were inconsistently expressed across time, many circRNAs were rejected from the time-series analysis (only 71 circRNAs left). A significant cluster of 341 entities, showing two peaks of expression at 6 and 24 h, contains 16 circRNAs. However, an enrichment analysis based on GO pathways, did not reveal any relevant biology activity shared by these genes.
miRNAs target prediction for mRNA and circRNAs
Next, we aimed to compute all possible interactions of each DE miRNA with all expressed mRNAs and circRNAs. To achieve this, we counted the total number of ‘7mer’ seed pairing (nucleotides 2 to 8 without mismatches or Wooble pairing) for each individual DE miRNA against all mRNA 3′UTRs and entire circRNA sequences.
The 18 DE miRNAs led to only 11 unique seeds, several closely related miRNA sharing the same ‘7mer’ sequences. The number of putative interactions per miRNA varied greatly, ranging from 409 to 5537 for the mRNA panel, and from 17 to 259 with the circRNAs (Supplementary Figure S1). A total of 6638 mRNA and 183 circRNA appeared targeted by at least one DE miRNA. Surprisingly, miR-181a-1_3p, the only miRNA consistently DE over the entire time course during BaP treatment, is the miRNA with the smallest number of possible interactions with mRNA and with circRNA.
Case study: mir-181b, DNA repair genes and circRNA
Since miR-181a-1_3p appeared the only miRNA consistently upregulated by BaP across the entire time course, we decided to focus our data integration analysis on this miRNA. Of the 18742 genes expressed (i.e. with >10 reads) in our libraries, 328 possessed at least one perfect seed on their 3′UTR with miR-181a-1_3p. An enriched pathway-based analysis of these genes pointed out the p53 pathway as one of the mainly affected pathways (P = 0.00275). Thus, the genes ATR (phosphorylate tumor suppressor), HUWE1 (ubiquitinate p53), MAPK8 (kinase required for apoptosis), SETD8 (unknown), CSNK1G1 (casein kinase involved in cell growth) and USP7 (hydrolase of p53) all demonstrated a perfect seed in their 3′UTR with miR-181a-1_3p, indicating that their expression can be inhibited by this miRNA.
Among the 328 genes with a perfect seed with miR-181a-1_3p, 14 genes were differently expressed after BaP exposure (Table 2). Although some of these genes are not really informative, we noticed the presence of MGMT (O6-methylguanine DNA methyltransferase), an enzyme responsible for repairing the mutagenic O6-methylguanine adduct (leading to DNA lesion) to the normal guanine nucleotide, thus preventing potential mutations during DNA replication or chromosomal aberrations. MGMT is mainly expressed in liver tissue (Gene Atlas) and MGMT depletion has been shown to increase carcinogenic risk in mice exposed to alkylating agents (31).
Table 2. Differentially expressed mRNA putative target of miR-181a-1_3p.
| Gene name | Description | Role | Nb target |
|---|---|---|---|
| ADAMTS13 | ADAM metallopeptidase with thrombospondin type 1 motif | A large protein involved in blood clotting | 3 |
| CA12 | Carbonic anhydrase XII | Catalyze the reversible hydration of carbon dioxide | 1 |
| CPT1A | Carnitine palmitoyltransferase 1A | A mitochondrial enzyme responsible for the formation of acyl carnitines | 1 |
| FAM186B | Family with sequence similarity 186, member B | Unknown | 1 |
| HUWE1 | E3 ubiquitin-protein ligase HUWE1; HECT, UBA and WWE domain containing 1 | Ubiquitinates p53 and Mcl1 | 1 |
| LDLRAD2 | Low-density lipoprotein receptor class A domain containing 2 | Unknown | 1 |
| MEF2BNB-MEF2B | MEF2BNB-MEF2B readthrough | Unknown | 1 |
| MGMT | O6-methylguanine-DNA methyltransferase | Repairs the naturally occurring mutagenic DNA | 1 |
| MID1 | Midline 1 | Formation of multiprotein structures acting as anchor points to microtubules | 2 |
| PRELP | Proline/arginine-rich end leucine-rich repeat protein | Anchoring basement membranes to the underlying connective tissue | 1 |
| RGPD1 | RANBP2-like and GRIP domain containing 1 | Associated with the nuclear membrane and is thought to control a variety of cellular functions | 1 |
| RGPD5 | RANBP2-like and GRIP domain containing 5 | Associated with the nuclear membrane and is thought to control a variety of cellular functions | 1 |
| SCFD2 | sec1 family domain containing 2 | May be involved in protein transport | 1 |
| SHANK2 | SH3 and multiple ankyrin repeat domains 2 | Function as molecular scaffolds in the postsynaptic density | 1 |
List of the 14 mRNAs with perfect seed in their 3′UTR with miR-181a-1_3p, displayed with the Ensembl ID, gene name, a brief description and role of the gene, and the number of predicted target in 3′UTR of the gene.
MGMT mRNA expression showed an inhibition at 24 h of BaP exposure (Figure 3B). This inhibition may be partially due to miR-181a-1_3p targeted decay or cleavage. Subsequently, the level of MGMT mRNA equilibrated at 36 h toward control levels. We then assessed whether some circRNAs interact with miR-181a-1_3p. A total of 16 different predicted circRNAs may form a perfect seed complementarity with miR-181a-1_3p, and thus is capable of interfering with its binding to mRNA targets. Since all putative circRNA molecules potentially attract miRNAs via sequence complementary, we considered 16 circRNA capable of binding miR-181a-1_3p, at each time point. While no particular difference appeared between BaP-treated and control samples, we noticed that the putative circRNA capable of capturing miR-181a-1_3p globally decreased over the first 24 h of Bap exposure and increased again later (Figure 3C). This observation was consistent with the expression profile of MGMT, for which the expression increased between 24 and 48 h of exposure.
Taken together, we are now able to formulate the following hypothesis: initially, over-expression of miR-181a-1_3p induced by BaP exposure inhibits the MGMT translation and significantly decreases its mRNA level. After 24 h, the combined reduction of expression of miR-181a-1 together with the increasing number of circRNAs specifically capable of capturing this miRNA, leads to the upregulation of MGMT (Figure 4).
Figure 4.
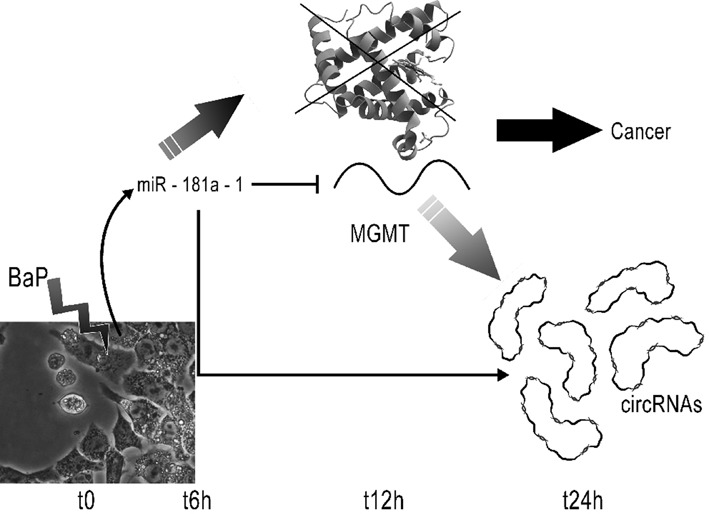
Hypothesis of a carcinogenic mechanism. BaP exposure triggers rapidly the upregulation of miR-181a-1_3p. This miRNA interact with MGMT, partially reducing its mRNA expression level at 12 h. The number of circRNAs able to capture miR-181a-1_3p increases after 24 h, contributing to the reduction of MGMT inhibition.
In the absence of MGMT, the accumulated O6-MeG mutations induced cell death exclusively by apoptosis via ATM/ATR and TP53 pathways (32). However, since the TP53 pathway is downregulated by miR-181a-1, the apoptosis mechanism is certainly less effective. In a context of environmental contamination by BaP (smoking, wood burning…), the increased expression of this particular miRNA (together with other miR-181 family member) may thus lead to the accumulation of unrepaired mutations, causing gene damage over time, ultimately leading to cancer.
DISCUSSION
BaP is initially transformed into benzo[a]pyrene-7,8-diol by epoxide hydrolase enzymes (EPHX1–4) of whose two forms (EPHX 1 and 2) are expressed in HepG2 cells, which is compatible with human normal liver sequencing data (data not shown). Benzo[a]pyrene-7,8-diol is then processed by the cytochrome P450s CYP1A1, CYP1A2 and CYP1B1 (33,34), all expressed in HepG2 (with CYP1A1 and CYP1B1 over-expressed after BaP exposure). Consequently, in HepG2, BaP has shown to form DNA adducts which is assumed to represent the molecular initiating event in chemical carcinogenesis (35).
BaP exposure up-regulate two members of the miR-181 family: miR-181a and miR-181b. While being expressed, the other family members, miR-181c and miR-181d, are not significantly modified by BaP treatment. The miR-181 family has been shown to be involved in cellular differentiation, notably by inhibiting CDX2, GATA6 and NLK (28), 3 known regulators of hepatic cell differentiation. Hepatocellular carcinoma and fetal livers cells present a high level of expression of the complete miR-181 family (36,37). As reported for liver cancer cell lines, HepG2 highly express all miR-181 family members. In this context, BaP exposure increases even more the pressure on genes responsible for hepatic differentiation. However, opposite effects have also been shown, notably some miR-181 members being highly expressed in differentiated cells, such as in B-lymphocytes (38) and megakaryocytes (39). MiR-181a-1-3p in particular, which appears consistently over-expressed over the entire time course in our study, has been reported to inhibit NANOG, a transcription factor maintaining pluripotency of embryonic stem cells, via a non-conventional seedless interaction compensated by a strong 3′ complementarity (40).
Our analysis report 40 genes showing a shift in their main isoform expression in BaP-exposed cells (Supplementary Data 2). The complete mapping of all 24 samples on isomiRs produced a very high number of different isoforms (10 0649 with at least 10 reads in one sample), making statistical test irrelevant after correction for multiple testing. However, the individual expression profile of isoforms of key reported genes in this study indicates a signature mirroring the reported global expression level. For instance, CYP1A1 displays eight differentially expressed isoforms which are all over-expressed across time by BaP exposure. Also, MGMT, another important gene reported in our analysis, presents one expressed isoform across all 24 samples.
Our study reports the first prediction of circRNAs expression patterns in the context of xenobiotic exposure. CircRNAs have already been shown to be cell- or developmental stage-specific (12). Our prediction reveals that, within a single cell type, circRNAs expression patterns appear also globally variable across time, dose and even biological replicates. The total amount of expressed circRNAs seems also variable, since circRNAs represents around 3.2% of our total ribo-depleted RNA libraries, as compared to >14% reported in fibroblasts (11). The prediction algorithm, based on reads mapping two distant genome locations and thus expected to represent head-to-tail splicing event, predicts 702 (12.2%) putative circRNAs for which not a single read could be remapped on the predicted circRNAs complete sequence. This is consistent with the 4 out of 23 (17.3%) circRNAs that could not be validated by qPCR by Memczak et al.(12). These false positives may be due to the ligation of two distant or degraded RNA during the library preparation. However, the fact that some circRNAs are consistently predicted across all 24 samples, and that 40.2% of the predicted circRNAs in liver HepG2 cells are also found in HEK293, a human embryonic kidney cell line, gives credit to the biological consistency of this class of regulatory molecules. Their patterns of expression across time and compound exposure are really chaotic and seem unpredictable at this stage. A recent study (41) even speculates that the circRNAs form a byproduct of the normal exon splicing of mRNA with no direct biological relevance. However, the accumulation of different circRNAs present at a given time point, may still trap miRNAs. We therefore decided to study the circRNA effect for each miRNA individually, by pulling all the reads from circRNAs having at least one target for a given miRNA. This allows, for each miRNA, to study the global competition pressure between the possible mRNA targets and the circRNAs.
Our data furthermore indicates a global inhibition across time of all mitochondrial genes after BaP treatment, confirming observations by other groups on the detrimental effect of BaP (and others PAH) on mitochondrial function. While the main effect of BaP in our case is observed with respect to one member of the p450 family gene, namely CYP1A1, which is thought to be involved in the detoxification reaction to remove BaP from the organism, other p450 are also modified by this compound. CYP1B1 is also highly upregulated by BaP after 6 h exposure (∼30-fold change). This gene has recently been shown to be responsible of BaP mitochondrial dysfunction by mediating ROS formation and damaging mitochondrial DNA thus leading to cell death (42). Indeed, CYP1B1 knock-out mice do not show mitochondrial dysfunction after BaP exposure. However, contrary to CYP1A1 which is overexpressed over the complete exposure period (48 h), CYP1B1 is only upregulated at 6 h and appears barely detectable at 12 h. We hypothesize that while the messenger quickly retrieves its normal low level, proteins are still expressed and trans-located to the mitochondria thus maintaining oxidative stress associated with BaP metabolism.
Integration of these different data types leads us to the hypothesis that BaP exposure initiates carcinogenesis by over-expressing mir-181a-1_3p, which then inhibits the MGMT DNA repair enzyme (Figure 4). Since MGMT inhibition quickly returns to normal after 24 h in our cell system, as a consequence of mir-181a01_3p expression decreasing and levels of putative circRNAs with a valid target for this miRNA increasing, we postulate that, given the continuous exposure to BaP in the environment in the co-presence of alkylating agents such as nitrosamines which for instance are endogenously formed upon dietary nitrate or nitrite intake (43), this mechanism would slowly increase the DNA mutation rate, ultimately leading to cancer. Obviously, this hypothesis does not rule out the other reported toxic mechanism involving BaP, such as the reactive oxygen species (ROS) formation or, via LINEs transposition activation (44).
Our study presents an innovative data integration analysis, in which mRNA, miRNA and circRNAs are studied, together with their alternative forms. We provided also a catalog of predicted circRNAs in liver cell lines, which may be of relevance for other research groups. With multiplication of biological detection platforms ongoing, the next step would be to add the complete proteomic and metabolomic profile, which will ultimately enable the full disclosure of the genotoxic and carcinogenic mechanisms induced by carcinogenic drugs and chemicals in human systems.
SUPPLEMENTARY DATA
Supplementary Data are available at NAR Online.
FUNDING
European Union seventh framework project diXa [283775]; Netherlands Genomics Initiative (NGI) from the Netherlands Organization for Scientific research [050-060-510]. Funding for open access charge: European Union seventh framework project diXa [283775]; NGI from the Netherlands Organization for Scientific research [050-060-510].
Conflict of interest statement. None declared.
REFERENCES
- 1.Ward J.M. Value of rodent carcinogenesis bioassays. Toxicol. Appl. Pharmacol. 2008;226:212. doi: 10.1016/j.taap.2007.10.007. [DOI] [PubMed] [Google Scholar]
- 2.Collins F.S., Gray G.M., Bucher J.R. Toxicology. Transforming environmental health protection. Science. 2008;319:906–907. doi: 10.1126/science.1154619. [DOI] [PMC free article] [PubMed] [Google Scholar]
- 3.van Delft J.H., van Agen E., van Breda S.G., Herwijnen M.H., Staal Y.C., Kleinjans J.C. Discrimination of genotoxic from non-genotoxic carcinogens by gene expression profiling. Carcinogenesis. 2004;25:1265–1276. doi: 10.1093/carcin/bgh108. [DOI] [PubMed] [Google Scholar]
- 4.Caiment F., Tsamou M., Jennen D., Kleinjans J. Assessing compound carcinogenicity in vitro using connectivity mapping. Carcinogenesis. 2014;35:201–207. doi: 10.1093/carcin/bgt278. [DOI] [PubMed] [Google Scholar]
- 5.Wang C., Gong B., Bushel P.R., Thierry-Mieg J., Thierry-Mieg D., Xu J., Fang H., Hong H., Shen J., Su Z., et al. The concordance between RNA-seq and microarray data depends on chemical treatment and transcript abundance. Nat. Biotechnol. 2014;32:926–932. doi: 10.1038/nbt.3001. [DOI] [PMC free article] [PubMed] [Google Scholar]
- 6.van Delft J., Gaj S., Lienhard M., Albrecht M.W., Kirpiy A., Brauers K., Claessen S., Lizarraga D., Lehrach H., Herwig R., et al. RNA-Seq provides new insights in the transcriptome responses induced by the carcinogen benzo[a]pyrene. Toxicol. Sci. 2012;130:427–439. doi: 10.1093/toxsci/kfs250. [DOI] [PubMed] [Google Scholar]
- 7.Cheng S.C., Hilton B.D., Roman J.M., Dipple A. DNA adducts from carcinogenic and noncarcinogenic enantiomers of benzo[a]pyrene dihydrodiol epoxide. Chem. Res. Toxicol. 1989;2:334–340. doi: 10.1021/tx00011a011. [DOI] [PubMed] [Google Scholar]
- 8.Portal-Nunez S., Shankavaram U.T., Rao M., Datrice N., Atay S., Aparicio M., Camphausen K.A., Fernandez-Salguero P.M., Chang H., Lin P., et al. Aryl hydrocarbon receptor-induced adrenomedullin mediates cigarette smoke carcinogenicity in humans and mice. Cancer Res. 2012;72:5790–5800. doi: 10.1158/0008-5472.CAN-12-0818. [DOI] [PMC free article] [PubMed] [Google Scholar]
- 9.Taylor E.L., Gant T.W. Emerging fundamental roles for non-coding RNA species in toxicology. Toxicology. 2008;246:34–39. doi: 10.1016/j.tox.2007.12.030. [DOI] [PubMed] [Google Scholar]
- 10.Hansen T.B., Jensen T.I., Clausen B.H., Bramsen J.B., Finsen B., Damgaard C.K., Kjems J. Natural RNA circles function as efficient microRNA sponges. Nature. 2013;495:384–388. doi: 10.1038/nature11993. [DOI] [PubMed] [Google Scholar]
- 11.Jeck W.R., Sorrentino J.A., Wang K., Slevin M.K., Burd C.E., Liu J., Marzluff W.F., Sharpless N.E. Circular RNAs are abundant, conserved, and associated with ALU repeats. RNA. 2013;19:141–157. doi: 10.1261/rna.035667.112. [DOI] [PMC free article] [PubMed] [Google Scholar]
- 12.Memczak S., Jens M., Elefsinioti A., Torti F., Krueger J., Rybak A., Maier L., Mackowiak S.D., Gregersen L.H., Munschauer M., et al. Circular RNAs are a large class of animal RNAs with regulatory potency. Nature. 2013;495:333–338. doi: 10.1038/nature11928. [DOI] [PubMed] [Google Scholar]
- 13.Turro E., Su S.Y., Goncalves A., Coin L.J., Richardson S., Lewin A. Haplotype and isoform specific expression estimation using multi-mapping RNA-seq reads. Genome Biol. 2011;12:R13. doi: 10.1186/gb-2011-12-2-r13. [DOI] [PMC free article] [PubMed] [Google Scholar]
- 14.Langmead B., Trapnell C., Pop M., Salzberg S.L. Ultrafast and memory-efficient alignment of short DNA sequences to the human genome. Genome Biol. 2009;10:R25. doi: 10.1186/gb-2009-10-3-r25. [DOI] [PMC free article] [PubMed] [Google Scholar]
- 15.Mackowiak S.D. Identification of novel and known miRNAs in deep-sequencing data with miRDeep2. Curr. Protoc. Bioinformatics. 2011 doi: 10.1002/0471250953.bi1210s36. Chapter 12, Unit 12 10. [DOI] [PubMed] [Google Scholar]
- 16.Prufer K., Stenzel U., Dannemann M., Green R.E., Lachmann M., Kelso J. PatMaN: rapid alignment of short sequences to large databases. Bioinformatics. 2008;24:1530–1531. doi: 10.1093/bioinformatics/btn223. [DOI] [PMC free article] [PubMed] [Google Scholar]
- 17.Robinson M.D., Oshlack A. A scaling normalization method for differential expression analysis of RNA-seq data. Genome Biol. 2010;11:R25. doi: 10.1186/gb-2010-11-3-r25. [DOI] [PMC free article] [PubMed] [Google Scholar]
- 18.Paules R.S., Aubrecht J., Corvi R., Garthoff B., Kleinjans J.C. Moving forward in human cancer risk assessment. Environ. Health Perspect. 2011;119:739–743. doi: 10.1289/ehp.1002735. [DOI] [PMC free article] [PubMed] [Google Scholar]
- 19.Doktorova T.Y., Yildirimman R., Vinken M., Vilardell M., Vanhaecke T., Gmuender H., Bort R., Brolen G., Holmgren G., Li R., et al. Transcriptomic responses generated by hepatocarcinogens in a battery of liver-based in vitro models. Carcinogenesis. 2013;34:1393–1402. doi: 10.1093/carcin/bgt054. [DOI] [PubMed] [Google Scholar]
- 20.Magkoufopoulou C., Claessen S.M., Tsamou M., Jennen D.G., Kleinjans J.C., van Delft J.H. A transcriptomics-based in vitro assay for predicting chemical genotoxicity in vivo. Carcinogenesis. 2012;33:1421–1429. doi: 10.1093/carcin/bgs182. [DOI] [PubMed] [Google Scholar]
- 21.Tomasetti C., Vogelstein B. Cancer etiology. Variation in cancer risk among tissues can be explained by the number of stem cell divisions. Science. 2015;347:78–81. doi: 10.1126/science.1260825. [DOI] [PMC free article] [PubMed] [Google Scholar]
- 22.van Delft J.H., Mathijs K., Staal Y.C., van Herwijnen M.H., Brauers K.J., Boorsma A., Kleinjans J.C. Time series analysis of benzo[A]pyrene-induced transcriptome changes suggests that a network of transcription factors regulates the effects on functional gene sets. Toxicol. Sci. 2010;117:381–392. doi: 10.1093/toxsci/kfq214. [DOI] [PubMed] [Google Scholar]
- 23.Ji K., Xing C., Jiang F., Wang X., Guo H., Nan J., Qian L., Yang P., Lin J., Li M., et al. Benzo[a]pyrene induces oxidative stress and endothelial progenitor cell dysfunction via the activation of the NF-kappaB pathway. Int. J. Mol. Med. 2013;31:922–930. doi: 10.3892/ijmm.2013.1288. [DOI] [PubMed] [Google Scholar]
- 24.Akino K., Toyota M., Suzuki H., Mita H., Sasaki Y., Ohe-Toyota M., Issa J.P., Hinoda Y., Imai K., Tokino T. The Ras effector RASSF2 is a novel tumor-suppressor gene in human colorectal cancer. Gastroenterology. 2005;129:156–169. doi: 10.1053/j.gastro.2005.03.051. [DOI] [PubMed] [Google Scholar]
- 25.Jiang Y., Zhou X., Chen X., Yang G., Wang Q., Rao K., Xiong W., Yuan J. Benzo(a)pyrene-induced mitochondrial dysfunction and cell death in p53-null Hep3B cells. Mutat. Res. 2011;726:75–83. doi: 10.1016/j.mrgentox.2011.08.006. [DOI] [PubMed] [Google Scholar]
- 26.Friedlander M.R., Chen W., Adamidi C., Maaskola J., Einspanier R., Knespel S., Rajewsky N. Discovering microRNAs from deep sequencing data using miRDeep. Nat. Biotechnol. 2008;26:407–415. doi: 10.1038/nbt1394. [DOI] [PubMed] [Google Scholar]
- 27.Wang K., Zhang S., Marzolf B., Troisch P., Brightman A., Hu Z., Hood L.E., Galas D.J. Circulating microRNAs, potential biomarkers for drug-induced liver injury. Proc. Natl. Acad. Sci. U.S.A. 2009;106:4402–4407. doi: 10.1073/pnas.0813371106. [DOI] [PMC free article] [PubMed] [Google Scholar]
- 28.Ji J., Yamashita T., Budhu A., Forgues M., Jia H.L., Li C., Deng C., Wauthier E., Reid L.M., Ye Q.H., et al. Identification of microRNA-181 by genome-wide screening as a critical player in EpCAM-positive hepatic cancer stem cells. Hepatology. 2009;50:472–480. doi: 10.1002/hep.22989. [DOI] [PMC free article] [PubMed] [Google Scholar]
- 29.Mu P., Han Y.C., Betel D., Yao E., Squatrito M., Ogrodowski P., de Stanchina E., D'Andrea A., Sander C., Ventura A. Genetic dissection of the miR-17∼92 cluster of microRNAs in Myc-induced B-cell lymphomas. Genes Dev. 2009;23:2806–2811. doi: 10.1101/gad.1872909. [DOI] [PMC free article] [PubMed] [Google Scholar]
- 30.Ernst J., Bar-Joseph Z. STEM: a tool for the analysis of short time series gene expression data. BMC Bioinformatics. 2006;7:191. doi: 10.1186/1471-2105-7-191. [DOI] [PMC free article] [PubMed] [Google Scholar]
- 31.Shiraishi A., Sakumi K., Sekiguchi M. Increased susceptibility to chemotherapeutic alkylating agents of mice deficient in DNA repair methyltransferase. Carcinogenesis. 2000;21:1879–1883. doi: 10.1093/carcin/21.10.1879. [DOI] [PubMed] [Google Scholar]
- 32.Kaina B., Christmann M., Naumann S., Roos W.P. MGMT: key node in the battle against genotoxicity, carcinogenicity and apoptosis induced by alkylating agents. DNA Repair (Amst.) 2007;6:1079–1099. doi: 10.1016/j.dnarep.2007.03.008. [DOI] [PubMed] [Google Scholar]
- 33.Eling T., Curtis J., Battista J., Marnett L.J. Oxidation of (+)-7,8-dihydroxy-7,8-dihydrobenzo[a]pyrene by mouse keratinocytes: evidence for peroxyl radical- and monoxygenase-dependent metabolism. Carcinogenesis. 1986;7:1957–1963. doi: 10.1093/carcin/7.12.1957. [DOI] [PubMed] [Google Scholar]
- 34.Shimada T. Xenobiotic-metabolizing enzymes involved in activation and detoxification of carcinogenic polycyclic aromatic hydrocarbons. Drug Metab. Pharmacokinet. 2006;21:257–276. doi: 10.2133/dmpk.21.257. [DOI] [PubMed] [Google Scholar]
- 35.Staal Y.C., Hebels D.G., van Herwijnen M.H., Gottschalk R.W., van Schooten F.J., van Delft J.H. Binary PAH mixtures cause additive or antagonistic effects on gene expression but synergistic effects on DNA adduct formation. Carcinogenesis. 2007;28:2632–2640. doi: 10.1093/carcin/bgm182. [DOI] [PubMed] [Google Scholar]
- 36.Yamashita T., Forgues M., Wang W., Kim J.W., Ye Q., Jia H., Budhu A., Zanetti K.A., Chen Y., Qin L.X., et al. EpCAM and alpha-fetoprotein expression defines novel prognostic subtypes of hepatocellular carcinoma. Cancer Res. 2008;68:1451–1461. doi: 10.1158/0008-5472.CAN-07-6013. [DOI] [PubMed] [Google Scholar]
- 37.Yamashita T., Ji J., Budhu A., Forgues M., Yang W., Wang H.Y., Jia H., Ye Q., Qin L.X., Wauthier E., et al. EpCAM-positive hepatocellular carcinoma cells are tumor-initiating cells with stem/progenitor cell features. Gastroenterology. 2009;136:1012–1024. doi: 10.1053/j.gastro.2008.12.004. [DOI] [PMC free article] [PubMed] [Google Scholar]
- 38.Chen C.Z., Li L., Lodish H.F., Bartel D.P. MicroRNAs modulate hematopoietic lineage differentiation. Science. 2004;303:83–86. doi: 10.1126/science.1091903. [DOI] [PubMed] [Google Scholar]
- 39.Garzon R., Pichiorri F., Palumbo T., Iuliano R., Cimmino A., Aqeilan R., Volinia S., Bhatt D., Alder H., Marcucci G., et al. MicroRNA fingerprints during human megakaryocytopoiesis. Proc. Natl. Acad. Sci. U.S.A. 2006;103:5078–5083. doi: 10.1073/pnas.0600587103. [DOI] [PMC free article] [PubMed] [Google Scholar]
- 40.Mintz P.J., Saetrom P., Reebye V., Lundbaek M.B., Lao K., Rossi J.J., Gaensler K.M., Kasahara N., Nicholls J.P., Jensen S., et al. MicroRNA-181a* targets nanog in a subpopulation of CD34(+) cells isolated from peripheral blood. Mol. Ther. Nucleic Acids. 2012;1:e34. doi: 10.1038/mtna.2012.29. [DOI] [PMC free article] [PubMed] [Google Scholar]
- 41.Guo J.U., Agarwal V., Guo H., Bartel D.P. Expanded identification and characterization of mammalian circular RNAs. Genome Biol. 2014;15:409. doi: 10.1186/s13059-014-0409-z. [DOI] [PMC free article] [PubMed] [Google Scholar]
- 42.Bansal S., Leu A.N., Gonzalez F.J., Guengerich F.P., Chowdhury A.R., Anandatheerthavarada H.K., Avadhani N.G. Mitochondrial targeting of cytochrome P450 (CYP) 1B1 and its role in polycyclic aromatic hydrocarbon-induced mitochondrial dysfunction. J. Biol. Chem. 2014;289:9936–9951. doi: 10.1074/jbc.M113.525659. [DOI] [PMC free article] [PubMed] [Google Scholar]
- 43.Vermeer I.T., Pachen D.M., Dallinga J.W., Kleinjans J.C., van Maanen J.M. Volatile N-nitrosamine formation after intake of nitrate at the ADI level in combination with an amine-rich diet. Environ. Health Perspect. 1998;106:459–463. doi: 10.1289/ehp.106-1533225. [DOI] [PMC free article] [PubMed] [Google Scholar]
- 44.Stribinskis V., Ramos K.S. Activation of human long interspersed nuclear element 1 retrotransposition by benzo(a)pyrene, an ubiquitous environmental carcinogen. Cancer Res. 2006;66:2616–2620. doi: 10.1158/0008-5472.CAN-05-3478. [DOI] [PubMed] [Google Scholar]
Associated Data
This section collects any data citations, data availability statements, or supplementary materials included in this article.