

Abstract
We aimed to shed new light on the roles of microRNAs (miRNAs) in liver cancer using an integrative in silico bioinformatics analysis. A new protocol for target prediction and functional analysis is presented and applied to the 26 highly differentially deregulated miRNAs in hepatocellular carcinoma. This framework comprises: (1) the overlap of prediction results by four out of five target prediction tools, including TargetScan, PicTar, miRanda, DIANA-microT and miRDB (combining machine-learning, alignment, interaction energy and statistical tests in order to minimize false positives), (2) evidence from previous microarray analysis on the expression of these targets, (3) gene ontology (GO) and pathway enrichment analysis of the miRNA targets and their pathways and (4) linking these results to oncogenesis and cancer hallmarks. This yielded new insights into the roles of miRNAs in cancer hallmarks. Here we presented several key targets and hundreds of new targets that are significantly enriched in many new cancer-related hallmarks. In addition, we also revealed some known and new oncogenic pathways for liver cancer. These included the famous MAPK, TGFβ and cell cycle pathways. New insights were also provided into Wnt signaling, prostate cancer, axon guidance and oocyte meiosis pathways. These signaling and developmental pathways crosstalk to regulate stem cell transformation and implicate a role of miRNAs in hepatic stem cell deregulation and cancer development. By analyzing their complete interactome, we proposed new categorization for some of these miRNAs as either tumor-suppressors or oncomiRs with dual roles. Therefore some of these miRNAs may be addressed as therapeutic targets or used as therapeutic agents. Such dual roles thus expand the view of miRNAs as active maintainers of cellular homeostasis.
Keywords: Hepatocellular carcinoma, miRNA, Target prediction, Integrative bioinformatics, Cancer hallmarks
Introduction
MicroRNAs (miRNAs) are a group of short non-coding RNA post-transcriptional regulatory molecules found in many species, including human, which play a major role in many fundamentally important biological processes [1]. About 3% of human genes encode miRNAs [2,3] and >1500 miRNA genes have been predicted or experimentally shown to play critical roles in normal cellular functions [4], which are often found in fragile sites on chromosomes [5]. The expression of miRNAs is highly specific for the tissue and the developmental stage [6,7]. Several miRNA profile signatures are being advanced as markers of different cancers [8,9]. They are involved in numerous cellular processes, including cell cycle, proliferation, apoptosis and response to stress [10]. Although miRNA regulation mainly utilizes the RNA interference pathway to suppress the expression of protein-encoding genes at posttranscriptional level [11], other modes of action are emerging [12]. Principles of miRNA target binding show that miRNA has key targets that it binds to in almost complete complementarity at the target sites (the 3′UTR of mature mRNAs), leading to their degradation (canonical binding). In addition, for most targets, 5′ dominant complementarity to the seed region or incomplete complementarity to 5′ and 3′ (3′UTR compensatory) occurs, resulting in translational suppression [11,12]. Biogenesis and transcription of miRNAs have been thoroughly reviewed [13] and more insights into miRNA transcription regulation are ongoing. miRNAs can work both as tumor suppressors and as oncogenes [8,9,14,15]. As tumor suppressors, they repress oncogenic targets, but are usually down-regulated in cancer tissues [15]. Others are up-regulated and have a stimulating role for cancer progression [14,16]. These miRNAs can up regulate multiple cancer hallmarks [17] (Figure 1) through induction of different pathways and biological processes (adhesion, proliferation, transcription, translation and inflammation), hence, several cancer hallmarks that contribute to cancer initiation and development are affected [17]. This dual role as oncomiRs and tumor suppressors has stimulated multiple studies on miRNAs and cancers [8,10], prompting full identifications of miRNA target genes [18].
Figure 1.
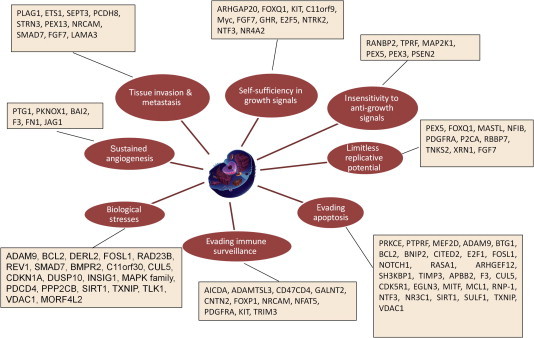
A portrayal of the important miRNA targets linked to the hallmarks of cancer The deregulated miRNA targets in HCC were assigned based on GO annotations using DAVID tool, highlighting the impact of miRNA deregulation on carcinogenesis and metastasis for HCC and other common cancers.
The difficulty of miRNA target prediction and biological validation has been a major obstacle to miRNA research. Experimental identification of miRNA targets is still slow, since some miRNAs are difficult to isolate by cloning due to low expression, low stability, tissue specificity and problems in cloning procedures. Computational algorithms have been developed to identify miRNA target genes, since the 3′UTRs of transcripts were shown to contain miRNA binding sites [19] (Figure 2). To develop such algorithms, principles of miRNA target recognition are often established based on empirical evidence. A lot of features are used by mammalian target prediction programs. These include base pairing pattern, thermodynamic stability of the miRNA–mRNA duplex [20], comparative sequence analysis of target sites in different species, multiple target site evaluation, site accessibility and UTR context [20–22]. The well known miRanda program employs a two-step algorithm: in the first step, an alignment algorithm is used to align the seed region of the miRNA to the 3′UTRs of the target mRNAs and in the second step, cross-species conservation and target accessibility are used for confirming the target, in addition to the several other aforementioned factors [22,23]. More recently, several new algorithms have been developed using machine-learning approaches like support vector machine (SVM), artificial neural network (ANN) such as the MTar tool [24] and Bayesian classifiers [25], trained on known miRNA target datasets. Some recent tools also combined other features like negative examples for improving the specificity and sensitivity. Still, the sensitivity and particularly the specificity of target prediction can be improved [26,27]. The use of combinations of target prediction tools as recently presented by the miRWalk and the mirror servers address some of these issues [28,29]. However, the mirror server analyzes combinations of miRNAs, not individual ones, and miRWalk only finds targets based on its algorithm, and then find the scores of those combinations using other tools. This motivated us to employ an improved approach for target prediction based on consensus of tools and multiple statistical steps.
Figure 2.
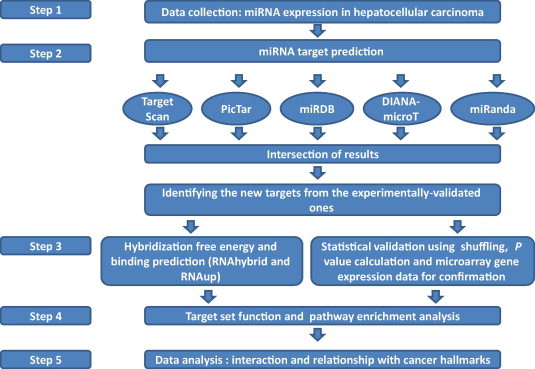
A flow chart illustrating our new improved protocol for the miRNA target prediction steps and functional analysis.
Hepatocellular carcinoma (HCC) is a worldwide health problem with tools for early diagnosis and novel therapies urgently needed. Prognosis and survival rates can be improved significantly in cases of early diagnosis. Hence, the need arises for finding early biomarkers and drug targets as well as novel therapeutic intervention strategies [30]. Several studies indicated that some miRNAs were differentially expressed in liver disease and could be potential biomarkers [31–37]. Interestingly, different miRNAs and molecular mechanisms were unravelled for HCV-induced and HBV-induced HCC [31]. In addition, pathways related to apoptosis, DNA damage, recombination and signal transduction were activated in HBV, whereas those related to antigen presentation, lipid metabolism, cell cycle, proteasome and immune response were activated in HCV [31].
Furthermore, there has been a controversy in the literature about the roles of miRNAs in different cancers. Most reports point to miRNA deregulation being associated with the genesis and development of cancers [14,38,39]. Other studies reported miRNAs as contributing to cellular immune responses to pathogens and cancers [40–46].
The large number of high throughput data generated and the different expression profiling studies in liver cancer has triggered this investigation of a holistic look on the functional roles of miRNAs in liver cancer [31–37,47]. Here, we aim to investigate the functional roles of deregulated miRNAs during initiation and development of HCC by performing a unified meta-analysis. To our knowledge, this integrative in silico bioinformatics analysis has not been previously performed. An improved protocol for miRNA target prediction with multiple steps of statistical validation was introduced to help minimize false positives. The analysis steps included identification of key miRNAs deregulated in HCC from different reports in the literature [16,31–37,47], followed by identification of their target genes using an integrated in silico approach. Identification of the key enriched pathways and gene ontology annotations which affected cancer hallmarks were then conducted. Finally, at Step 4 of the framework, we attempted to classify the important miRNAs as tumor suppressors or oncomiRs.
This analysis unravelled the participation of miRNAs in regulation of key oncogenic and new pathways affecting liver cancer, such as the MAPK, TGFβ, Wnt, cell cycle and oocyte meiosis pathways that drive tumorigenic transformations of somatic and stem cells. Also, different roles for the miRNAs examined have been revealed, many of which have been previously validated by experimental studies, thus providing support to our findings. For example, a new role for HCV-induced, HCC-upregulated miR-96 has been inferred in suppressing expression of some important oncogenes. This analysis also led us to infer that some miRNAs are up-regulated target oncogenes (upregulate tumor suppressor miRNAs) and thus contribute to “fighting” cancer progression, while “mixed-effect miRNAs” were found that have both tumor suppressors and oncogenes as targets, thus playing a dual role. The novel protocol for comprehensive meta-analysis proposed in this study could be extended to other cancers.
Results
The miRNAs with highly differential expression in cancerous versus non-cancerous tissue were identified from published miRNA profiling studies [17,31–39,47] as well as in the PhenomiR database (www.mips.helmholtz-muenchen.de/phenomir/). These miRNAs, their expression levels and their predicted and validated target genes are listed in Table S1. There are 17 miRNAs with high expression in HCC (including miR-18, miR-224, miR-21, miR-182, miR-183, miR-222, miR-96, miR-9, miR-216, miR-155, miR-301, miR-221, miR-324-5p, miR-186, miR-151, miR-106b and miR-374). Additionally, there are 9 miRNAs with low expression in HCC (miR-199a-3p, miR-125a, miR-195, miR-199a-5p, miR-200a, miR-122a, miR-139 miR-214 and miR-34a).
Improved prediction of miRNA targets
To find miRNA target genes with a good compromise between sensitivity and specificity, several steps were included to minimize false positives and false negatives (Figure 2). (A) First we identify the overlap, which is the consensus among four out of five different algorithms; (B) identifying seed-region full complementarity and low hybridization energies and (C) statistical analysis through a process of shuffling the miRNAs was performed for target validation (P < 0.005 for all targets); and (D) finally, expression of miRNAs and their targets was anti-correlated using liver cancer microarray studies [48]. Such expression anti-correlation provides another layer of evidence, suggesting that they are real miRNA targets.
The miRNA targets commonly picked up by 4 out of 5 different programs (TargetScan, PicTar, miRanda, DIANA-microT and miRDB) (Figure 2 and methods for details) were identified with a Perl script (Table S1). These were then compared to the experimentally-validated targets according to miRTarBase and miRecord to identify novel targets. The important miRNA target sets that contribute to the hallmarks of cancer are presented in Figure 1. Further improvements to reduce false positives were achieved by making use of information from a previous gene expression analysis study in HCC [48]. The target genes that showed expression inversely-correlated with that of miRNAs were collected from the liver microarray dataset available as a supplementary file [48] and are indicated by an asterisk (∗) in Table S1. Moreover, RNAhybrid was used to calculate the minimum free energy (MFE) of the duplex miRNA:mRNA [49]. RNAhybrid was optimized to show the hybridization at the 3′UTR of the target genes. The common targets were thus confirmed according to low MFE values. Examples of the miRNA-gene interactions are illustrated in Figure 3. Some of miRNAs can bind at different sites within the 3′UTR of the target gene at different MFEs and different modes of binding as illustrated in the description of Figure 3. The key targets of miRNA would have canonical matching and these miRNAs employ the similar mode of gene silencing as siRNAs through mRNA cleavage and degradation [11,12]. Statistical shuffling to determine the significance of the target prediction approach was then performed, which was significant (P < 0.005) for all the predicted targets. The extremely low P values (<⩽0.05) indicate that these targets are likely to represent true targets. These results highlight the high specificity and richness of our approach in using consensus predictions for targets and combining microarray validation, whenever possible, and free energy hybridization/target accessibility. This detailed analysis enabled us to define different modes of binding for some of the targets and hence their prospective regulation modes (mRNA cleavage versus translational suppression). The recent miRWalk and mirror servers were also used [26,27], providing a platform for target prediction using the miRWalk algorithm to check the prediction results across different tools and mirror to provide a combinatorial view of targets of these set of miRNAs.
Figure 3.
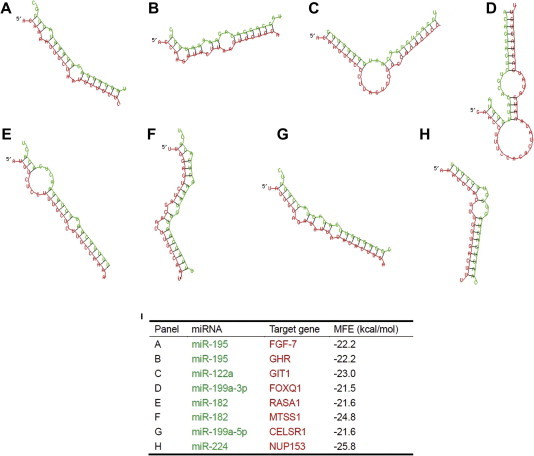
Secondary structure hybridization and MFE of different miRNA-target pairs Shown are the examples for hybridization between miRNAs and their respective target genes for miR-195 and FGF-7 (A), miR-195 and GHR (B), miR-122a and GIT1 (C), miR-199a-3p and FOXQ1 (D), miR-182 and RASA1 (E), miR-182 and MTSS1 (F), miR-199a-5p and CELSR1 (G), miR-224 and NUP153 (H), indicating different modes of target recognition exhibited by miRNAs (canonical for some key targets that would undergo degradation similar to siRNA mode of action, while 5′ dominant and 3′UTR compensatory for targets that would undergo translational suppression). All these examples show the fertility of our approach of unified target prediction, as all targets have MFE < −20 kcal/mol (I). Green represents miRNA and red represents the target sequence. MFE stands for minimum free energy.
Some examples of target genes with high prediction scores using most tools include CPEB4, PLAG1, TP53INP2, PRKCE, BCL2, CUGBP22, FOXQ1, PEX5, PEX13, FGF7, ETS1, E2F5, RASA1 and ARHGEF12 (see Table S1 for the full names and miRNAs targeting these genes). In Table 1 we listed some important predicted transcription factors (TFs) and regulators of growth factors and their regulatory genes that have been targeted by some miRNAs examined in this study due to their important link to cancer and potential as drug targets/tumor suppressors.
Table 1.
Examples of transcription factors/regulators targeted by some miRNAs examined in this study
| Gene name | Function | miRNA | miRNA expression in HCC |
|---|---|---|---|
| Sox 5 | Transcription factor | has-mir-96 | ↑ |
| E2F1 | Transcription factor | hsa-mir-106b | ↑ |
| E2F5 | Transcription factor | hsa-mir-96 | ↑ |
| hsa-mir-106b | ↑ | ||
| hsa-mir-34a | ↓ | ||
| NFYB | Transcription factor | hsa-mir-222 | ↑ |
| ETS1 | Transcription factor | hsa-mir199a-5p | ↓ |
| Proto-oncogene | hsa-miR-155 | ↑ | |
| MEF2D | Transcription factor | hsa-miR-182 | ↑ |
| BACH2 | Transcription regulator | hsa-miR-182 | ↑ |
| FOXQ1 | Transcription factor | hsa-miR-199a-3p | ↓ |
| CITED2 | Positive regulation of TGFβ receptor signaling Negative regulation of cell migration, motion and apoptosis |
hsa-miR-199a-3p | ↓ |
| PTPRF | Positive regulation of cell development | hsa-miR-199a-3p | ↓ |
Enrichment analysis of gene ontology annotations and pathways
Finally, statistical functional enrichment analysis was performed using the DAVID server with Bonferroni correction for multiple testing for a sample of seven key miRNAs (the common core targets). This was followed by a comprehensive function and pathway enrichment analysis using the GeneTrail suite with false discovery rate (FDR) correction for multiple testing [50]. Most of the gene ontology (GO) annotations were associated with regulation of cell cycle, transcription, cell adhesion, cell signaling, apoptosis and proliferation pathways (Figures 4 and 5, S1–S3 and Tables 2–4). Therefore, a strong link exists between these target pathways and the hallmarks of cancer [51,52] and how the miRNAs can affect carcinogenesis of the liver [48,50–53]. Enriched pathways were evaluated using the gene set enrichment analysis of GeneTrail. These enriched pathways that are targeted by these miRNAs and affected genes and significance level are summarized in Table 2. Some important genes and miRNAs appear in more than one pathway, highlighting potential cross talks between these pathways. The predicted targets covered almost all the cancer hallmarks. The DAVID bioinformatics tool was used to calculate the P value of the most significant GO annotations with FDR correction. This was done for the target set of the first seven miRNAs in Table S1 as shown in Figure 4. In Figure 5, the enriched GO annotations and pathways of the target set of the 22 miRNAs using GenTrail are presented as well as in Tables 2–4. The results of GeneTrail analysis showed a significant P-value for some important GO annotations and pathways. It was interesting that these GO annotations and pathways were highly linked to oncogenesis, transcription, growth control and growth factors that affect the cell during oncogenesis and the cell cycle (Figures 4 and 5).
Figure 4.
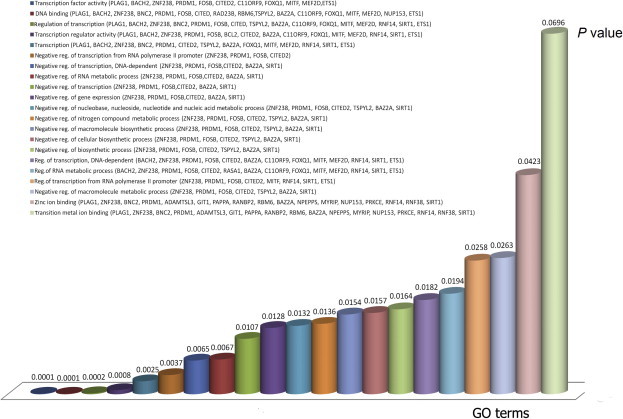
GO functional categories of the targets for miR-122a, miR-199 a-3p, miR-182, miR-195, miR-221, miR-224 and miR-96 that are differentially expressed in HCC The functional categories that are enriched in response to miRNA deregulation in HCC were analyzed using DAVID with P < 0.05. The result shows deregulation in transcriptional-related processes such as activity of transcription factors, gene expression and cellular biosynthetic process.
Figure 5.
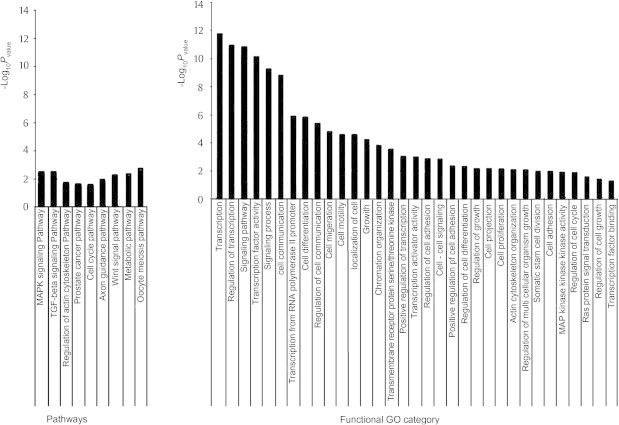
Highly enriched pathways and GO terms for the miRNA target gene set The functional categories that are enriched in response to miRNA deregulation in HCC were analyzed using GeneTrail with the enrichment analysis option (P < 0.05) and Bonferroni and FDR corrections.
Table 2.
KEGG pathway enrichment analysis for the deregulated miRNA target set
| KEGG_Subcategory | Expected | Observed | P value (FDR) | miRNAs | miRNA expression | Target genes |
|---|---|---|---|---|---|---|
| MAPK signaling pathway | 8.49658 | 21 (up) | 0.00300 | miR-96 | ↑ | PPP3R1, MAP2K1, CACNB4 |
| miR-222 | ↑ | PPP3R1, NTF3, NLK | ||||
| miR-21 | ↑ | NTF3 | ||||
| miR-221 | ↑ | NLK | ||||
| miR-106b | ↑ | MAP3K2, CRK, DUSP2, RPS6KA5, MAP3K14 | ||||
| miR-214 | ↓ | CRK | ||||
| miR-155 | ↑ | MAP3K14, FGF7 | ||||
| miR-34a | ↓ | CACNB3, RRAS, PDGFRA | ||||
| miR-195 | ↓ | FGF7, CACNB1 | ||||
| miR-183 | ↑ | MEF2C, MAP3K4, NTRK2, MAPK8IP1 | ||||
| miR-199a-3p | ↓ | MAP3K4 | ||||
| miR-182 | ↑ | RASA1 | ||||
| Metabolic | 35.6411 | 17 (up) | 0.00300 | miR-34a | ↑ | FUT8, GALNT7, NDST1, ACSL4, GLCE, ACSL1 |
| miR-214 | ↓ | GALNT7 | ||||
| miR-224 | ↑ | ACSL4 | ||||
| miR-186 | ↑ | ACSL4, BCAT1 | ||||
| miR-155 | ↑ | UPP2, BCAT1 | ||||
| miR-183 | ↑ | IDH2, GPAM, AMD1, MTMR6, SMPD3 | ||||
| miR-195 | ↓ | PISD | ||||
| miR-96 | ↑ | ABAT, GALNT2, EXT1 | ||||
| TGFβ (down-regulated) | 2.7049 | 11 | 0.00300 | miR-96 | ↑ | E2F5 |
| miR-106b | ↑ | E2F5, BMPRII, RBL2, ZFYVE9, RBL1, SMAD7 | ||||
| miR-34a | ↓ | E2F5, ACVR2B | ||||
| miR-21 | ↑ | SMAD7 | ||||
| miR-155 | ↑ | GDF6, SP1 | ||||
| miR-183 | ↑ | PPP2CA, PPP2C | ||||
| Oocyte meiosis | 3.62775 | 12 | 0.00532 | miR-96 | ↑ | PPP3R1, ITPR1, ITPR2, MAP2K1, FBXW11 |
| miR-34a | ↓ | CCNE2 | ||||
| miR-155 | ↑ | YWHAZ | ||||
| miR-183 | ↑ | PPP2CA, PPP2CB | ||||
| miR-195 | ↓ | BTRC | ||||
| miR-222 | ↑ | PPP3R1 | ||||
| miR-214 | ↓ | YWHAZ | ||||
| Wnt signaling pathway (up-regulated 88% of genes) | 4.80518 | 14 | 0.00532 | miR-96 | ↑ | PPP3R1, FBXW11 |
| miR-222 | ↑ | PPP3R1, NLK | ||||
| miR-106b | ↑ | NFAT5, ANGL1 | ||||
| miR-34a | ↓ | DAAM1, FOSL1, LEF1 | ||||
| miR-155 | ↑ | CSNK1A1 | ||||
| miR-183 | ↑ | PPP2CA, LRP6, PPP2CB | ||||
| miR-195 | ↓ | BTRC, AXIN2 | ||||
| miR-221 | ↑ | NLK | ||||
| miR-186 | ↑ | NFAT5 | ||||
| Axon guidance (up-regulated) | 4.10509 | 12 | 0.01178 | miR-96 | ↑ | PPP3R1 |
| miR-221 | ↑ | GNAI3 | ||||
| miR-106b | ↑ | NTN4, DPYSL5, EPHA4, NFAT5, CFL2, LIMK1, DPYSL2 | ||||
| miR-155 | ↑ | SEMA5A | ||||
| miR-182 | ↑ | RASA1 | ||||
| miR-224 | ↑ | ARHGEF12, DPYSL2 | ||||
| miR-222 | ↑ | PPP3R1 | ||||
| miR-96 | ↑ | NTN4 | ||||
| miR-183 | ↑ | EPHA4 | ||||
| miR-186 | ↑ | NFAT5 | ||||
| Regulation of actin cytoskeleton (mostly up-regulated, 84% of genes) | 6.87364 | 16 | 0.01739 | miR-106b | ↑ | ITGB8, CRK, PFN2 SSH2,CFL2, LIMK1 |
| miR-34a | ↓ | RRAS, PDGFRA | ||||
| miR-214 | ↓ | CRK | ||||
| miR-183 | ↑ | PFN2, TMSL3, TMSB4X, ENAH | ||||
| miR-155 | ↑ | FGF7 | ||||
| miR-195 | ↓ | FGF7 | ||||
| miR-122a | ↓ | GIT1 | ||||
| miR-224 | ↑ | ARHGEF12 | ||||
| miR-96 | ↑ | MAP2K1, FN1 | ||||
| Prostate cancer (up-regulated) | 2.83219 | 9 | 0.02272 | miR-222 | ↑ | CDKN1B |
| miR-106b | ↑ | E2F1, CDKN1A | ||||
| miR-34a | ↓ | CCNE2, LEF1, PDGFRA | ||||
| miR-182 | ↑ | BCL2 | ||||
| miR-96 | ↑ | CREB3L2, MAP2K1 | ||||
| Cell cycle | 4.07327 | 11 | 0.02474 | miR-222 | ↑ | CDKN1B, CDKN1C |
| miR-96 | ↑ | E2F5 | ||||
| miR-106b | ↑ | E2F5, RBL2, WEE1, E2F1, RBL1, CDKN1A | ||||
| miR-34a | ↓ | E2F5, CCNE2 | ||||
| miR-155 | ↑ | WEE1, YWHAZ | ||||
| miR-214 | ↓ | YWHAZ | ||||
| miR-21 | ↑ | STAG2 | ||||
Note: This table was generated using the GeneTrail enrichment for the miRNA targets on the KEGG database. Expected indicates the random effect of the targets in the pathway and observed means the actual effect of the targets in the pathway.
Table 3.
TRANSFAC enrichment analysis
| TRANSFAC_Subcategory | Expected | Observed | P value (FDR) | Genes |
|---|---|---|---|---|
| T09767 (hsa-miR-221) | 0.168593 | 4 | 8.90E–05 | CDKN1B, BMF, KIT, CDKN1C |
| T09768 (hsa-miR-222) | 0.126445 | 3 | 0.00110727 | CDKN1B, KIT, CDKN1C |
| T14653 (hsa-miR-21) | 0.252889 | 3 | 0.0134703 | PDCD4, SOX5, RASA1 |
| T06135 (TAp63 gamma) | 0.084296 | 2 | 0.0135548 | CDKN1A, JAG1 |
| T09762 (hsa-miR-34a) | 0.337186 | 3 | 0.0212936 | MYCN, NOTCH1, SIRT1 |
| T09877 (hsa-miR-20b) | 0.126445 | 2 | 0.0263714 | RBL2, E2F1 |
| T09807 (hsa-miR-15b) | 0.168593 | 2 | 0.0384832 | DMTF1, BCL2 |
| T09810 (hsa-miR-124a) | 0.168593 | 2 | 0.0384832 | STAT3, MITF |
Table 4.
A sample selection of the GO enrichment analysis
| GO term | Expected | Observed | P value (FDR) |
|---|---|---|---|
| Transcription | 76.0252 | 142 | 1.63E−12 |
| Regulation of transcription | 73.3377 | 136 | 1.02E−11 |
| Signaling pathway | 70.5671 | 132 | 1.38E−11 |
| Transcription factor activity | 26.7086 | 68 | 6.84E−11 |
| Signaling process | 71.3983 | 128 | 5.22E−10 |
| Cell communication | 46.74 | 94 | 1.53E−09 |
| Transcription from RNA polymerase II promoter | 25.4618 | 58 | 1.47E−07 |
| Cell differentiation | 50.8127 | 90 | 1.40E−06 |
| Regulation of cell communication | 32.4991 | 64 | 3.90E−06 |
| Cell migration | 12.8002 | 33 | 1.58E−05 |
| Cell motility | 13.7145 | 34 | 2.39E−05 |
| Localization of cell | 13.7145 | 34 | 2.39E−05 |
| Growth | 14.9612 | 35 | 5.65E−05 |
| Chromatin organization | 11.775 | 29 | 1.40E−04 |
| Transmembrane receptor protein serine/threonine kinase signaling pathway | 4.6269 | 16 | 2.70E−04 |
| Positive regulation of transcription | 16.5959 | 34 | 9.00E−04 |
The pathways that showed significant enrichment for the miRNA target set from Table S1 using the miRNA target genes were of two categories: active pathways and inactive pathways. Active pathways include MAPK signaling pathway (P = 0.0030), TGFβ signaling pathway (P = 0.0030), regulation of the actin cytoskeleton pathway (P = 0.0173), prostate cancer pathway (P = 0.0227), cell cycle pathway (P = 0.0247), axon guidance pathway, which controls regulation of actin cytoskeleton (P = 0.0117), Wnt signaling pathway (P = 0.0053) and oocyte meiosis pathway (P = 0.0053). On the other hand, there is only one pathway in the category of inactive pathways, which is the metabolic pathway (P = 0.0030).
The most common functions of the predicted targets included cell adhesion, proliferation, cell cycle regulation and apoptosis (Figure 5), which cover all the hallmarks of cancer (see Figure 1 for illustration) [50,51,54]. The significant enrichment of many GO annotations of the 26 miRNAs provides a clear picture for having a definitive impact on all HCC/other cancer hallmarks (Figures 4–6). Whether these effects are positive or negative depends on the specific miRNA(s) and their specific targets. This important impact of miRNAs in cancer has opened new therapeutic modalities for liver cancer by suppression or induction of these miRNAs [40–44].
Discussion
This study reports an improved protocol for prediction and analysis of novel miRNA targets that have been shown to be deregulated in liver cancer. It also sheds more light on their functional roles in relative to oncogenesis. Our study identified several targets related to oncogenesis and metastasis. Some of the predicted miRNA targets in this study have already been experimentally validated (according to databases of experimentally verified targets such as miRecord and miRTarBase).
The improved miRNA target prediction protocol
In this study, functional role of miRNA targets in liver cancer was evaluated and a comprehensive analysis of deregulated miRNAs in HCC was performed, yielding novel insight into carcinogenesis and metastasis. Below we discuss some of the important novel targets, according to pathway analysis and GO functional category enrichment analysis. The presence of tens of already experimentally-validated targets, after inspection of the experimentally-validated target databases, was the final step to confirm the reliability of this approach. The set of overlapping targets (core or common targets) would have a high specificity (low false positives), while the set of pooled targets predicted with different programs would have a high sensitivity, but high false positives. We used the core common targets to analyze these deregulated miRNAs in order to get a reliable analysis from the functional enrichment analysis. In discussing some of the key targets in the pathways below; we refer to the validated ones from miRecords and miRTarBase with [V] and predicted ones with [P]. A quantitative evaluation and comparison of the performance of our integrated approach is beyond the scope of this manuscript, and faces the challenge of correlating heterogeneous microarray studies to find a substantial inverse correlation between a miRNA and its targets. On a qualitative note, our core set is much smaller than that presented by a single tool (Figure 2, target prediction step), and has a high statistical significance (P < 0.01). More detailed comparisons of methods are aimed in the future. We then performed the pathway analysis and GO functional category enrichment analysis, trying to understand how deregulation of the targets would affect important cellular and molecular processes, induce/repress critical pathways, and hence contributing to carcinogenesis and metastasis.
Analysis of key target genes and pathways
The global analysis of hundreds of predicted targets in this study highlights the new key targets that were not discussed before. Also, unlike previous reports which only present enrichment analysis [35,50], an in-depth analysis is presented and discussed concerning the roles of the miRNAs and the contribution of their deregulation to cancer progression along with their roles in cancer hallmarks. Also, the mode of regulation of the different miRNAs whether to suppress or induce the pathway or the hallmark is inferred. These unravel significant new and valuable information on the different pathways affected by the set of highly differentially regulated miRNAs in liver cancer, and key genes that are affected in each of the enriched pathways. Some previous reports on the roles of miRNAs in liver cancer rely only on experimentally validated targets, thus limiting their scope of coverage [31,34,35,55]. In addition, some studies based their views on the role of a certain miRNA on only one validated target, which gives a very narrow and inaccurate perspective. Some exceptions in the literature include the recent work on global miRNA analysis in breast cancer [56]. This study found previously mentioned pathways linked to miRNA deregulation and liver cancer, such as the MAPK, TGFβ and cell cycle pathways, discussed in studies and reviews such as [10,34,35,50]. Meanwhile, the GeneTrail analysis showed up regulation of the Wnt signaling and the oocyte meiosis pathways (Table 2), in addition to axon guidance and actin cytoskeleton which are involved in developmental processes and in stem cell differentiation and proliferation, highlighting a possible link between miRNAs and errors in stem cell differentiation and their transformation into cancer stem cells [43,46,57]. The role of miRNAs in inducing cancer stem cells was previously noted for some well known tumor suppressor miRNAs like miR-34a and others in different tumors [16,44,46]. The link between miRNAs and stem cells was in agreement with previous reports highlighting miRNA roles in stem cell differentiation and liver cancer [44,57]. Also worth noting is emergence of the enriched prostate cancer pathway as an enriched pathway, signifying the important impact of miRNAs in cancer and offering possible general unified roles for these miRNAs in closely-related tumors like solid tumors.
The MAPK and mTOR signaling and cancer hallmarks
Interestingly, the MAPK signaling pathway was one of the enriched pathways with the highest statistical significance (with part of it and the candidate targets highlighted red in Figure S1 and some others shown in Table 2 and Figure 6 linked to crosstalks to other important pathways in cancer that are affected by the miRNA targets). Dual mode of regulation of target genes by miRNAs was noticed. For example, gene encoding fibroblast growth factor 7 (FGF7) is targeted by two miRNAs: miR-155 [V], which is validated in miRTarBase and miRWalk with up-regulated expression in HCC, and miR-195 [P] with down-regulated expression in HCC. FGF7 induces the MAPK pathway by binding to extracellular receptors [58]. FGF7 is inferred from its GO annotation to be involved in self-sufficiency in growth signals and limitless replicative potential, in addition to evading apoptosis and tissue invasion and metastasis [40] (Figures 1 and 6). Besides, FGF7 is also a key regulator of the actin cytoskeleton pathway (shown in pathway targets in Table 2). Furthermore, up regulation of FGF7 expression contributes to the FGF receptor signaling pathway [59] and positively regulates cell division, proliferation and keratinocyte migration pathways, which were also significantly enriched in the GO analysis (Figures 4 and 6 for part of the FGF pathway). Sufficiency in growth signals is revealed by significantly enriched GO terms such as growth and positive regulation of transcription (Figures 3 and 4). Another important key gene, mitogen-activated protein kinase kinase 1 (MAP2K1) (Figure S1), is a target for miR-96 [P], which is up regulated in HCC. MAP2K1 is the upstream activator of MAPK, thus occupying a central role in the MAPK pathway. Given its high selectivity to MAPK and elevated levels of constitutively activated MAP2K1 is frequently-observed in carcinoma cell lines [60], MAP2K1 represents an excellent target for pharmacological intervention.
Figure 6.
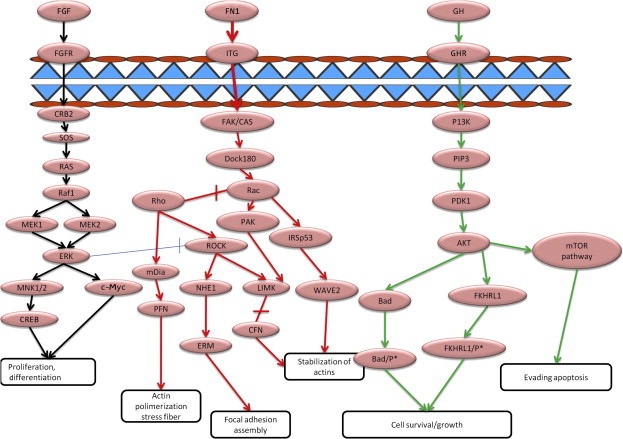
Important pathways in HCC Shown is the mTOR/AKP/PIP3 pathway that contributes to transformation of nodules into metastatic counterparts [57]. The target genes are indicated in green and key pathway phenotypes are shown at the bottom. Deactivation of the MAPK pathway through inhibition/repression of the up-regulating miRNAs or activation of suppressing miRNAs might be useful as an alternative therapeutic intervention strategy. Genes are indicated in pink ovals; FGF signaling pathway, actin cytoskeleton pathway and mTOR pathway are represented with lines in black, red and green, respectively.
Similarly, suppression of the MAPK signaling pathway could be inferred by miR-34 [V]. miR-34 suppresses platelet-derived growth factor A (PDGFRA) [V] (validated in miRTarBase) and other oncogenes that have been validated previously such as c-Met, NOTCH and Wnt1 [41]. Although of its predominant down expression in many cancer cell lines, the mixed levels of miR-34a in different liver cancer cell lines reported by different investigators may reflect the opposing mechanisms that affect its expression (activated by P53 and inactivated by methylation and many other factors) and contribute to enhancement or decrease of its tumor suppressor role in fighting cancer. Expression of miR-34a is activated by p53 protein, thus resulting in a high tumor-suppressing mode [61]. Also, miR-34 contributes to decreasing proliferation by targeting CCNE2 Cyclin E2 [V] (validated in miRTarBase and miRWalk), which may allow proliferation when miR-34 is down regulated. From our analysis and previous reports, hsa-miR-34 also targets PDGFRA and E2F5, all of which induce proliferation and replication [41]. Interestingly, miR-34, which is currently introduced as a replacement therapy for different cancers in the clinic, plays a clearly-defined role in stem cell regulation through regulating the Wnt signaling pathway [41].
In agreement with this, growth hormone receptor (GHR) is another predicted target for down-regulated miR-195 [P] in cancer tissue (Figures 6 and S1). miR-195 contributes to evading apoptosis, sustained angiogenesis, cell growth, tissue invasion and metastasis. This miRNA is an important tumor-suppressor [45]. Insensitivity to anti-growth signals, another important cancer hallmark, is illustrated by suppression of a tumor suppressor of MAPK signaling, the SPRY4 gene [62]. SPRY4 is predicted to be a target for miR-182 [P], which is highly expressed in HCC. As a result, SPRY4 expression is down-regulated in HCC. Additionally, RAS p21 protein activator 1 (RASA1), a target of up-regulated miR-182 [V] [63], stimulates the GTPase activity of normal RAS p21 but not its oncogenic counterpart, hence, acting as a suppressor of RAS and thereby allowing control of cellular proliferation and differentiation. Due to its down regulation, the active form of RAS is stimulated, which functions as an oncogene. These data support the inference of an oncomiR role for miR-182. Also, expression of receptor-type tyrosine-protein phosphatase F (PTPRF) that is involved in the negative regulation of epidermal growth factor receptor (EGFR) signaling pathway [64] would be up regulated, since it is a target for down-regulated miR-199a-3p [V] [65], leading to insensitivity to anti-growth signals. CACNB4 is one of the important genes in the MAPK pathway (controlled by miR-96 [V], which is highly expressed in HCC), hence, helping in controlling the MAPK signaling pathway.
The TGFβ pathway
The TGFβ was the second most highly enriched pathway (Figure S3). Bone morphogenetic protein (BMP) receptor II (BMPRII), through which the BMP ligand transduces its signals in the TGFβ pathway, was predicted as a target for miR-106b over-expressed in HCC. Upon ligand binding, BMPRII phosphorylates and activates BMPRI, which then initiates downstream signaling by phosphorylating the receptor-regulated Smads (R-Smads) [57]. Smad7, a negative regulator of TGFβ signaling, is targeted by miR-106b [V] [36] and miR-21 [V] [66] highly-expressed in HCC, resulting in down regulation of Smad7.
Cell cycle pathway
The E2F family plays a crucial role in the control of cell cycle and regulation of tumor suppressor proteins. E2F5, a regulator of the TGFβ and cell cycle pathways [67], was targeted by miR-96 [P], miR- 34a [V] (validated in miRTarBase) and miR-106 [P]. Down regulation of E2F5 through this combinatorial mechanism by miR-96 and miR-106 inhibits the synthesis of DNA, thus repressing the S phase. On the other hand, E2F5 is involved in cell cycle regulation by inhibiting c-Myc, an oncogene and a transcription factor that is believed to regulate expression of 15% of all genes [68]. Thus a reduced level of E2F5 would lead to compromised control over c-myc. These data suggest that involvement of different miRNAs with opposing roles for E2F5 which itself has dual roles could result in different outcomes.
Other new pathways linked to stem cells and their regulation that are significantly enriched in our analysis
Two additional pathways that were enriched for the miRNA target set genes include regulation of actin cytoskeleton and axon guidance. Cancer cells are marked by their ability to migrate and invade the adjacent tissues. Interestingly, several studies have shown that proteins linking migratory signals to actin cytoskeleton are up regulated in cancer tissues [69,70]. For example, fibronectin 1 (FN1) plays an important role in the actin cytoskeleton pathway because it activates the integrin (ITG) gene. ITG in turn activates a series of other genes, leading to the formation of actin fibers and polymerization [71,72], which connects the cells to each other. Therefore, the axon guidance pathway is involved in regulation of the actin cytoskeleton and represents a key factor in the formation of the neuronal network (Figures 6 and S2). Both pathways are inferred to be linked with tissue invasion and metastasis cancer hallmark.
The oocyte meiosis pathway is another enriched pathway for our gene set (part of which is shown in Figure S3). This pathway is highly important during the differentiation of stem cells [73]. MAP2K1 that was described in the aforementioned MAPK pathway is one of the most important genes in this pathway and contributes to control of stem cells and their oncogenic transformation.
Some other interesting targets in this pathway include adenylate cyclase 2 (ADCY2) and ADCY6, which are targets for miR-182. ADCY6 has been experimentally verified previously while ADCY2 is reported in this work for the first time. ADCY2 is involved in the chemokine signaling pathway and is one of the key genes in the oocyte meiosis pathway. Once it is activated through progesterone induction, it activates a series of gene cascades leading to completion of the meiosis process.
Conclusion
Some important conclusions that could be drawn from this study on some of the general features of miRNAs roles in liver cancer are as follows. (1) The miRNA targets, as revealed from their enriched GO annotations and pathways, cover many of the known hallmarks of cancer [51,52,54]. Expression of many growth and transcription factors is up regulated due to the down regulation of their regulating miRNAs. (2) Positive contribution to cancer development is implicated for many down-regulated miRNAs that suppress important oncogenes, such as miR-122, miR-214, miR-199a-3p/5p and miR-34a, and for several up-regulated miRNAs that suppress tumor-suppressors, such as miR-182 and miR-186 oncomiRs. Some miRNAs may play dual roles by targeting both tumor-suppressors and oncogenes. Therefore, without complete analysis of their targets and pathways (interactome), caution should be taken in defining the role of deregulated miRNAs in liver cancer, as well as in using miRNAs in cancer therapeutics. (3) Some miRNAs down regulate cancer hallmarks by downregulating some oncogenic pathways, which was also inferred by other studies [74]. Although there is an ongoing debate on what are cancer hall marks and the complex interplay between causes, oncogenic events, signal transduction programs and hallmarks [54,75], it is clear that miRNA deregulation can have dual roles. (4) miR-96 was inferred in this study to play a tumor suppressor role by targeting MAP2K1, E2F5 and CACNB4. miR-96 was reported to suppress oncogenes such as glypican-3 (GPC3) [76], although an oncomiR role was inferred as well. Silencing of miR96 was associated with decreased expression of osteopontin and forkhead box O1 (FOXO1) and FOXO3a and hence decreased invasion and metastasis and proliferation, respectively [77,78]. Some targets were found to be controlled by more than one miRNA. Also, some TFs like TP63 gamma coordinate with miRNAs for regulation of some targets, supporting the miRNA-TF regulatory network analysis [79]. (5) Targets of miR-96, miR-106b, miR-34a and miR-155 were most often highly represented in the most enriched oncogenic pathways, suggesting their involvement in liver cancer.
Materials and methods
The miRNA data were downloaded from miRBase release 19 (http://www.mirbase.org/). The steps of this comprehensive global analysis of differentially-regulated miRNAs in liver cancer are detailed below and also illustrated in Figure 2. This workflow is similar to the integrative automated siRNA design and selection protocol and tool that we previously devised [80].
Protocol for miRNA target prediction
miRNA prediction was done using five different programs in the present study to ensure high specificity in target prediction. The programs that were used include TargetScan 5.1 [81], PicTar [82], DIANA-microT v3.0 [83], miRDB [84] and miRanda [23]. Targets that were commonly predicted by 4 or 5 out of 5 programs were retained. The programs were chosen to represent different approaches for miRNA target prediction. The miRanda prediction software identified potential binding sites by looking for high-complementarity regions on the 3′UTRs, which is called seed region [23]. Then the resulting binding sites are evaluated thermodynamically using the Vienna RNA folding package. The second program TargetScan 5.1 [81] combines thermodynamics-based modeling of RNA–RNA duplex interactions with comparative sequence analysis to predict miRNA targets conserved across multiple mammalian genomes. TargetScan mainly depends on perfect complementarity to the seed region of miRNA and then extends to complementarity outside the region. PicTar also depends on the seed region complementarity and its most distinguishing feature is its probabilistic identification of combinations of target sites [82]. DIANA-microT 3.0 [83] searches in the UTRs for stringent seed paring (at least 7 consecutive Watson–Crick pairs) to the miRNA. The last algorithm miRDB uses a newly developed SVM classifier [84].
Identification of experimentally-validated targets and differentially-expressed predicted targets in HCC
Next, the targets were compared against already predicted and validated targets known in databases such as the database of experimentally-validated targets in miRTarBase (http://mirtarbase.mbc.nctu.edu.tw/) and miRecord (http://mirecords.biolead.org/) [79].
Combining microarray data
The microarray dataset showing differentially-expressed genes in hepatocellular carcinoma patients [48] was used to correlate the predicted targets and those differentially-expressed in HCC patients. The two-sample t-test was used for correlation analysis. This was yet another step to improve the reliability of the predictions of the miRNA targets.
Ranking according to MFE
Ranking of miRNA targets was done using the RNAhybrid program according to MFE, (ΔG) [36,81]. Some important examples are illustrated in Figure 3.
Shuffling and statistical analysis of the targets
Statistical analysis of the targets was performed to support the validity of the prediction. We used Jemboss (graphical user interface for European Molecular Biology Open Software Suite) Shuffle Seq program [85], in which the target’s sequences were shuffled 500 times as previously described [17]. The 100 sets for each of the target genes were independently searched against its reported predicted miRNA using miRanda software. Z scores were calculated for each target using the equation (where X is the miRanda score for real gene, μ and δ are the mean and standard deviation for miRanda score of each miRNA with shuffle gene). Then, P values were calculated to estimate the significance of the predicted targets.
Statistical enrichment analysis of the predicted target set
Statistically overrepresented functions were revealed in a sample of seven miRNA targets as a first indication of essential enriched terms by using the database for annotation, visualization and integrated discovery (DAVID) (http://david.abcc.ncifcrf.gov/summary.jsp). This was combined with a more comprehensive analysis, enrichment analysis of the predicted target set, using the GeneTrail tool [86] (http://genetrail.bioinf.uni-sb.de/) with FDR and Bonferroni corrections for multiple items in the set. The list of predicted genes was compared against a random list of genes to predict which functions and pathways are enriched in the target genes and significance level [50]. GeneTrail was used again to obtain the functions of different miRNA target sets and their combinations for identifying their possible roles in cancer.
Authors’ contributions
ME conceived the idea and designed the study. ME, MA and BS performed the study, analyzed the data and drafted the manuscript. MA, NA and ME revised the manuscript. All authors read and approved the final manuscript.
Competing interests
The authors report no competing interests.
Acknowledgements
We acknowledge partial support through Science and Technology Development Fund (STDF) by Egyptian Ministry of Scientific Research (Grant No. 1169 and 1679). We thank the help and assistance of Dr. Suher Zada and of many research assistants in the group for their long-standing efforts. We are very grateful to Gehad Abdel Rahman, Mohamed Mysara, Soha Gamal ElDin, Asmaa Ezzat, Lesley Twaitol, Dr. Fareed Aboul-Ela, Dr. Manal ElHemshary especially among others for their roles in editing/revising and data analysis during the course of this publication. We also thank Dr. Marc Windisch for editing and revising the manuscript.
Footnotes
Peer review under responsibility of Beijing Institute of Genomics, Chinese Academy of Sciences and Genetics Society of China.

Appendix Supplementary. material
The MAPK signaling pathway. This figure shows our target genes (red boxes) that are involved in the MAPK signaling pathway, which has an important role in nearly all types of cancer. These genes are found at important positions on the pathway. The figure was generated from the KEGG pathways using the enrichment protocol by GeneTrail tool.
The Axon guidance pathway. This pathway is mainly involved in cell development and stem cell maturation. Investigation of genes coding for the components of this pathway helps to understand how stem cell deregulation may affect cancer development. Predicted targets in this study are shown in red boxes.
Part of the enriched cell cycle, prostate cancer, oocyte meiosis and TGFβ pathways and some important targets in these enriched pathways. (A) Part of the cell cycle pathway. The E2F1 is regulated by miR-106 which also regulates E2F5 in coordination with miR-96. Additionally, CycE gene is a target for down-regulated miR-34a. These important targets are involved in controlling the S-phase proteins in this pathway. (B) Part of the enriched prostate cancer pathway. Different pathway phenotypes are associated with our targets like tumor suppressor gene (PTEN) [87], cell survival (BCL2), cell proliferation (TCF/LEF), G1/S progression (E2F), cell cycle progression (p21 and p27) and GFR, an important key gene regulating a long cascade leading to all of the aforementioned pathway phenotypes in addition to cell proliferation and survival. (C) The oocyte meiosis pathway with some of our predicted target genes integrated. The PPP2CA (PP2A) and CCNE2 (CycE) genes regulating meiosis II exist in the oocyte meiosis pathway. BTRC (β-TrCP) is another important gene involved in different stages of this important pathway. ITPR1 (IP3R) is the key gene that functions after fertilization and controls a long cascade of different genes. (D) Part of the TGF-beta signaling pathway. miR-106 controls smad-7 and p107, which are two important genes in this pathway controlling apoptosis and G1 arrest in cell cycle. BMPRII, ActinRII and NodalRII are three important targets which are receptor in the TGFβ signaling pathway. BMPRII regulates different genes reaching to osteoclast differentiation, neurogenesis and ventral mesoderm specification. ActinRII and NodalRII regulate gonadal growth, embryo differentiation, placenta formation, left-and right axis determination mesoderm and endoderm. Predicted targets in this study are shown in red boxes.
Targets commonly predicted by at least 4 out of 5 programs. Shown in the table are hsa-miRNAs, their level of expression in HCC and their targets predicted by at least 4 out of the 5 programs including TargetScan 5.1 [81], PicTar [82], DIANA-microT v3.0 [83], miRDB [84] and miRanda [23]. Asterisk (∗) indicates the differentially expressed genes in HCC according to the published microarray results according to [48].
References
- 1.Bartel D.P. MicroRNAs: genomics, biogenesis, mechanism, and function. Cell. 2004;116:281–297. doi: 10.1016/s0092-8674(04)00045-5. [DOI] [PubMed] [Google Scholar]
- 2.Sassen S., Miska E.A., Caldas C. MicroRNA—implications for cancer. Virchows Arch. 2008;452:1–10. doi: 10.1007/s00428-007-0532-2. [DOI] [PMC free article] [PubMed] [Google Scholar]
- 3.Xiao Z.D., Diao L.T., Yang J.H., Xu H., Huang M.B., Deng Y.J. Deciphering the transcriptional regulation of microRNA genes in humans with ACTLocater. Nucleic Acids Res. 2013;41:e5. doi: 10.1093/nar/gks821. [DOI] [PMC free article] [PubMed] [Google Scholar]
- 4.Holland B., Wong J., Li M., Rasheed S. Identification of human microRNA-like sequences embedded within the protein-encoding genes of the human immunodeficiency virus. PLoS One. 2013;8:e58586. doi: 10.1371/journal.pone.0058586. [DOI] [PMC free article] [PubMed] [Google Scholar]
- 5.Calin G.A., Sevignani C., Dumitru C.D., Hyslop T., Noch E., Yendamuri S. Human microRNA genes are frequently located at fragile sites and genomic regions involved in cancers. Proc Natl Acad Sci U S A. 2004;101:2999–3004. doi: 10.1073/pnas.0307323101. [DOI] [PMC free article] [PubMed] [Google Scholar]
- 6.Xu S., Witmer P.D., Lumayag S., Kovacs B., Valle D. MicroRNA (miRNA) transcriptome of mouse retina and identification of a sensory organ-specific miRNA cluster. J Biol Chem. 2007;282:25053–25066. doi: 10.1074/jbc.M700501200. [DOI] [PubMed] [Google Scholar]
- 7.Chen Y.J., Min J., Shang C.Z., Ren M., Peng X.X., Cao J. MicroRNA differential expression profile during differentiation of embryonic stem cells towards hepatocytes induced by sodium butyrate. Zhongguo Yi Xue Ke Xue Yuan Xue Bao. 2008;30:469–473. [PubMed] [Google Scholar]
- 8.Cho W.C. MicroRNAs: potential biomarkers for cancer diagnosis, prognosis and targets for therapy. Int J Biochem Cell Biol. 2010;42:1273–1281. doi: 10.1016/j.biocel.2009.12.014. [DOI] [PubMed] [Google Scholar]
- 9.Bartels C.L., Tsongalis G.J. MicroRNAs: novel biomarkers for human cancer. Clin Chem. 2009;55:623–631. doi: 10.1373/clinchem.2008.112805. [DOI] [PubMed] [Google Scholar]
- 10.Chen F., Hu S.J. Effect of microRNA-34a in cell cycle, differentiation, and apoptosis: a review. J Biochem Mol Toxicol. 2012;26:79–86. doi: 10.1002/jbt.20412. [DOI] [PubMed] [Google Scholar]
- 11.Brennecke J., Stark A., Russell R.B., Cohen S.M. Principles of microRNA-target recognition. PLoS Biol. 2005;3:e85. doi: 10.1371/journal.pbio.0030085. [DOI] [PMC free article] [PubMed] [Google Scholar]
- 12.Brodersen P., Voinnet O. Revisiting the principles of microRNA target recognition and mode of action. Nat Rev Mol Cell Biol. 2009;10:141–148. doi: 10.1038/nrm2619. [DOI] [PubMed] [Google Scholar]
- 13.Graves P., Zeng Y. Biogenesis of mammalian microRNAs: a global view. Genomics Proteomics Bioinformatics. 2012;10:239–245. doi: 10.1016/j.gpb.2012.06.004. [DOI] [PMC free article] [PubMed] [Google Scholar]
- 14.Esquela-Kerscher A., Slack F.J. Oncomirs – microRNAs with a role in cancer. Nat Rev Cancer. 2006;6:259–269. doi: 10.1038/nrc1840. [DOI] [PubMed] [Google Scholar]
- 15.Yan K., Gao J., Yang T., Ma Q., Qiu X., Fan Q. MicroRNA-34a inhibits the proliferation and metastasis of osteosarcoma cells both in vitro and in vivo. PLoS One. 2012;7:e33778. doi: 10.1371/journal.pone.0033778. [DOI] [PMC free article] [PubMed] [Google Scholar]
- 16.Lodygin D., Tarasov V., Epanchintsev A., Berking C., Knyazeva T., Körner H. Inactivation of mir-34a by aberrant cpg methylation in multiple types of cancer. Cell Cycle. 2008;7:2591–2600. doi: 10.4161/cc.7.16.6533. [DOI] [PubMed] [Google Scholar]
- 17.Varnholt H. The role of microRNAs in primary liver cancer. Ann Hepatol. 2008;7:104–113. [PubMed] [Google Scholar]
- 18.Worley L.A., Long M.D., Onken M.D., Harbour J.W. Micro-RNAs associated with metastasis in uveal melanoma identified by multiplexed microarray profiling. Melanoma Res. 2008;18:184–190. doi: 10.1097/CMR.0b013e3282feeac6. [DOI] [PubMed] [Google Scholar]
- 19.Lee R.C., Feinbaum R.L., Ambros V. The C. elegans heterochronic gene lin-4 encodes small RNAs with antisense complementarity to lin-14. Cell. 1993;75:843–854. doi: 10.1016/0092-8674(93)90529-y. [DOI] [PubMed] [Google Scholar]
- 20.Mendes N.D., Freitas A.T., Sagot M.F. Current tools for the identification of miRNA genes and their targets. Nucleic Acids Res. 2009;37:2419–2433. doi: 10.1093/nar/gkp145. [DOI] [PMC free article] [PubMed] [Google Scholar]
- 21.Watanabe Y., Tomita M., Kanai A. Computational methods for microRNA target prediction. Methods Enzymol. 2007;427:65–86. doi: 10.1016/S0076-6879(07)27004-1. [DOI] [PubMed] [Google Scholar]
- 22.Min H., Yoon S. Got target? Computational methods for microRNA target prediction and their extension. Exp Mol Med. 2010;42:233–244. doi: 10.3858/emm.2010.42.4.032. [DOI] [PMC free article] [PubMed] [Google Scholar]
- 23.John B., Enright A.J., Aravin A., Tuschl T., Sander C., Marks D.S. Human microRNA targets. PLoS Biol. 2004;2:e363. doi: 10.1371/journal.pbio.0020363. [DOI] [PMC free article] [PubMed] [Google Scholar]
- 24.Chandra V., Girijadevi R., Nair A.S., Pillai S.S., Pillai R.M. MTar: a computational microRNA target prediction architecture for human transcriptome. BMC Bioinformatics. 2010;11:S2. doi: 10.1186/1471-2105-11-S1-S2. [DOI] [PMC free article] [PubMed] [Google Scholar]
- 25.Liu H., Yue D., Zhang L., Chen Y., Gao S.J., Huang Y. A Bayesian approach for identifying miRNA targets by combining sequence prediction and gene expression profiling. BMC Genomics. 2010;11:S12. doi: 10.1186/1471-2164-11-S3-S12. [DOI] [PMC free article] [PubMed] [Google Scholar]
- 26.Lekprasert P., Mayhew M., Ohler U. Assessing the utility of thermodynamic features for microRNA target prediction under relaxed seed and no conservation requirements. PLoS One. 2011;6:e20622. doi: 10.1371/journal.pone.0020622. [DOI] [PMC free article] [PubMed] [Google Scholar]
- 27.Barbato C., Arisi I., Frizzo M.E., Brandi R., Da Sacco L., Masotti A. Computational challenges in miRNA target predictions: to be or not to be a true target? J Biomed Biotechnol. 2009;2009:803069. doi: 10.1155/2009/803069. [DOI] [PMC free article] [PubMed] [Google Scholar]
- 28.Dweep H., Sticht C., Pandey P., Gretz N. MiRWalk – database: prediction of possible miRNA binding sites by “walking” the genes of three genomes. J Biomed Inform. 2011;44:839–847. doi: 10.1016/j.jbi.2011.05.002. [DOI] [PubMed] [Google Scholar]
- 29.Friedman Y., Naamati G., Linial M. MiRror: a combinatorial analysis web tool for ensembles of microRNAs and their targets. Bioinformatics. 2010;26:1920–1921. doi: 10.1093/bioinformatics/btq298. [DOI] [PubMed] [Google Scholar]
- 30.Temirak A., Abdulla M., Elhefnawi M. Rational drug design for identifying novel multi-target inhibitors for hepatocellular carcinoma. Anticancer Agents Med Chem. 2012;12:1088–1097. doi: 10.2174/187152012803529718. [DOI] [PubMed] [Google Scholar]
- 31.Ura S., Honda M., Yamashita T., Ueda T., Takatori H., Nishino R. Differential microRNA expression between hepatitis B and hepatitis C leading disease progression to hepatocellular carcinoma. Hepatology. 2009;49:1098–1112. doi: 10.1002/hep.22749. [DOI] [PubMed] [Google Scholar]
- 32.Pei Y., Zhang T., Renault V., Zhang X. An overview of hepatocellular carcinoma study by omics-based methods. Acta Biochim Biophys Sin (Shanghai) 2009;41:1–15. doi: 10.1093/abbs/gmn001. [DOI] [PubMed] [Google Scholar]
- 33.Hou J., Lin L., Zhou W., Wang Z., Ding G., Dong Q. Identification of miRNomes in human liver and hepatocellular carcinoma reveals mir-199a/b-3p as therapeutic target for hepatocellular carcinoma. Cancer Cell. 2011;19:232–243. doi: 10.1016/j.ccr.2011.01.001. [DOI] [PubMed] [Google Scholar]
- 34.Huang S., He X. The role of microRNAs in liver cancer progression. Br J Cancer. 2011;104:235–240. doi: 10.1038/sj.bjc.6606010. [DOI] [PMC free article] [PubMed] [Google Scholar]
- 35.Murakami Y., Yasuda T., Saigo K., Urashima T., Toyoda H., Okanoue T. Comprehensive analysis of microRNA expression patterns in hepatocellular carcinoma and non-tumorous tissues. Oncogene. 2006;25:2537–2545. doi: 10.1038/sj.onc.1209283. [DOI] [PubMed] [Google Scholar]
- 36.Wang Y., Lee A.T., Ma J.Z.I., Wang J., Ren J., Yang Y. Profiling microRNA expression in hepatocellular carcinoma reveals microRNA-224 up-regulation and apoptosis inhibitor-5 as a microRNA-224-specific target. J Biol Chem. 2008;283:13205–13215. doi: 10.1074/jbc.M707629200. [DOI] [PubMed] [Google Scholar]
- 37.Barshack I., Meiri E., Rosenwald S., Lebanony D., Bronfeld M., Aviel-Ronen S. Differential diagnosis of hepatocellular carcinoma from metastatic tumors in the liver using microRNA expression. Int J Biochem Cell Biol. 2010;42:1355–1362. doi: 10.1016/j.biocel.2009.02.021. [DOI] [PubMed] [Google Scholar]
- 38.Pineau P., Volinia S., McJunkin K., Marchio A., Battiston C., Terris B. MiR-221 overexpression contributes to liver tumorigenesis. Proc Natl Acad Sci U S A. 2010;107:264–269. doi: 10.1073/pnas.0907904107. [DOI] [PMC free article] [PubMed] [Google Scholar]
- 39.Hirata H., Ueno K., Shahryari V., Tanaka Y., Tabatabai Z.L., Hinoda Y. Oncogenic miRNA-182-5p targets Smad4 and RECK in human bladder cancer. PLoS One. 2012;7:e51056. doi: 10.1371/journal.pone.0051056. [DOI] [PMC free article] [PubMed] [Google Scholar]
- 40.Coulouarn C., Factor V.M., Andersen J.B., Durkin M.E., Thorgeirsson S.S. Loss of miR-122 expression in liver cancer correlates with suppression of the hepatic phenotype and gain of metastatic properties. Oncogene. 2009;28:3526–3536. doi: 10.1038/onc.2009.211. [DOI] [PMC free article] [PubMed] [Google Scholar]
- 41.Gupta O.P., Permar V., Koundal V., Singh U.D., Praveen S. MicroRNA regulated defense responses in Triticum aestivum L. during Puccinia graminis f.sp. tritici infection. Mol Biol Rep. 2012;39:817–824. doi: 10.1007/s11033-011-0803-5. [DOI] [PubMed] [Google Scholar]
- 42.Watanabe Y., Kishi A., Yachie N., Kanai A., Tomita M. Computational analysis of microRNA-mediated antiviral defense in humans. FEBS Lett. 2007;581:4603–4610. doi: 10.1016/j.febslet.2007.08.049. [DOI] [PubMed] [Google Scholar]
- 43.Shimono Y., Zabala M., Cho R.W., Lobo N., Dalerba P., Qian D. Downregulation of miRNA-200c links breast cancer stem cells with normal stem cells. Cell. 2009;138:592–603. doi: 10.1016/j.cell.2009.07.011. [DOI] [PMC free article] [PubMed] [Google Scholar]
- 44.Bader A.G. MiR-34 – a microRNA replacement therapy is headed to the clinic. Front Genet. 2012;3:120. doi: 10.3389/fgene.2012.00120. [DOI] [PMC free article] [PubMed] [Google Scholar]
- 45.Xu T., Zhu Y., Xiong Y., Ge Y.Y., Yun J.P., Zhuang S.M. MicroRNA-195 suppresses tumorigenicity and regulates G1/S transition of human hepatocellular carcinoma cells. Hepatology. 2009;50:113–121. doi: 10.1002/hep.22919. [DOI] [PubMed] [Google Scholar]
- 46.Ji Q., Hao X., Zhang M., Tang W., Yang M., Li L. MicroRNA miR-34 inhibits human pancreatic cancer tumor-initiating cells. PLoS One. 2009;4:e6816. doi: 10.1371/journal.pone.0006816. [DOI] [PMC free article] [PubMed] [Google Scholar]
- 47.Huang Y.S., Dai Y., Yu X.F., Bao S.Y., Yin Y.B., Tang M. Microarray analysis of microRNA expression in hepatocellular carcinoma and non-tumorous tissues without viral hepatitis. J Gastroenterol Hepatol. 2008;23:87–94. doi: 10.1111/j.1440-1746.2007.05223.x. [DOI] [PubMed] [Google Scholar]
- 48.Mas V.R., Maluf D.G., Archer K.J., Yanek K., Williams B., Fisher R.A. Differentially expressed genes between early and advanced hepatocellular carcinoma (HCC) as a potential tool for selecting liver transplant recipients. Mol Med. 2006;12:97–104. doi: 10.2119/2006-00032.Mas. [DOI] [PMC free article] [PubMed] [Google Scholar]
- 49.Rehmsmeier M., Steffen P., Hochsmann M., Giegerich R. Fast and effective prediction of microRNA/target duplexes. RNA. 2004;10:1507–1517. doi: 10.1261/rna.5248604. [DOI] [PMC free article] [PubMed] [Google Scholar]
- 50.Backes C., Meese E., Lenhof H.P., Keller A. A dictionary on microRNAs and their putative target pathways. Nucleic Acids Res. 2010;38:4476–4486. doi: 10.1093/nar/gkq167. [DOI] [PMC free article] [PubMed] [Google Scholar]
- 51.Hanahan D., Weinberg R.A. The hallmarks of cancer. Cell. 2000;100:57–70. doi: 10.1016/s0092-8674(00)81683-9. [DOI] [PubMed] [Google Scholar]
- 52.Hanahan D., Weinberg R.A. Hallmarks of cancer: the next generation. Cell. 2011;144:646–674. doi: 10.1016/j.cell.2011.02.013. [DOI] [PubMed] [Google Scholar]
- 53.Jiang J., Gusev Y., Aderca I., Mettler T.A., Nagorney D.M., Brackett D.J. Association of microRNA expression in hepatocellular carcinomas with hepatitis infection, cirrhosis, and patient survival. Clin Cancer Res. 2008;14:419–427. doi: 10.1158/1078-0432.CCR-07-0523. [DOI] [PMC free article] [PubMed] [Google Scholar]
- 54.Lazebnik Y. What are the hallmarks of cancer? Nat Rev Cancer. 2010;10:232–233. doi: 10.1038/nrc2827. [DOI] [PubMed] [Google Scholar]
- 55.Bala S., Marcos M., Szabo G. Emerging role of microRNAs in liver diseases. World J Gastroenterol. 2009;15:5633–5640. doi: 10.3748/wjg.15.5633. [DOI] [PMC free article] [PubMed] [Google Scholar]
- 56.Uhlmann S., Mannsperger H., Zhang J.D., Horvat E.Á., Schmidt C., Küblbeck M. Global microRNA level regulation of EGFR-driven cell-cycle protein network in breast cancer. Mol Syst Biol. 2012;8:570. doi: 10.1038/msb.2011.100. [DOI] [PMC free article] [PubMed] [Google Scholar]
- 57.Xia H., Ooi L.L., Hui K.M. MicroRNA-216a/217-induced epithelial-mesenchymal transition targets PTEN and SMAD7 to promote drug resistance and recurrence of liver cancer. Hepatology. 2013;58:629–641. doi: 10.1002/hep.26369. [DOI] [PubMed] [Google Scholar]
- 58.Fata J.E., Mori H., Ewald A.J., Zhang H., Yao E., Werb Z. The MAPK(ERK-1,2) pathway integrates distinct and antagonistic signals from TGFalpha and FGF7 in morphogenesis of mouse mammary epithelium. Dev Biol. 2007;306:193–207. doi: 10.1016/j.ydbio.2007.03.013. [DOI] [PMC free article] [PubMed] [Google Scholar]
- 59.Turner N., Grose R. Fibroblast growth factor signalling: from development to cancer. Nat Rev Cancer. 2010;10:116–129. doi: 10.1038/nrc2780. [DOI] [PubMed] [Google Scholar]
- 60.Choi Y.L., Soda M., Ueno T., Hamada T., Haruta H., Yamato A. Oncogenic MAP2K1 mutations in human epithelial tumors. Carcinogenesis. 2012;33:956–961. doi: 10.1093/carcin/bgs099. [DOI] [PubMed] [Google Scholar]
- 61.Dalgard C.L., Gonzalez M., deNiro J.E., O’Brien J.M. Differential microRNA-34a expression and tumor suppressor function in retinoblastoma cells. Invest Ophthalmol Vis Sci. 2009;50:4542–4551. doi: 10.1167/iovs.09-3520. [DOI] [PubMed] [Google Scholar]
- 62.Yang X., Gong Y., Tang Y., Li H., He Q., Gower L. Spry1 and Spry4 differentially regulate human aortic smooth muscle cell phenotype via Akt/FoxO/myocardin signaling. PLoS One. 2013;8:e58746. doi: 10.1371/journal.pone.0058746. [DOI] [PMC free article] [PubMed] [Google Scholar]
- 63.Xu J., Wong C. A computational screen for mouse signaling pathways targeted by microRNA clusters. RNA. 2008;14:1276–1283. doi: 10.1261/rna.997708. [DOI] [PMC free article] [PubMed] [Google Scholar]
- 64.Du W.W., Fang L., Li M., Yang X., Liang Y., Peng C. MicroRNA miR-24 enhances tumor invasion and metastasis by targeting PTPN9 and PTPRF to promote EGF signaling. J Cell Sci. 2013;126:1440–1453. doi: 10.1242/jcs.118299. [DOI] [PubMed] [Google Scholar]
- 65.Amer M., El-Ahwany E., Elhefnawi M., Awad A., Abdel Gawad N., Zada S. Prediction of miRNA target genes involved in liver cancer pathways and its validation. J Hepatol. 2013;58:S120. [Google Scholar]
- 66.Smith A.L., Iwanaga R., Drasin D.J., Micalizzi D.S., Vartuli R.L., Tan A.C. The miR-106b-25 cluster targets Smad7, activates TGF-β signaling, and induces EMT and tumor initiating cell characteristics downstream of Six1 in human breast cancer. Oncogene. 2012;31:5162–5171. doi: 10.1038/onc.2012.11. [DOI] [PMC free article] [PubMed] [Google Scholar]
- 67.Jiang Y., Yim S.H., Xu H.D., Jung S.H., Yang S.Y., Hu H.J. A potential oncogenic role of the commonly observed E2F5 overexpression in hepatocellular carcinoma. World J Gastroenterol. 2011;17:470–477. doi: 10.3748/wjg.v17.i4.470. [DOI] [PMC free article] [PubMed] [Google Scholar]
- 68.Gearhart J., Pashos E.E., Prasad M.K. Pluripotency redux — advances in stem-cell research. N Engl J Med. 2007;357:1469–1472. doi: 10.1056/NEJMp078126. [DOI] [PubMed] [Google Scholar]
- 69.Yamaguchi H., Condeelis J. Regulation of the actin cytoskeleton in cancer cell migration and invasion. Biochim Biophys Acta. 2007;1773:642–652. doi: 10.1016/j.bbamcr.2006.07.001. [DOI] [PMC free article] [PubMed] [Google Scholar]
- 70.Bloom L., Ingham K.C., Hynes R.O. Fibronectin regulates assembly of actin filaments and focal contacts in cultured cells via the heparin-binding site in repeat III13. Mol Biol Cell. 1999;10:1521–1536. doi: 10.1091/mbc.10.5.1521. [DOI] [PMC free article] [PubMed] [Google Scholar]
- 71.Galbraith C.G., Yamada K.M., Galbraith J.A. Polymerizing actin fibers position integrins primed to probe for adhesion sites. Science. 2007;315:992–995. doi: 10.1126/science.1137904. [DOI] [PubMed] [Google Scholar]
- 72.Vicente-Manzanares M., Choi C.K., Horwitz A.R. Integrins in cell migration – the actin connection. J Cell Sci. 2009;122:199–206. doi: 10.1242/jcs.018564. [DOI] [PMC free article] [PubMed] [Google Scholar]
- 73.Takebe N., Warren R., Ivy S.P. Breast cancer growth and metastasis: interplay between cancer stem cells, embryonic signaling pathways and epithelial-to-mesenchymal transition. Breast Cancer Res. 2011;13:211. doi: 10.1186/bcr2876. [DOI] [PMC free article] [PubMed] [Google Scholar]
- 74.Gusev Y. Computational methods for analysis of cellular functions and pathways collectively targeted by differentially expressed microRNA. Methods. 2008;44:61–72. doi: 10.1016/j.ymeth.2007.10.005. [DOI] [PubMed] [Google Scholar]
- 75.Floor S.L., Dumont J.E., Maenhaut C., Raspe E. Hallmarks of cancer: of all cancer cells, all the time? Trends Mol Med. 2012;18:509–515. doi: 10.1016/j.molmed.2012.06.005. [DOI] [PubMed] [Google Scholar]
- 76.Maurel M., Jalvy S., Ladeiro Y., Combe C., Vachet L., Sagliocco F. A functional screening identifies five microRNAs controlling glypican-3: role of miR-1271 down-regulation in hepatocellular carcinoma. Hepatology. 2013;57:195–204. doi: 10.1002/hep.25994. [DOI] [PubMed] [Google Scholar]
- 77.Chen R.X., Xia Y.H., Xue T.C., Ye S.L. Suppression of microRNA-96 expression inhibits the invasion of hepatocellular carcinoma cells. Mol Med Rep. 2012;5:800–804. doi: 10.3892/mmr.2011.695. [DOI] [PubMed] [Google Scholar]
- 78.Xu D., He X., Chang Y., Xu C., Jiang X., Sun S. Inhibition of miR-96 expression reduces cell proliferation and clonogenicity of HepG2 hepatoma cells. Oncol Rep. 2013;29:653–661. doi: 10.3892/or.2012.2138. [DOI] [PubMed] [Google Scholar]
- 79.Wang J., Haubrock M., Cao K.M., Hua X., Zhang C.Y., Wingender E. Regulatory coordination of clustered microRNAs based on microRNA-transcription factor regulatory network. BMC Syst Biol. 2011;5:199. doi: 10.1186/1752-0509-5-199. [DOI] [PMC free article] [PubMed] [Google Scholar]
- 80.Mysara M., Garibaldi J.M., Elhefnawi M. MysiRNA-designer: a workflow for efficient siRNA design. PLoS One. 2011;6:e25642. doi: 10.1371/journal.pone.0025642. [DOI] [PMC free article] [PubMed] [Google Scholar]
- 81.Lewis B.P., Burge C.B., Bartel D.P. Conserved seed pairing, often flanked by adenosines, indicates that thousands of human genes are microRNA targets. Cell. 2005;120:15–20. doi: 10.1016/j.cell.2004.12.035. [DOI] [PubMed] [Google Scholar]
- 82.Krek A., Grun D., Poy M.N., Wolf R., Rosenberg L., Epstein E.J. Combinatorial microRNA target predictions. Nat Genet. 2005;37:495–500. doi: 10.1038/ng1536. [DOI] [PubMed] [Google Scholar]
- 83.Kiriakidou M., Nelson P.T., Kouranov A., Fitziev P., Bouyioukos C., Mourelatos Z. A combined computational–experimental approach predicts human microRNA targets. Genes Dev. 2004;18:1165–1178. doi: 10.1101/gad.1184704. [DOI] [PMC free article] [PubMed] [Google Scholar]
- 84.Wang X. MiRDB: a microRNA target prediction and functional annotation database with a wiki interface. RNA. 2008;14:1012–1017. doi: 10.1261/rna.965408. [DOI] [PMC free article] [PubMed] [Google Scholar]
- 85.Rice P., Longden I., Bleasby A. EMBOSS: the European Molecular Biology Open Software Suite. Trends Genet. 2000;16:276–277. doi: 10.1016/s0168-9525(00)02024-2. [DOI] [PubMed] [Google Scholar]
- 86.Keller A., Backes C., Al-Awadhi M., Gerasch A., Kuntzer J., Kohlbacher O. GeneTrailExpress: a web-based pipeline for the statistical evaluation of microarray experiments. BMC Bioinformatics. 2008;9:552. doi: 10.1186/1471-2105-9-552. [DOI] [PMC free article] [PubMed] [Google Scholar]
Associated Data
This section collects any data citations, data availability statements, or supplementary materials included in this article.
Supplementary Materials
The MAPK signaling pathway. This figure shows our target genes (red boxes) that are involved in the MAPK signaling pathway, which has an important role in nearly all types of cancer. These genes are found at important positions on the pathway. The figure was generated from the KEGG pathways using the enrichment protocol by GeneTrail tool.
The Axon guidance pathway. This pathway is mainly involved in cell development and stem cell maturation. Investigation of genes coding for the components of this pathway helps to understand how stem cell deregulation may affect cancer development. Predicted targets in this study are shown in red boxes.
Part of the enriched cell cycle, prostate cancer, oocyte meiosis and TGFβ pathways and some important targets in these enriched pathways. (A) Part of the cell cycle pathway. The E2F1 is regulated by miR-106 which also regulates E2F5 in coordination with miR-96. Additionally, CycE gene is a target for down-regulated miR-34a. These important targets are involved in controlling the S-phase proteins in this pathway. (B) Part of the enriched prostate cancer pathway. Different pathway phenotypes are associated with our targets like tumor suppressor gene (PTEN) [87], cell survival (BCL2), cell proliferation (TCF/LEF), G1/S progression (E2F), cell cycle progression (p21 and p27) and GFR, an important key gene regulating a long cascade leading to all of the aforementioned pathway phenotypes in addition to cell proliferation and survival. (C) The oocyte meiosis pathway with some of our predicted target genes integrated. The PPP2CA (PP2A) and CCNE2 (CycE) genes regulating meiosis II exist in the oocyte meiosis pathway. BTRC (β-TrCP) is another important gene involved in different stages of this important pathway. ITPR1 (IP3R) is the key gene that functions after fertilization and controls a long cascade of different genes. (D) Part of the TGF-beta signaling pathway. miR-106 controls smad-7 and p107, which are two important genes in this pathway controlling apoptosis and G1 arrest in cell cycle. BMPRII, ActinRII and NodalRII are three important targets which are receptor in the TGFβ signaling pathway. BMPRII regulates different genes reaching to osteoclast differentiation, neurogenesis and ventral mesoderm specification. ActinRII and NodalRII regulate gonadal growth, embryo differentiation, placenta formation, left-and right axis determination mesoderm and endoderm. Predicted targets in this study are shown in red boxes.
Targets commonly predicted by at least 4 out of 5 programs. Shown in the table are hsa-miRNAs, their level of expression in HCC and their targets predicted by at least 4 out of the 5 programs including TargetScan 5.1 [81], PicTar [82], DIANA-microT v3.0 [83], miRDB [84] and miRanda [23]. Asterisk (∗) indicates the differentially expressed genes in HCC according to the published microarray results according to [48].