

Abstract
A resource that provides candidate transcription factor binding sites (TFBSs) does not currently exist for cattle. Such data is necessary, as predicted sites may serve as excellent starting locations for future omics studies to develop transcriptional regulation hypotheses. In order to generate this resource, we employed a phylogenetic footprinting approach—using sequence conservation across cattle, human and dog—and position-specific scoring matrices to identify 379,333 putative TFBSs upstream of nearly 8000 Mammalian Gene Collection (MGC) annotated genes within the cattle genome. Comparisons of our predictions to known binding site loci within the PCK1, ACTA1 and G6PC promoter regions revealed 75% sensitivity for our method of discovery. Additionally, we intersected our predictions with known cattle SNP variants in dbSNP and on the Illumina BovineHD 770k and Bos 1 SNP chips, finding 7534, 444 and 346 overlaps, respectively. Due to our stringent filtering criteria, these results represent high quality predictions of putative TFBSs within the cattle genome. All binding site predictions are freely available at http://bfgl.anri.barc.usda.gov/BovineTFBS/ or http://199.133.54.77/BovineTFBS.
Keywords: Cattle, Transcription factor binding sites, In silico prediction
Introduction
The detection of functional transcription factor binding sites (TFBSs) remains an elusive goal in the post-genome world [1]. Much of the difficulty in TFBS discovery comes from the short length of the sequencing reads as well as their degenerate nature. Additionally, transcription factors (TFs) can often bind sequences completely dissimilar to their canonical TFBS motif and some TFBSs can be lineage-specific, thereby confounding comparative evolutionary discovery [2]. Given these difficulties, experimental discovery and annotation remains the most reliable method for TFBS discovery; however, such validation is often unavailable for individual TFs. The proliferation of genome sequencing and assembly has made possible the use of comparative genomics approaches for TFBS discovery. The reasoning behind the use of comparative genomics as a means of TFBS discovery is that conserved sequence upstream of a gene is likely to contain essential TFBSs due to selective pressures to conserve the sequence across several different species [3]. Since TFs typically bind to non-coding regions of the genome, accurate identification of their binding sites could provide important context to the recent influx of genetic variation discovery studies that often identify variants outside of coding regions.
In silico prediction methods for the detection of TFBSs can be classified by the order in which they apply sequence homology among several related species. The first method—termed the alignment-free method—uses motif detection algorithms on unaligned genomic sequence prior to comparisons of sequence homology [4]. By contrast, phylogenetic footprinting uses conserved sequence alignments across several animal species as a starting point for TFBS motif detection [4]. Both techniques are subject to unique benefits and disadvantages based on their starting approaches. In our previous study, we identified novel TFBSs upstream of the phosphoenolpyruvate carboxykinase (PEPCK or PCK1) promoter and applied a TFBS prediction algorithm to detect TFBSs upstream of all genes available in the human genome [5]. In this study, we applied a phylogenetic footprinting approach using the transcription factor binding site locator (TFLOC) algorithm initially developed to detect conserved TFBSs within multiple genome alignments for the University of California, Santa Cruz (UCSC) genome browser [6].
Implementation
TFLOC uses a position-specific scoring matrix (PSSM) algorithm to identify putative TFBSs across multiple genome alignment files through the generation of a similarity matrix score for each putative position [5]. The PSSMs that we used were derived from the JASPAR CORE, FAM and phyloFACTs databases, which contain freely available consensus TFBS scoring matrices that were experimentally determined or statistically predicted [7]. We chose the Btau4.0 reference assembly for our analysis for two reasons: (1) it is currently the most extensively-annotated cattle reference assembly and (2) simultaneous comparative alignments against other mammalian genomes already exist for Btau4.0 (downloaded from: http://hgdownload.cse.ucsc.edu/goldenPath/bosTau4/multiz5way/). We chose the 1000 bp upstream multiple alignment file (maf) for our analysis as proximal TFBSs tend to be found within 1000 bp of the transcription start site (TSS) of a gene [8]. After downloading the 1000 bp maf from the UCSC genome browser, we removed alignments from Platypus (Ornithorhynchus anatinus) and mouse (Mus musculus) due to their large sequence divergences from cattle (Bos taurus). Unfortunately, promoter sequence for similar genes could not be found within the genomes of some animals. For example, platypus and mouse only shared promoter sequence synteny with cattle 1437 times (1437/8740; 16%) and 7649 times (7649/8740; 88%), respectively, compared to 8440 times (97%) for human (Homo sapiens) and 8165 times (93%) for dog (Canis lupus familiaris). By focusing on multiple alignments containing sequences only from cattle, human and dog, we were able to investigate 7764 locations that had homology among three species as opposed to only 1335 locations if we included alignments that contained sequences from all five species.
Application
Computational TFBS prediction methods are often marred by high false positive rates (FPRs), so we initially sought to define stringent filters for the algorithm in order to focus on highly-likely TFBS motifs. Similar to Liu et al.’s approach [5], we tested the fit of raw TFLOC prediction scores for all surveyed PSSMs to a Gaussian distribution and found that 176 out of 315 of the motifs (55.9%) had significant deviations from a standard distribution. We also identified 8 different distribution types for TFLOC prediction scores, similar again to the previous report [5]. For all subsequent predictions, we considered non-Gaussian distributions of TFLOC scores by using fine-tuned filtering values for each PSSM. The final filter values were derived from an empirical test consisting of comparisons between well-characterized TFBSs identified within the PCK1, ACTA1 and G6PC promoters and TFLOC predictions. To estimate the sensitivity and specificity of our predictions, we sought to use these promoter regions with relatively high numbers of coordinate-converted TFBS positions. If we include promoter regions with fewer characterized TFBS positions, the specificity estimation could be artificially penalized due to a lack of experimental TFBS information rather than a real flaw in our algorithm. Based on 44 characterized sites upstream of the human PCK1, ACTA1 and G6PC genes that could be converted to Btau4.0 reference coordinates using the liftOver tool [9] as a standard [10–13], we measured the overlap of predictions at incremental cutoff values (Table 1). We defined sensitivity as the number of true positives divided by the number of true positives in addition to the false negatives. Specificity was defined as the percentage of predictions that overlapped known sites by at least 50%, similar to the criterion described previously [5]. A cutoff value of 0.04% was chosen for future TFBS predictions as it produced superior sensitivity and specificity while making fewer overall predictions than the higher cutoff values (Figure 1). While it is very likely that some TFBSs with in vivo activity may have been excluded due to this stringent filter, our analysis focused on putative, high percent similarity binding sites that likely have functional significance due to their conservation across species.
Table 1.
Performance of TFLOC predictions at various score thresholds.
| Threshold (×0.01%) |
MultiTF | ||||||
|---|---|---|---|---|---|---|---|
| 1 | 2 | 3 | 4 | 5 | 6 | ||
| Known sites | 44 | 44 | 44 | 44 | 44 | 44 | 44 |
| Predicted sites | 24 | 31 | 32 | 33 | 33 | 33 | 29 |
| False negatives | 20 | 13 | 12 | 11 | 11 | 11 | 15 |
| 50% Overlapping predictions | 24 | 40 | 66 | 78 | 81 | 84 | 88 |
| Total predictions | 93 | 179 | 284 | 359 | 416 | 452 | 215 |
| Sensitivity (%) | 55 | 70 | 72 | 75 | 75 | 75 | 66 |
| Specificity (%) | 25 | 22 | 23 | 22 | 20 | 19 | 41 |
Figure 1.
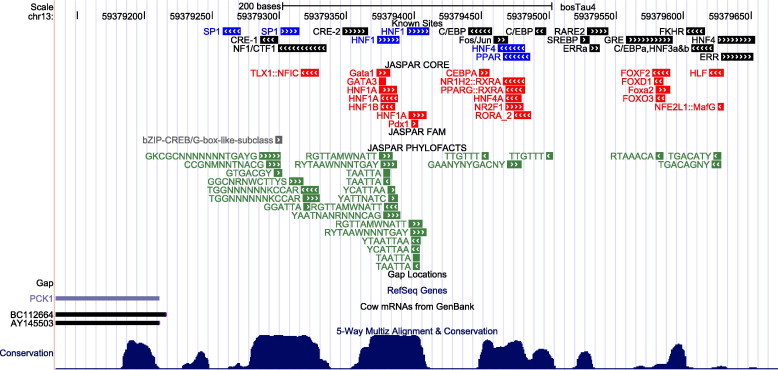
Comparison of known and predicted sites upstream of the PCK1 locus on the Btau4.0 reference assembly The chromosome position (Chr13: 59,379,179–59,379,654) is listed at the top of the diagram, with vertical gray bars serving as scale bar markers. Known PCK1 TFBSs are represented by black bars (previously identified in [11]) and blue bars (identified in [5]) in the top track. TFBS predictions made by TFLOC using a 3-way alignment of human, dog and cow are depicted in the following three tracks. Predictions from JASPAR CORE, JASPAR FAM and JASPAR PHYLOFACTS were represented by red, grey and green bars, respectively. Additional UCSC tracks include gap locations, RefSeq annotated genes, cow mRNAs mapped to the reference genome, and 5-way multiz alignment & conservation.
We also compared TFBS detection results from our method to results from another phylogenetic footprinting tool, MultiTF [14]. Using the same 1 kb upstream regions from PCK1, ACTA1 and G6PC, we aligned the sequences with the Mulan webtool (http://mulan.dcode.org/) and loaded the alignments in MultiTF for TFBS detection using the default settings. Only 29 of the 44 known TFBSs in the three genes were detected by MultiTF (66% sensitivity) compared to the 33 sites identified in our method (75% sensitivity). Both methods made a similar number of predictions within the analyzed regions (361 predictions for MultiTF and 359 for TFLOC). Therefore, differences in predicted sites may be attributed to the use of different TFBS PSSMs, as our method used the JASPAR databases [7], while MultiTF uses the TRANSFAC database [15]. Although both methods provide high degrees of sensitivity for TFBS detection in promoter regions, TFLOC was able to detect four more experimentally-validated TFBSs at the 0.04% cutoff filter than MultiTF.
Our analysis predicted 379,333 TFBSs upstream of 7764 MGC annotated loci within the Btau4.0 reference assembly. Many of the placed MGC annotations (683 loci) on Btau4.0 lacked sequence conservation in either dog or in human, so we were unable to predict TFBSs in these regions. Another portion of MGC upstream alignments (293 loci) were removed as the upstream region fell within gap or repeat regions of the Btau4.0 assembly. Despite these losses, we were able to predict TFBSs at ∼80% (7764 out of 9706) of the currently-annotated MGC loci in the Btau4.0 assembly and ∼89% (7764 out of 8740) of the MGC loci present in the maf alignment. We then checked for previously-annotated variants that might overlap with our predictions by comparing our TFBS loci with the 9 million plus SNP variant calls within the cattle genome that are present in the dbSNP variant repository (http://www.ncbi.nlm.nih.gov/projects/SNP/) [16]. Since the variants present in dbSNP have coordinates on the UMD3.1 reference assembly, we used the UCSC’s liftOver tool to convert the SNP coordinates to the Btau4.0 assembly (>98% conversion rate). We identified 7534 TFBS predictions that overlapped with variant SNP loci (Table S1). We also compared our TFBS loci with SNPs present on the Illumina BovineHD 770k and Affymetrix Bos 1 SNP chips and identified 444 and 346 intersections, respectively. Given the potential for SNP variants to cause changes within the sequences of TFBSs and theoretically impact the binding affinities of TFs, we counted the number of SNP–TFBS intersections that were within conserved nucleotides (monomorphic) of the TFBS consensus sequence (Table S1). We found a high number of SNP–TFBS intersections that changed conserved TFBS consensus sequences (5598 in dbSNP; 243 in Bos 1 and 327 in BovineHD 770k). These SNP–TFBS intersections were also identified upstream of 1887 MGC annotated genes. Several of these overlaps occurred upstream of essential genes, such as the CTCF binding site of HLA-DMA (encoding histocompatibility antigen, DM alpha chain), the NKX3_1 binding site of LYZ1 (encoding lysozyme) and the FOXF2 binding site of HSP40/DNAJB4 (encoding heat shock protein 40/DnaJ homolog, subfamily B, member 4).
Conclusion
In this study, we identified 379,333 putative transcription factor binding sites (TFBSs) within the promoter regions of 7764 annotated genes in the cattle genome. Intersections of known SNP sites from dbSNP (5598 sites), the Bos 1 array (243 sites) and the BovineHD 770k array (327 sites) with our predicted TFBSs revealed interesting overlaps. It is feasible that future GWAS, QTL mapping and whole genome sequencing studies are able to investigate our identified SNP–TFBS intersections to link variants within our TFBS predictions to phenotypes. Currently, our predictions represent high priority regions of interest for future surveys such as RNA-seq, which can tag differences of expression with animal genotypes. All TFBS predictions and SNP marker intersections are freely available at http://bfgl.anri.barc.usda.gov/BovineTFBS/ or http://199.133.54.77/BovineTFBS.
Authors’ contributions
DMB and GEL designed the procedures, carried out the experiments, wrote the draft and corrected the manuscript. Both authors read and approved the final manuscript.
Competing interests
The authors declare no competing interests.
Acknowledgements
We thank Reuben Anderson and Alexandre Dimtchev for technical assistance. GEL was supported by the National Research Institute and the Agricultural and Food Research Initiative (Grant No. 2007-35205-17869 and 2011-67015-30183) from the United States Department of Agriculture Cooperative State Research, Education and Extension Service (now the National Institute of Food and Agriculture) and Project from the US Department of Agriculture – Agricultural Research Service (ARS) (Grant No. 1265-31000-098-00). Mention of trade names or commercial products in this article is solely for the purpose of providing specific information and does not imply recommendation or endorsement by the US Department of Agriculture. The US Department of Agriculture is an equal opportunity provider and employer.
Footnotes
Peer review under responsibility of Beijing Institute of Genomics, Chinese Academy of Sciences and Genetics Society of China.

Appendix Supplementary. data
References
- 1.Collins F.S., Green E.D., Guttmacher A.E., Guyer M.S. A vision for the future of genomics research. Nature. 2003;422:835–847. doi: 10.1038/nature01626. [DOI] [PubMed] [Google Scholar]
- 2.Ponting C.P., Hardison R.C. What fraction of the human genome is functional? Genome Res. 2011;21:1769–1776. doi: 10.1101/gr.116814.110. [DOI] [PMC free article] [PubMed] [Google Scholar]
- 3.Fuellen G., Struckmann S. Evolution of gene regulation of pluripotency – the case for wiki tracks at genome browsers. Biol Direct. 2010;5:67. doi: 10.1186/1745-6150-5-67. [DOI] [PMC free article] [PubMed] [Google Scholar]
- 4.Struckmann S., Esch D., Scholer H., Fuellen G. Visualization and exploration of conserved regulatory modules using ReXSpecies 2. BMC Evol Biol. 2011;11:267. doi: 10.1186/1471-2148-11-267. [DOI] [PMC free article] [PubMed] [Google Scholar]
- 5.Liu G.E., Weirauch M.T., Van Tassell C.P., Li R.W., Sonstegard T.S., Matukumalli L.K. Identification of conserved regulatory elements in mammalian promoter regions: a case study using the PCK1 promoter. Genomics Proteomics Bioinformatics. 2008;6:129–143. doi: 10.1016/S1672-0229(09)60001-2. [DOI] [PMC free article] [PubMed] [Google Scholar]
- 6.Hinrichs A.S., Karolchik D., Baertsch R., Barber G.P., Bejerano G., Clawson H. The UCSC genome browser database: update 2006. Nucleic Acids Res. 2006;34:D590–D598. doi: 10.1093/nar/gkj144. [DOI] [PMC free article] [PubMed] [Google Scholar]
- 7.Portales-Casamar E., Thongjuea S., Kwon A.T., Arenillas D., Zhao X.B., Valen E. JASPAR 2010: the greatly expanded open-access database of transcription factor binding profiles. Nucleic Acids Res. 2010;38:D105–D110. doi: 10.1093/nar/gkp950. [DOI] [PMC free article] [PubMed] [Google Scholar]
- 8.Blanchette M., Bataille A.R., Chen X., Poitras C., Laganiere J., Lefebvre C. Genome-wide computational prediction of transcriptional regulatory modules reveals new insights into human gene expression. Genome Res. 2006;16:656–668. doi: 10.1101/gr.4866006. [DOI] [PMC free article] [PubMed] [Google Scholar]
- 9.Kent W.J., Sugnet C.W., Furey T.S., Roskin K.M., Pringle T.H., Zahler A.M. The human genome browser at UCSC. Genome Res. 2002;12:996–1006. doi: 10.1101/gr.229102. [DOI] [PMC free article] [PubMed] [Google Scholar]
- 10.Ayala J.E., Streeper R.S., Desgrosellier J.S., Durham S.K., Suwanichkul A., Svitek C.A. Conservation of an insulin response unit between mouse and human glucose-6-phosphatase catalytic subunit gene promoters – transcription factor FKHR binds the insulin response sequence. Diabetes. 1999;48:1885–1889. doi: 10.2337/diabetes.48.9.1885. [DOI] [PubMed] [Google Scholar]
- 11.Chakravarty K., Cassuto H., Reshef L., Hanson R.W. Factors that control the tissue-specific transcription of the gene for phosphoenolpyruvate carboxykinase-C. Crit Rev Biochem Mol Biol. 2005;40:129–154. doi: 10.1080/10409230590935479. [DOI] [PubMed] [Google Scholar]
- 12.Montgomery S.B., Griffith O.L., Schuetz J.M., Brooks-Wilson A., Jones S.J.M. A survey of genomic properties for the detection of regulatory polymorphisms. PLoS Comput Biol. 2007;3:e106. doi: 10.1371/journal.pcbi.0030106. [DOI] [PMC free article] [PubMed] [Google Scholar]
- 13.Wasserman W.W., Krivan W. In silico identification of metazoan transcriptional regulatory regions. Naturwissenschaften. 2003;90:156–166. doi: 10.1007/s00114-003-0409-4. [DOI] [PubMed] [Google Scholar]
- 14.Loots G.G., Ovcharenko I. Dcode.org anthology of comparative genomic tools. Nucleic Acids Res. 2005;33:W56–W64. doi: 10.1093/nar/gki355. [DOI] [PMC free article] [PubMed] [Google Scholar]
- 15.Matys V., Fricke E., Geffers R., Gossling E., Haubrock M., Hehl R. TRANSFAC: transcriptional regulation, from patterns to profiles. Nucleic Acids Res. 2003;31:374–378. doi: 10.1093/nar/gkg108. [DOI] [PMC free article] [PubMed] [Google Scholar]
- 16.Smigielski E.M., Sirotkin K., Ward M., Sherry S.T. DbSNP: a database of single nucleotide polymorphisms. Nucleic Acids Res. 2000;28:352–355. doi: 10.1093/nar/28.1.352. [DOI] [PMC free article] [PubMed] [Google Scholar]
Associated Data
This section collects any data citations, data availability statements, or supplementary materials included in this article.