

Abstract
The ENCyclopedia Of DNA Elements (ENCODE) project is an international research consortium that aims to identify all functional elements in the human genome sequence. The second phase of the project comprised 1640 datasets from 147 different cell types, yielding a set of 30 publications across several journals. These data revealed that 80.4% of the human genome displays some functionality in at least one cell type. Many of these regulatory elements are physically associated with one another and further form a network or three-dimensional conformation to affect gene expression. These elements are also related to sequence variants associated with diseases or traits. All these findings provide us new insights into the organization and regulation of genes and genome, and serve as an expansive resource for understanding human health and disease.
Keywords: ENCODE project, Chromatin structure, Transcription factors, DNA methylation
Introduction
The Encyclopedia of DNA Elements (ENCODE) Consortium is an international collaboration of research groups funded by the National Human Genome Institute (NHGRI). It aims to pick up where the Human Genome Project left off, including the ‘functional’ DNA sequences that act at the protein and RNA levels, and regulatory elements that control gene expression in which cells and when [1]. The first pilot phase, started in 2003, accrued such information on just 1% of the genome and determined which experimental techniques were likely to work best on the whole genome. Researchers found that many important regulators of gene expression lie somewhere in the ‘deserts’ between the genes and many of them have evolved rapidly [2]. After the initial pilot phase, scientists started a second round of technology development phase to apply their methods to the entire genome in 2007 and closed successfully in September 2012 with the promotion of several new technologies to generate high throughput data on functional elements, signaled by the publication of 30 papers in Nature (5 papers), Genome Research (18 papers), Genome Biology (6 papers) and BMC Genetics (1 paper). The productions of 1640 datasets focusing on 24 standard types of experiment within 147 different cell types reveal that 80.4% of the human genome displays some functionality in at least one cell type. ENCODE interpreted important features about the organization and function of human genome from the perspective of annotation of coding and noncoding regions, chromatin accessibility, transcription factor binding, DNA methylation and interactions between parts of genome in three-dimensional space (Table 1). The ENCODE data were also integrated with single nucleotide polymorphisms (SNPs) identified by genome-wide association studies (GWAS) to attack much more complex diseases.
Table 1.
Summary of ENCODE experiments
| Experiment | Description |
|---|---|
| DNA methylation | In 82 human cell lines and tissues: A549, Adrenal gland, AG04449, AG04450, AG09309, AG09319, AG10803, AoSMC, BE2 C, BJ, Brain, Breast, Caco-2, CMK, ECC-1, Fibrobl, GM06990, GM12878, GM12891, GM12892, GM19239, GM19240, H1-hESC, HAEpiC, HCF, HCM, HCPEpiC, HCT-116, HEEpiC, HEK293, HeLa-S3, Hepatocytes, HepG2, HIPEpiC, HL-60, HMEC, HNPCEpiC, HPAEpiC, HRCEpiC, HRE, HRPEpiC, HSMM, HTR8svn, IMR90, Jurkat, K562, Kidney, Left Ventricle, Leukocyte, Liver, LNCaP, Lung, MCF-7, Melano, Myometr, NB4, NH-A, NHBE, NHDF-neo, NT2-D1, Osteoblasts, Ovcar-3, PANC-1, Pancreas, PanIslets, Pericardium, PFSK-1, Placenta, PrEC, ProgFib, RPTEC, SAEC, Skeletal muscle, Skin, SkMC, SK-N-MC, SK-N-SH, Stomach, T-47D, Testis, U87, UCH-1 and Uterus |
| TF ChIP-seq | A total of 119 TFs: ATF3, BATF, BCLAF1, BCL3, BCL11A, BDP1, BHLHE40, BRCA1, BRF1, BRF2, CCNT2, CEBPB, CHD2, CTBP2, CTCF, CTCFL, EBF1, EGR1, ELF1, ELK4, EP300, ESRRA, ESR1, ETS1, E2F1, E2F4, E2F6, FOS, FOSL1, FOSL2, FOXA1, FOXA2, GABPA, GATA1, GATA2, GATA3, GTF2B, GTF2F1, GTF3C2, HDAC2, HDAC8, HMGN3, HNF4A, HNF4G, HSF1, IRF1, IRF3, IRF4, JUN, JUNB, JUND, MAFF, MAFK, MAX, MEF2A, MEF2C, MXI1, MYC, NANOG, NFE2, NFKB1, NFYA, NFYB, NRF1, NR2C2, NR3C1, PAX5, PBX3, POLR2A, POLR3A, POLR3G, POU2F2, POU5F1, PPARGC1A, PRDM1, RAD21, RDBP, REST, RFX5, RXRA, SETDB1, SIN3A, SIRT6, SIX5, SMARCA4, SMARCB1, SMARCC1, SMARCC2, SMC3, SPI1, SP1, SP2, SREBF1, SRF, STAT1, STAT2, STAT3, SUZ12, TAF1, TAF7, TAL1, TBP, TCF7L2, TCF12, TFAP2A, TFAP2C, THAP1, TRIM28, USF1, USF2, WRNIP1, YY1, ZBTB7A, ZBTB33, ZEB1, ZNF143, ZNF263, ZNF274 and ZZZ3 |
| Histone ChIP-seq | A total of 12 types: H2A.Z, H3K4me1, H3K4me2, H3K4me3, H3K9ac, H3K9me1, H3K9me3, H3K27ac, H3K27me3, H3K36me3, H3K79me2 and H4K20me1 |
| DNase-seq | In 125 cell types or treatments: 8988T, A549, AG04449, AG04450, AG09309, AG09319, AG10803, AoAF, AoSMC/serum_free_media, BE2_C, BJ, Caco-2, CD20, CD34, Chorion, CLL, CMK, Fibrobl, FibroP, Gliobla, GM06990, GM12864, GM12865, GM12878, GM12891, GM12892, GM18507, GM19238, GM19239, GM19240, H7-hESC, H9ES, HAc, HAEpiC, HA-h, HA-sp, HBMEC, HCF, HCFaa, HCM, HConF, HCPEpiC, HCT-116, HEEpiC, HeLa-S3, HeLa-S3_IFNa4h, Hepatocytes, HepG2, HESC, HFF, HFF-Myc, HGF, HIPEpiC, HL-60, HMEC, HMF, HMVEC-dAd, HMVEC-dBl-Ad, HMVEC-dBl-Neo, HMVEC-dLy-Ad, HMVEC-dLy-Neo, HMVEC-dNeo, HMVEC-LBl, HMVEC-LLy, HNPCEpiC, HPAEC, HPAF, HPDE6-E6E7, HPdLF, HPF, HRCEpiC, HRE, HRGEC, HRPEpiC, HSMM, HSMMemb, HSMMtube, HTR8svn, Huh-7, Huh-7.5, HUVEC, HVMF, iPS, Ishikawa_Estr, Ishikawa_Tamox, Jurkat, K562, LNCaP, LNCaP_Andr, MCF-7, MCF-7_Hypox, Medullo, Melano, MonocytesCD14+, Myometr, NB4, NH-A, NHDF-Ad, NHDF-neo, NHEK, NHLF, NT2-D1, Osteobl, PANC-1, PanIsletD, PanIslets, pHTE, PrEC, ProgFib, PrEC, RPTEC, RWPE1, SAEC, SKMC, SK-N-MC, SK-N-SH_RA, Stellate, T-47D, Th0, Th1, Th2, Urothelia, Urothelia_UT189, WERI-Rb-1, WI-38 and WI-38_Tamox |
| DNase footprint | In 41 cell types: AG10803, AoAF, CD20+, CD34+ Mobilized, fBrain, fHeart, fLung, GM06990, GM12865, HAEpiC, HA-h, HCF, HCM, HCPEpiC, HEEpiC, HepG2, H7-hESC, HFF, HIPEpiC, HMF, HMVEC-dBl-Ad, HMVEC-dBl-Neo, HMVEC-dLy-Neo, HMVEC-LLy, HPAF, HPdLF, HPF, HRCEpiC, HSMM, Th1, HVMF, IMR90, K562, NB4, NH-A, NHDF-Ad, NHDF-neo, NHLF, SAEC, SkMC and SK-N-SH RA |
| MNase-seq | In GM12878 and K562 |
| 3C-carbon copy (5C) | In GM12878, K562, HeLa-S3 and H1-hESC |
| GWAS SNP targeting | 296 noncoding GWAS SNPs were assigned a target promoter |
Human genome reference re-annotation
A correctly- annotated gene reference for a particular project is extremely important for any downstream analysis such as conservation, variation and functionality of a sequence. As a sub-project of the ENCODE project, the GENCODE consortium aims to annotate all evidence-based gene features, including all protein-coding loci with alternatively transcribed variants, non-coding loci with transcript evidence and pseudogenes, in the entire human genome at a high accuracy using a combination of computational analysis, manual annotation, and experimental validation. The GENCODE 7 release contained 20,687 protein-coding genes and 33,977 noncoding transcripts that were not represented in UCSC genes and RefSeq. Among them, 62% of protein-coding genes have annotated polyA sites and 35% of transcripts are supported by combinatorial analysis of gene-cluster evolution (CAGE) cluster at the transcriptional start sites (TSSs) (Table 2) [3]. In addition, GENCODE 7 contains 9640 long non-coding RNA (lncRNA) genes, representing 15,512 transcripts, consisting of 5058 long intergenic ncRNA (lincRNA) loci, 3214 antisense loci, 378 sense intronic loci and 930 processed transcript loci, which is the largest manually-curated catalog of human lncRNAs currently publicly available (Table 2) [3]. GENCODE also annotated 11,216 pseudogenes, of which 863 were transcribed and associated with active chromatin (Table 2) [4]. Compared with non-transcribed pseudogenes, transcribed pseudogenes showed higher conservation, much more upstream regulatory sequences and stronger tissue specificity, indicating that transcribed pseudogenes possess conventional characteristics of functionality [4].
Table 2.
Summary of GENCODE v7 gene annotation
| Category | Number |
|---|---|
| Protein-coding genes | 20,687 |
| Novel noncoding transcripts | 33,977 |
| Long non-coding RNA loci | 9640 |
| Linc RNA loci | 5058 |
| Antisense loci | 3214 |
| Sense intronic loci | 378 |
| Pseudogenes | 11,216 |
| Transcribed | 863 |
| Non-transcribed | 10,353 |
Landscape of transcription
ENCODE provided a genome-wide catalogue of human transcripts and identified their subcellular localization by sequencing RNA from 15 cell lines in three subcellular fractions (whole cell, nucleus and cytosol) and in three additional subnuclear compartments (chromatin, nucleolus, and nucleoplasm) in K562 cell [5]. Cumulatively, a total of 62.1% and 74.7% of the human genome were observed to be covered by either processed or primary transcripts, respectively. Coding and non-coding transcripts are predominantly localized in the cytosol and nucleus, respectively, with higher expression of protein-coding genes on average than that of non-coding RNAs. Approximately 6% of all annotated coding and non-coding transcripts overlap with small RNAs (sRNAs) and are probably precursors of these sRNAs. Furthermore, the analysis of RNA from subcellular fractions obtained through RNA-seq in the cell line K562 revealed that splicing occurs predominantly during transcription and is fully completed in cytosolic polyA+ RNA [6]. In addition, lncRNAs curated manually by GENCODE have canonical gene structures and histone modifications, are expressed at lower levels, appear to be subjected to weaker evolutionary constraint than coding genes and are preferentially enriched in nucleus of the cell [7]. Meta-analysis of 737 mouse and human sRNA datasets yielded 237 and 240 splicing-derived microRNAs (miRNAs) in mouse and human, respectively. These miRNAs comprised three classes: conventional mirtrons, 5′-tailed mirtrons and 3′-tailed mirtrons. Some members in each class are conserved, indicating their incorporation into beneficial regulatory networks [8].
DNA methylation
Methylation of cytosine at CpG dinucleotides is an important epigenetic regulatory modification in many eukaryotic genomes. Using high-throughput reduced representation bisulfite sequencing (RRBS), Meissner et al. generated methylation maps covering most CpG islands in mouse embryonic stem cells, embryonic-stem-cell-derived neural cells, primary neural cells and eight other primary tissues [9]. CpGs located in open chromatin regions are generally lowly methylated, whereas hypermethylated regions are marked by H3K9me3. Moreover, changes in DNA methylation patterns during ES cells differentiation were strongly correlated with those in histone methylation patterns. In human B-lymphocytes, a DNA methylation map was generated through two methods, bisulfite padlock probe (BSPP) assay and methyl-sensitive cut counting (MSCC) assay. DNA methylation was found to be located genome-wise with a pattern of low promoter methylation and high gene-body methylation in highly-expressed genes [10]. Moreover, the DNA methylation landscapes were profiled quantitatively in total of 82 human cell lines and tissues using RRBS, yielding 1.2 million CpGs on average in each cell type [11]. In pulmonary fibroblasts (IMR90), significantly low methylation was detected at CpG dinucleotides within DNase I footprints, compared to CpGs in non-footprinted regions of the same DNase I hypersensitive site (DHS). These data suggest that occupancy of regulatory factors may be widely connected with methylation at nucleotide levels [12].
Local chromatin structure
The hallmark of regulatory DNA regions is chromatin accessibility, which is characterized by DNase I hypersensitivity. Stamatoyannopoulos and his collaborators mapped 2.89 million unique non-overlapping DHSs by DNase-seq in 125 cell types. About one third of them were found in only one cell type, with only 3700 detected in all cell types, suggesting that the genome is differentially regulated from cell to cell [13]. Majority (approximately 75%) of the DHSs identified by ENCODE were located in distal intronic or intergenic regions, indicating that the previously-considered ‘junk’ sequences are functional somehow. Furthermore, higher DNase I hypersensitivity and CG content were enriched in TSSs, of which chromatin state was largely invariant across multiple cell lines as demonstrated using DNase-seq across 19 cell types in a genome-wide fashion [14]. A set of putative distal regulatory elements, up to 500 kb distant from promoters, were generated based on the correlations between distal DHSs and promoters [13].
Nucleosomes are located in the flanking regions of open chromatin where DHSs are enriched and post-translational modification of the histone tails occurs at the core of nucleosomes. The nucleosome occupancy in GM12878 and K562 cells that was mapped by MNase-seq was highly heterogeneous and asymmetry at TSSs and showed a weak correlation with transcriptional activity [15]. Histone modification is another regulatory factor that affects the chromatin conformation. Early studies on individual modifications have shown that they function in both activation and repression of transcription. ENCODE examined chromosomal locations for up to 12 histone modifications and variants in 46 cell types. Taking advantage of the wealth of datasets from ENCODE, Dong et al. established a novel quantitative model to evaluate the relationship between chromatin features (including 11 histone modifications, one histone variant and DNase I hypersensitivity) and expression levels. Using this model, they predicted expression status and expression levels with high accuracy by employing different groups of chromatin features [16].
Transcription factor binding sites
Transcription factors (TFs) regulate gene transcription by binding to specific DNA elements such as promoters, enhancers, silencers, insulators and locus control regions. To predict and identify TF binding sites throughout genomes is essential for understanding gene regulation [17]. So far, ENCODE has sampled 119 of 1800 known TFs in a limited number of cell types. Predicted TF binding sites on human promoters from ChIP-seq data in conjunction with position weight matrix (PWM) searches of known motifs were mutated to assess their function using luciferase reporter assays in four different immortalized human cell lines. Overall, 70% of the binding sites functionally contributed to promoter activity. These binding sites were more conserved and located closer to TSSs than those whose function was not experimentally verified [18]. Three pairs of genomic regions were categorized according to the binding patterns of 117 TFs in five cell lines: active and inactive binding regions, promoter-proximal and gene-distal regulatory modules, and high and low occupancy of transcription-related factors. Intricate differences were revealed in these regions in terms of chromosomal locations, chromatin features, binding factors and cell-type specificity. 13,539 potential enhancers were further identified from the distal regulatory modules, many of which were validated experimentally [19]. Furthermore, based on their contribution to the regulation of gene expression, TFs were roughly classified into six different categories, including sequence-specific TFs, general or nonspecific TFs, chromatin structure factors, chromatin remodeling factors, histone methyltransferases and Pol3-associated factors [20]. Binding of different categories of TF varied substantially in their contributions to predicting gene expression; sequence-specific TFs were significantly more predictive than proteins in other groups, whereas Pol3-associated factors were significantly less predictive [20].
Many eukaryotic genes are coregulated by multiple TFs in a cell-type specific manner [21]. Two scenarios could occur in site-specific TF partners: two TFs bind to neighboring sites (cobinding) or one TF binds to another TF, which then binds to DNA (tethered binding). An integrative analysis of 457 ChIP-seq datasets on 119 human TFs identified 151 potential tethered binding pairs and 104 cobinding sequence-specific TF pairs. Among them, 27 cobinding pairs had physical interactions and 18 of 151 tethered binding pairs were validated by the mammalian two-hybrid data [22]. TCF7L2, a TF linked to a variety of human diseases such as type 2 diabetes and cancer, repressed transcription when tethered to the genome via GATA3 in MCF7 cells [23]. The ensemble of TF binding in a combinatorial fashion forms a regulatory network to specify the on-and-off states of genes and constitutes the writing diagram for a cell. Multiple expectation maximization (EM) for motif elicitation (MEME) analysis identified three significantly-enriched DNA sequence motifs (HSF1, ESRRA and CEBPB) at PPARGIA-occupied sites in human HepG2 cells. The binding relationships among these three motifs, PPARGC1A, and three additional known co-regulators (HNF4A, NR3C1 and NRF2) formed a highly connected network, suggesting complex patterns of interdependent regulation [24]. In summary, in addition to discovering many novel networks, highly cell-type-specific regulatory networks that recapitulated many known regulatory sub-networks were also revealed by co-association networks of TFs [25].
Integration of genomic parts
Gene regulation at functional elements is governed by interplay of nucleosome remodeling, histone modifications and TF binding (Figure 1). Binding of TFs to regulatory DNA regions in place of canonical nucleosomes triggers chromatin remodeling. Such binding and remodeling lead to nuclease hypersensitivity, which forms an open chromatin environment and in turn facilitates the interplay of functional elements. Therefore, integrating analyses of these functional elements can interpret the gene regulation more accurately.
Figure 1.
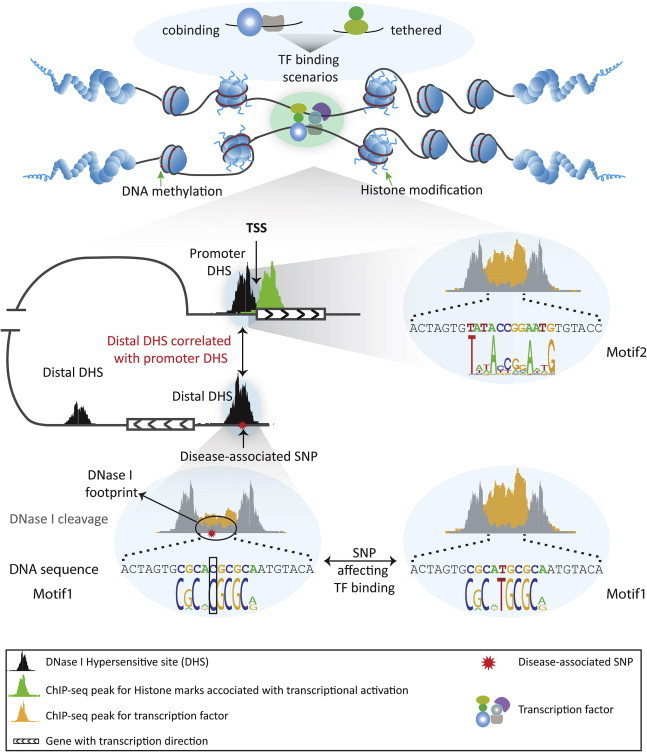
Multi-dimensional regulation of gene expression The transcriptional regulation is controlled by complicated interactions between regulatory elements. Hypermethylated CpGs are located in close chromatin regions, whereas CpGs located in open regions are generally lowly methylated, where DHSs and histone modifications associated with transcriptional activity are enriched. Within DHSs, DNase I cleavage leaves footprints where TFs bind to protect the DNA from cleavage by DNase I. SNP occurring at the TF recognition sequence (motif) will affect TF binding occupancy. Furthermore, distal DHSs harboring disease-associated SNPs can be brought into proximity with a promoter to incorporate TF binding complex to affect gene function through long range chromosomal interaction. Multiple TFs interact to DNA by two scenarios: TFs bind to neighboring sites (cobinding), and one TF binds to another that binds to DNA (tethered binding).
Binding of regulatory factors to genomic DNA protects the underlying sequences from cleavage by DNase I, thus leaving nucleotide-resolution ‘footprints’ [12]. A striking enrichment of motifs, including known motifs and hundreds of novel evolutionarily-conserved motifs, was detected within footprints in 41 cell types examined. Many of the motifs in footprints display highly cell type selective occupancy patterns that are similar to major developmental and tissue-specific regulators [12]. Highly stereotyped, asymmetrical pattern of DNase I hypersensitivity and H3K4me3 modification was invariant across cell types at the TSSs, and was used to predict 44,853 putative novel promoters [12].
Both TF binding and histone modification are predictive of gene expression levels [26]. They are highly enriched at the TSS regions and can be predicted accurately by each other [20]. It is well known that transcription has a profound impact on nucleosome occupancy. ENCODE data indicated that TF binding sites were detected in GC-rich, nucleosome-depleted and DNase I sensitive regions, which were flanked by well-positioned nucleosomes. Interestingly, many of these features exhibit cell type specificity. These results from TF-centered analyses were deposited and visualized in a web-accessible tool called Factorbook (http://factorbook.org) [22].
Furthermore, the regulatory interactions between TFs and miRNAs constitute an additional layer of information to investigate the gene regulation of complexity. Correlating co-associations of 119 TFs with miRNAs from ENCODE, Gerstein et al. found that highly-connected TFs tend to regulate more miRNAs and to be more regulated by miRNAs as well [25]. Moreover, correlation between occupancy of CTCF, a ubiquitously expressed polyfunctional regulator in gene expression, and DNA methylation was detected using ChIP-seq and RRBS data sequenced in multiple cell lines including normal primary cells and immortal lines. DNA methylation occurring at two critical positions within the CTCF recognition sequence represses CTCF binding. Unexpectedly, CTCF binding patterns in normal cells were remarkably different from those in immortal cells. In immortal cells, a widespread disruption of CTCF binding was noticed, which was associated with increased methylation [27].
Three-dimensional space interaction
The spatial organization of chromosomes brings genes and their regulatory elements, which may be dispersed over many hundreds of kilobases, in close proximity to facilitate their communication and further regulate gene expression [28]. These long-range interactions between genomic elements can be detected using chromosome conformation capture (3C)-based methods [29]. Using a 3C-carbon copy (5C) approach, ENCODE comprehensively interrogated interactions between TSSs and distal elements in 1% of the human genome, representing 44 ENCODE pilot regions in three cell types (GM12878, K562 and HeLa-S3) [30]. More than 1000 long-range interactions were generated in each cell line from 628 TSS-containing restriction fragments and 4535 distal restriction fragments. Among them, ∼60% were observed in only one of the three cell lines, indicating intricate cell-type-specific three-dimensional folding of chromatin. Constitutive looping interactions were significantly enriched for distal fragments that are bound by CTCF, contain open chromatin and/or contain histones with active modifications. Enhancers that loop to TSSs are significantly more likely to express enhancer RNAs than enhancers that do not. Long-range interactions displayed marked asymmetry with elements located around 120 kb upstream of the TSS, revealing an unanticipated directionality in long-range interactions with TSS. However, an overwhelming number of interactions (∼93%) do not occur between elements and the nearest TSS. Finally, promoters and distal elements are engaged in multiple long-range interactions to form complex networks with cell-to-cell variation. These insights will be critical for interpreting the regulations of regulatory elements with their distally located target genes.
Integration with disease-associated variation
Although GWAS studies have generated a large number (approximately 10,000 as of April, 2013) of SNPs that were associated with phenotypes, they do not offer any direct evidence about the biological processes that link the associated variant to the phenotype. Moreover, 88% of those variants from GWAS studies fall outside of coding regions and have been difficult to interpret [31]. Integrating functional elements generated by ENCODE, expression quantitative trait loci (eQTL) information and disease-associated SNPs from GWAS studies, Schaub et al. proposed a systemic approach to identify a functional SNP for up to 80% of previously-reported GWAS associations [32]. They further developed a novel database, RegulomeDB, to guide interpretation of regulatory variants in the human genome by integrating a large collection of regulatory information [33]. Maurano et al. demonstrated that 77% (3930) of the disease or trait-associated SNPs lie within DHSs or are in complete linkage disequilibrium (LD) with SNPs in a nearby DHS, and 296 of them were assigned a target promoter [34]. Disease-associated SNPs can directly affect TF binding. Ni et al. identified dozens of novel SNPs that affect TF binding de novo and accurately from ChIP-seq data generated in the ENCODE project, which enabled us to examine allele-specific TF binding in any cell type with ChIP-seq data available even without pre-existing genotype data from the HapMap project and the 1000 Genomes Project [35]. These efforts demonstrate which variants have potential or demonstrated regulatory functions and through which mechanisms those functions might work.
Conclusion
The transcriptional regulation is controlled by complex interactions between the DNA sequence and transcription factors, as well as nucleosomes, histone tail modifications and DNA methylation. Such interactions work complexly and dynamically across different types of cells. ENCODE has provided us an unprecedented number of functional elements as well as many novel aspects of gene expression and regulation, which significantly enhances our understanding of the human genome and human health and disease. However, some of the mapping efforts are about halfway to completion, not to mention that deeper characterization of everything the genome does is probably only 10% finished [1]. A third phase is getting under way now and will fill in many of the blanks of human genome by adding additional factors, modifications and cell types [1]. Although current assays can be expanded to capture more TFs in more cell lines, they provide only a single snapshot of cellular regulatory events without capturing the dynamic aspects of gene regulation. The development of new technologies to capture multiple data types, along with their regulatory dynamics in single cell, would help to tackle these issues. Identifying how genomic ingredients are combined to carry out complicated functions and interpreting the huge data to understand the range of human phenotypes from normal developmental processes are future greater challenges.
Competing interests
The authors declare no competing interests.
Acknowledgements
This work is supported by grants from the Strategic Priority Research Program of Chinese Academy of Sciences on Stem Cell and Regenerative Medicine Research (Grant No. XDA01040405) and National High Technology Research and Development Program of China (863 Program, Grant No. 2012AA022502) to XF.
Footnotes
Peer review under responsibility of Beijing Institute of Genomics, Chinese Academy of Sciences and Genetics Society of China.

References
- 1.Maher B. ENCODE: the human encyclopaedia. Nature. 2012;489:46–48. doi: 10.1038/489046a. [DOI] [PubMed] [Google Scholar]
- 2.Consortium E.P., Birney E., Stamatoyannopoulos J.A., Dutta A., Guigo R., Gingeras T.R. Identification and analysis of functional elements in 1% of the human genome by the ENCODE pilot project. Nature. 2007;447:799–816. doi: 10.1038/nature05874. [DOI] [PMC free article] [PubMed] [Google Scholar]
- 3.Harrow J., Frankish A., Gonzalez J.M., Tapanari E., Diekhans M., Kokocinski F. GENCODE: the reference human genome annotation for the ENCODE project. Genome Res. 2012;22:1760–1774. doi: 10.1101/gr.135350.111. [DOI] [PMC free article] [PubMed] [Google Scholar]
- 4.Pei B., Sisu C., Frankish A., Howald C., Habegger L., Mu X.J. The GENCODE pseudogene resource. Genome Biol. 2012;13:R51. doi: 10.1186/gb-2012-13-9-r51. [DOI] [PMC free article] [PubMed] [Google Scholar]
- 5.Djebali S., Davis C.A., Merkel A., Dobin A., Lassmann T., Mortazavi A. Landscape of transcription in human cells. Nature. 2012;489:101–108. doi: 10.1038/nature11233. [DOI] [PMC free article] [PubMed] [Google Scholar]
- 6.Tilgner H., Knowles D.G., Johnson R., Davis C.A., Chakrabortty S., Djebali S. Deep sequencing of subcellular RNA fractions shows splicing to be predominantly co-transcriptional in the human genome but inefficient for lncRNAs. Genome Res. 2012;22:1616–1625. doi: 10.1101/gr.134445.111. [DOI] [PMC free article] [PubMed] [Google Scholar]
- 7.Derrien T., Johnson R., Bussotti G., Tanzer A., Djebali S., Tilgner H. The GENCODE v7 catalog of human long noncoding RNAs: analysis of their gene structure, evolution, and expression. Genome Res. 2012;22:1775–1789. doi: 10.1101/gr.132159.111. [DOI] [PMC free article] [PubMed] [Google Scholar]
- 8.Ladewig E., Okamura K., Flynt A.S., Westholm J.O., Lai E.C. Discovery of hundreds of mirtrons in mouse and human small RNA data. Genome Res. 2012;22:1634–1645. doi: 10.1101/gr.133553.111. [DOI] [PMC free article] [PubMed] [Google Scholar]
- 9.Meissner A., Mikkelsen T.S., Gu H., Wernig M., Hanna J., Sivachenko A. Genome-scale DNA methylation maps of pluripotent and differentiated cells. Nature. 2008;454:766–770. doi: 10.1038/nature07107. [DOI] [PMC free article] [PubMed] [Google Scholar]
- 10.Ball M.P., Li J.B., Gao Y., Lee J.H., LeProust E.M., Park I.H. Targeted and genome-scale strategies reveal gene-body methylation signatures in human cells. Nat Biotechnol. 2009;27:361–368. doi: 10.1038/nbt.1533. [DOI] [PMC free article] [PubMed] [Google Scholar]
- 11.Consortium E.P., Dunham I., Kundaje A., Aldred S.F., Collins P.J., Davis C.A. An integrated encyclopedia of DNA elements in the human genome. Nature. 2012;489:57–74. doi: 10.1038/nature11247. [DOI] [PMC free article] [PubMed] [Google Scholar]
- 12.Neph S., Vierstra J., Stergachis A.B., Reynolds A.P., Haugen E., Vernot B. An expansive human regulatory lexicon encoded in transcription factor footprints. Nature. 2012;489:83–90. doi: 10.1038/nature11212. [DOI] [PMC free article] [PubMed] [Google Scholar]
- 13.Thurman R.E., Rynes E., Humbert R., Vierstra J., Maurano M.T., Haugen E. The accessible chromatin landscape of the human genome. Nature. 2012;489:75–82. doi: 10.1038/nature11232. [DOI] [PMC free article] [PubMed] [Google Scholar]
- 14.Natarajan A., Yardimci G.G., Sheffield N.C., Crawford G.E., Ohler U. Predicting cell-type-specific gene expression from regions of open chromatin. Genome Res. 2012;22:1711–1722. doi: 10.1101/gr.135129.111. [DOI] [PMC free article] [PubMed] [Google Scholar]
- 15.Kundaje A., Kyriazopoulou-Panagiotopoulou S., Libbrecht M., Smith C.L., Raha D., Winters E.E. Ubiquitous heterogeneity and asymmetry of the chromatin environment at regulatory elements. Genome Res. 2012;22:1735–1747. doi: 10.1101/gr.136366.111. [DOI] [PMC free article] [PubMed] [Google Scholar]
- 16.Dong X., Greven M.C., Kundaje A., Djebali S., Brown J.B., Cheng C. Modeling gene expression using chromatin features in various cellular contexts. Genome Biol. 2012;13:R53. doi: 10.1186/gb-2012-13-9-r53. [DOI] [PMC free article] [PubMed] [Google Scholar]
- 17.Hannenhalli S. Eukaryotic transcription factor binding sites–modeling and integrative search methods. Bioinformatics. 2008;24:1325–1331. doi: 10.1093/bioinformatics/btn198. [DOI] [PubMed] [Google Scholar]
- 18.Whitfield T.W., Wang J., Collins P.J., Partridge E.C., Aldred S.F., Trinklein N.D. Functional analysis of transcription factor binding sites in human promoters. Genome Biol. 2012;13:R50. doi: 10.1186/gb-2012-13-9-r50. [DOI] [PMC free article] [PubMed] [Google Scholar]
- 19.Yip K.Y., Cheng C., Bhardwaj N., Brown J.B., Leng J., Kundaje A. Classification of human genomic regions based on experimentally determined binding sites of more than 100 transcription-related factors. Genome Biol. 2012;13:R48. doi: 10.1186/gb-2012-13-9-r48. [DOI] [PMC free article] [PubMed] [Google Scholar]
- 20.Cheng C., Alexander R., Min R., Leng J., Yip K.Y., Rozowsky J. Understanding transcriptional regulation by integrative analysis of transcription factor binding data. Genome Res. 2012;22:1658–1667. doi: 10.1101/gr.136838.111. [DOI] [PMC free article] [PubMed] [Google Scholar]
- 21.Maston G.A., Evans S.K., Green M.R. Transcriptional regulatory elements in the human genome. Annu Rev Genomics Hum Genet. 2006:29–59. doi: 10.1146/annurev.genom.7.080505.115623. [DOI] [PubMed] [Google Scholar]
- 22.Wang J., Zhuang J., Iyer S., Lin X., Whitfield T.W., Greven M.C. Sequence features and chromatin structure around the genomic regions bound by 119 human transcription factors. Genome Res. 2012;22:1798–1812. doi: 10.1101/gr.139105.112. [DOI] [PMC free article] [PubMed] [Google Scholar]
- 23.Frietze S., Wang R., Yao L., Tak Y.G., Ye Z., Gaddis M. Cell type-specific binding patterns reveal that TCF7L2 can be tethered to the genome by association with GATA3. Genome Biol. 2012;13:R52. doi: 10.1186/gb-2012-13-9-r52. [DOI] [PMC free article] [PubMed] [Google Scholar]
- 24.Charos A.E., Reed B.D., Raha D., Szekely A.M., Weissman S.M., Snyder M. A highly integrated and complex PPARGC1A transcription factor binding network in HepG2 cells. Genome Res. 2012;22:1668–1679. doi: 10.1101/gr.127761.111. [DOI] [PMC free article] [PubMed] [Google Scholar]
- 25.Gerstein M.B., Kundaje A., Hariharan M., Landt S.G., Yan K.K., Cheng C. Architecture of the human regulatory network derived from ENCODE data. Nature. 2012;489:91–100. doi: 10.1038/nature11245. [DOI] [PMC free article] [PubMed] [Google Scholar]
- 26.Cheng C., Gerstein M. Modeling the relative relationship of transcription factor binding and histone modifications to gene expression levels in mouse embryonic stem cells. Nucleic Acids Res. 2012;40:553–568. doi: 10.1093/nar/gkr752. [DOI] [PMC free article] [PubMed] [Google Scholar]
- 27.Wang H., Maurano M.T., Qu H., Varley K.E., Gertz J., Pauli F. Widespread plasticity in CTCF occupancy linked to DNA methylation. Genome Res. 2012;22:1680–1688. doi: 10.1101/gr.136101.111. [DOI] [PMC free article] [PubMed] [Google Scholar]
- 28.Dekker J. Gene regulation in the third dimension. Science. 2008;319:1793–1794. doi: 10.1126/science.1152850. [DOI] [PMC free article] [PubMed] [Google Scholar]
- 29.Dekker J., Rippe K., Dekker M., Kleckner N. Capturing chromosome conformation. Science. 2002;295:1306–1311. doi: 10.1126/science.1067799. [DOI] [PubMed] [Google Scholar]
- 30.Sanyal A., Lajoie B.R., Jain G., Dekker J. The long-range interaction landscape of gene promoters. Nature. 2012;489:109–113. doi: 10.1038/nature11279. [DOI] [PMC free article] [PubMed] [Google Scholar]
- 31.Hindorff L.A., Sethupathy P., Junkins H.A., Ramos E.M., Mehta J.P., Collins F.S. Potential etiologic and functional implications of genome-wide association loci for human diseases and traits. Proc Natl Acad Sci U S A. 2009;106:9362–9367. doi: 10.1073/pnas.0903103106. [DOI] [PMC free article] [PubMed] [Google Scholar]
- 32.Schaub M.A., Boyle A.P., Kundaje A., Batzoglou S., Snyder M. Linking disease associations with regulatory information in the human genome. Genome Res. 2012;22:1748–1759. doi: 10.1101/gr.136127.111. [DOI] [PMC free article] [PubMed] [Google Scholar]
- 33.Boyle A.P., Hong E.L., Hariharan M., Cheng Y., Schaub M.A., Kasowski M. Annotation of functional variation in personal genomes using RegulomeDB. Genome Res. 2012;22:1790–1797. doi: 10.1101/gr.137323.112. [DOI] [PMC free article] [PubMed] [Google Scholar]
- 34.Maurano M.T., Humbert R., Rynes E., Thurman R.E., Haugen E., Wang H. Systematic localization of common disease-associated variation in regulatory DNA. Science. 2012;337:1190–1195. doi: 10.1126/science.1222794. [DOI] [PMC free article] [PubMed] [Google Scholar]
- 35.Ni Y., Hall A.W., Battenhouse A., Iyer V.R. Simultaneous SNP identification and assessment of allele-specific bias from ChIP-seq data. BMC Genet. 2012;13:79. doi: 10.1186/1471-2156-13-46. [DOI] [PMC free article] [PubMed] [Google Scholar]