

Abstract
Allele-specific expression refers to the preferential expression of one of the two alleles in a diploid genome, which has been thought largely attributable to the associated cis-element variation and allele-specific epigenetic modification patterns. Allele-specific expression may contribute to the heterosis (or hybrid vigor) effect in hybrid plants that are produced from crosses of closely-related species, subspecies and/or inbred lines. In this study, using Illumina high-throughput sequencing of maize transcriptomics, chromatic H3K27me3 histone modification and DNA methylation data, we developed a new computational framework to identify allele-specifically expressed genes by simultaneously tracking allele-specific gene expression patterns and the epigenetic modification landscape in the seedling tissues of hybrid maize. This approach relies on detecting nucleotide polymorphisms and any genomic structural variation between two parental genomes in order to distinguish paternally or maternally derived sequencing reads. This computational pipeline also incorporates a modified Chi-square test to statistically identify allele-specific gene expression and epigenetic modification based on the Poisson distribution.
Keywords: Allele-specific expression, Epigenetic modification, Poisson model, Hybrid maize, Illumina sequencing
Introduction
Allele-specific gene expression refers to the differential expression of the two alleles in a hybrid genome, such as gene imprinting phenomena in endosperm tissues in flowering plants and placental tissues in animals. The allele-specific expression of a gene is attributed to a distinct epigenetic status of its two parental alleles [1–3]. Two types of epigenetically repressive marks were found to label the silenced allele of an allele-specifically expressed locus. The first is DNA methylation, which plays an important role in establishing the imprinting status prior to fertilization both in plants and animals. Many allele-specifically expressed genes were located in the differentially methylated regions (DMRs) in neighboring upstream and downstream cytosine-rich sequences of the two alleles [4]. Histone H3 lysine 27 tri-methylation (H3K27me3) is another silencing mark that is associated with allele-specific expression, whose formation is mediated by Polycomb-group (PcG) proteins [1,5]. In Arabidopsis, members of the PcG complex contribute to allele-specific expression. The maternal PcG is able to autonomously silence the paternal alleles by adding H3K27me3 to the regulatory sequences of the unwanted paternal alleles, resulting in imprinting phenomena [1,5]. However, how PcG specifically recognizes one of the two alleles and whether other PcG-targeted genes are also subjected to allele-specific H3K27me3 is not known yet. Allele-specific expression may also involve activation of transposable elements (TEs) and uniparental expression of non-coding RNAs (ncRNAs) resulting from allele-specific hypo-methylation in endosperm [6–11]. Nonetheless, the exact underlying mechanisms remain elusive.
Identification of allele-specifically expressed genes has relied on RNA-based technology to infer differentially expressed alleles based on single nucleotide polymorphisms (SNPs). However, this type of analysis has been hindered due to the lack of SNPs in many genes from parental genomes. The genome-wide discovery of imprinted genes has been carried out by performing array- and sequencing-based RNA profiling using SNPs to distinguish paternally or maternally derived transcripts [12]. The array method is very imprecise, since one nucleotide difference on an array probe containing the SNP site is not sensitive enough to differentiate the probe hybridization signals to confirm allelic expression. Sequencing methods are more accurate, as they rely on directly calling the mismatches from reads. However, technical issues do exist. For example, reads are usually non-uniformly distributed in different portions of a gene, due to experimental bias in sample preparation and sequencing. Thus, multiple SNP points on the same gene often have varied coverage, which makes statistical evaluation quite inaccurate. Other disadvantages of RNA-based methods include: (1) because high-quality SNPs are usually located in coding regions, other types of genomic variation such as insertion and deletions (INDELs), intronic and UTR-related polymorphisms are usually not used for calling allelic expression; (2) for genes without SNPs, it is impossible to measure any allele-specific expression and (3) the intergenic regions where potential allele-specific epigenetic modification may exist will be missed by RNA analysis.
To overcome these limitations in RNA-based methods, epigenetic modifications associated with allele-specifically expressed genes can be profiled to infer the molecular mechanisms underlying the allele-specific expression and may facilitate identification of more allele-specifically expressed genes. The feasibility of this type of analysis has been demonstrated in studying the association between allele-specific DNA methylation and imprinted gene expression by mapping the DNA methylome in maize along with mRNA expression levels [13]. We propose a similar computational framework to conduct a combinatorial analysis of mRNA and epigenetic marks to improve the accuracy of identifying allele-specifically expressed genes in the seedling tissues of hybrid maize. This strategy identified allele-specifically expressed genes by simultaneously tracking allele-specific gene expression and epigenetic modification in maize seeding tissues in reciprocal F1 hybrids crossed from the B73 and Mo17 inbred lines. After differentiating the sequencing reads derived from B73 and Mo17 genomes, we determined the allele-specifically expressed genes by combining allele-specific epigenetic marks and RNA expression. The RNA-seq and ChIP-seq data used for developing the pipeline were obtained from an unpublished project that profiled DNA methylation, H3K27me3 and mRNA transcriptome in the seedling tissues of reciprocal F1 hybrids of maize.
Methods
Macro-syntenic map construction
The Mo17 contigs were first partitioned into 2-kbp fragments, so that the large chunks of genomic DNA can be aligned by the BLAST-like alignment tool (BLAT) with small gaps allowed [14]. The adjacently aligned fragments within 1 kbp were then merged as one syntenic block. Finally, various types of genomic variation were indexed, including SNPs and INDELs. Gaps longer than 100 bp were excluded, which may possibly result from the poor coverage of 454 sequencing of Mo17 genome.
Read mapping, genomic position conversion and data visualization
The chromosome sequences of the B73 genome and the contig sequences of the Mo17 genome were first indexed by Bowtie 2 software. These sequences were prepared as two index databases in order to map the reads to the genomes [15]. The mapping results in the SAM format were converted to BAM format using the SAMtools software [16]. We then converted the chromosomal coordinates for the ChIP-seq and RNA-seq reads in hybrids mapped on the Mo17 contigs to the corresponding positions on the B73 genome using a customized Perl Script. To visualize the RNA-seq and ChIP-seq data in the UCSC genome browser, three output files containing the B73-unique reads, Mo17-unique reads and commonly mapped reads, respectively, were first converted into wiggle format files to represent base coverage in each 100 bp bin. Then, the generated wiggle files were uploaded to the UCSC genome browser installed on the local server for visualization (http://genome.ucsc.edu/).
Chi-square test for detecting allele-specific gene expression and epigenetic modification
We used the Chi-square test to detect allele-specific gene expression patterns and epigenetic modification, with a slight modification of the regular Poisson distribution that introduced another parameter λ to represent average bias during sample preparation and sequencing. Let X′ represent the reads mapped on a gene territory with length L, the read counts in genes encoded by different loci are . Then, the overall X′ followed a generalized Poisson distribution:
The optimal parameter λ was calculated by the maximum likelihood estimation using the Newton–Raphson equation , where was the average read count at different positions of a gene. q is an empirical parameter representing the minimum count of reads used in the test with the default value of q set as 20. The optimal parameter θ was calculated by .
Results
Construct a macro-syntenic map of the B73 and Mo17 genomes
The genome of maize inbred line B73 has been recently released with well-assembled chromosome sequences and annotated gene sets [17]. The Mo17 genome was sequenced independently by Joint Genome Institute using 454 shotgun sequencing technology and 25 Gbps of sequencing reads were generated. These sequencing reads for Mo17 were de novo assembled to 528 Mbps non-redundant contig sequences (http://www.phytozome.net), which cover most of gene-encoding regions and sequences upstream or downstream of protein-coding genes. Thus, the sequence availability of both genomes facilitated identification of allele-specifically expressed genes using the proposed strategy. Based on the 528 Mbps Mo17 contigs and 2.5 Gbps B73 genome sequences, we developed a pipeline to build a macro-syntenic map for these two inbred lines (see Methods). The syntenic map was built to identify usable natural genomic variation and to convert the position of any read mapped on the Mo17 contigs to the corresponding position in the B73 genome. Shown in Figure 1 is one exemplary syntenic block, fragments mapped in small pieces are usually located at the flanking regions or untranslated regions (UTRs) of genes, indicating that more genomic variations occur in regulatory regions or UTRs of genes than in coding regions.
Figure 1.
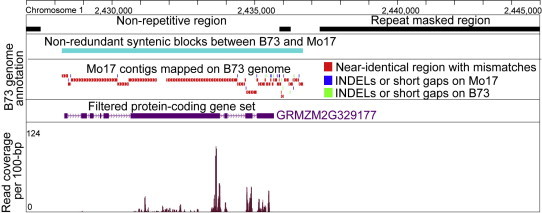
A representative syntenic block covering one gene Mo17 contigs were aligned in many small pieces at the 3′ end of the gene, indicating that more genomic variations occur in its 3′ end region. The near-identical sequences in red contain SNPs (mismatches). INDELs or short gaps on Mo17 and B73 were indicated in blue and green, respectively.
Our pipeline mapped 315,224 (63% of total 496,300) Mo17 contigs to B73 genome, and generated 46,099 syntenic blocks, which cover 18% (451 Mbps) of the B73 genome. We found that 35,244 genes (90.1%) in the filtered gene set (39,097 high-confidence genes in total) and 80,660 genes (73.5%) in the working gene set (109,626 genes in total without excluding pseudo-genes and putative TEs) partially overlapped with or were located entirely inside these 46,099 syntenic blocks. These data indicated that Mo17 genome is not completely covered; however, most high-confidence coding genes and non-repetitive regions can be covered for identification of imprinted genes. Details of all the identified genomic variations in B73 and Mo17 syntenic blocks were stored in plain text file. Based on the Bowtie 2 mapping score, the SNP information is used to differentiate the reads uniquely/preferentially mapped onto each genome, or commonly mapped onto both genomes.
Correlating the mapped locations of reads with the syntenic blocks between B73 and Mo17 genomes
After mapping short reads to the B73 and Mo17 genomes, we developed a script to correlate the mapped positions of reads in the B73 genome with their corresponding positions in the syntenic blocks. Such correlation information would be used to infer the allele-specifically mapped reads in the homologous regions of the two genomes. Subsequently, we developed another script to load the information from the syntenic database and the sequencing read databases in order to differentiate the reads in the two reciprocal F1 hybrids. Reads were classified into three groups: (1) reads that were only or preferentially mapped to the B73 genome (B73-unique reads); (2) reads that were only or preferentially mapped to Mo17 (Mo17-unique reads); and (3) reads mapped to both genomes with equal bowtie mapping score (common reads).
Visualization of allele-specific gene expression and epigenetic modification patterns
To facilitate the analysis of allele-specific epigenetic modification and gene expression patterns in hybrid maize, the counts of reads mapped on the two parental genomes were visualized in the UCSC browser (http://genome.ucsc.edu/). In the browser, we illustrated densities of three types of reads aforementioned for a specified genomic locus using B73 as the reference genome. While most RNA-seq reads were commonly mapped to the coding regions where nucleotide polymorphisms are fewer, the untranslated regions (5′ & 3′ UTRs) usually contained more B73-unique or Mo17-unique reads as expected (Figure 2).
Figure 2.
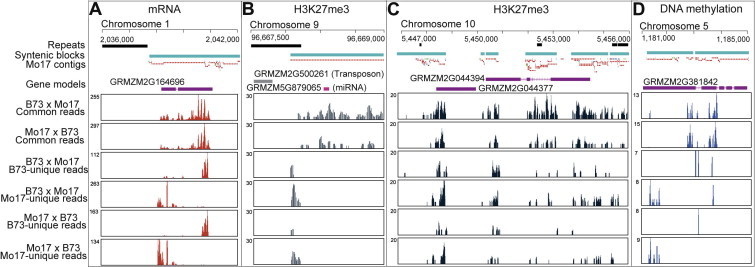
Examples of maize genes subject to allele-specific expression and epigenetic modification due to natural genomic variations between B73 and Mo17 genomes A. A gene with more Mo17-unique reads at its 5′ end and more B73-unique reads at its 3′ end. Allele-specific expression can be inferred by considering the overall distribution of the B73- and Mo17-unique reads and the common reads. B. A miRNA gene with more Mo17-unqiue reads at its 5′ end, indicating the two alleles are differentially modified by H3K27me3. C. Two genes equally modified by H3K27me3 on the two parental alleles. No significantly different B73-unique and Mo17-unique reads are found. D. A gene with more Mo17-unique reads and differential methylation at 5′ end.
In the first case in Figure 2, there are more B73-unique RNA reads at the 5′ end of gene while there are more Mo17-unique reads at the 3′ end of gene in the two reciprocal crosses (Figure 2A). Thus, allele-specific expression of the B73 and Mo17 alleles can be inferred from the ratio of the amount of unique reads and common reads. A statistical test then can be used to estimate significance. In the second case in Figure 2, a miRNA gene, zma-MIR171n, contains more Mo17-unique H3K27me3 reads at the 5′ end, indicating it is unevenly modified on two alleles (Figure 2B). Figure 2C shows that two alleles may be equally modified by H3K27me3 since there were no significantly different inbred-unique reads detected on these two genes. Figure 2D shows an allele-specific DNA methylation at the 5′ end of another gene. However, these genes should not be regarded as imprinted, since no parent-of-origin effect was observed. The allele-specific pattern is due to the occurrence of natural sequence variations in these two genomes. In the case of endosperm, consistent detection of the inbred-unique reads, regardless of the direction of the cross, will facilitate the identification of imprinted genes. Moreover, these examples indicated that genomic variations in the intergenic regions can better differentiate the maternal and paternal reads, and they are more suitable for statistical evaluation of the differences in the reads mapped on the two parental alleles than SNPs in the coding regions alone.
Identification of allele-specific expression and epigenetic modification based on Chi-square test
To assess allele-specific gene expression and epigenetics, we first analyzed the RNA-seq data in two reciprocal F1 hybrids using the Chi-square test. The Chi-square test is a relatively simple method, which does not require distribution modeling or parameter estimation. In Chi-square test, ratio of the expression levels from the two alleles was assumed to be 1:1. This null hypothesis was also applied to histone modification and DNA methylation, since there was one copy of maternal DNA and one copy of paternal DNA in the genome of seedling tissues. However, uneven read distribution within a gene, caused by experimental bias in sample preparation and sequencing, would greatly affect the estimation of allele-specific patterns (Figure 3). Thus, systematic errors need to be minimized before the statistical test is performed.
Figure 3.
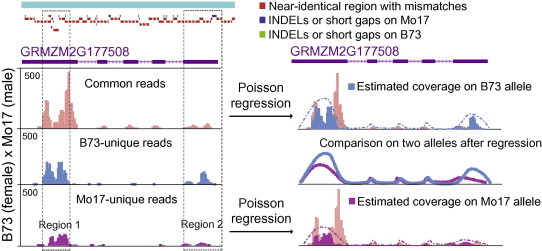
Estimation of read coverage on B73 and Mo17 allele Left panel shows that read coverage on a specific gene is not uniformly distributed (see regions 1 & 2) due to the bias in sample preparation and sequencing. B73 and Mo17 unique reads are usually enriched at 3′ and 5′ ends presumably in the UTR regions. The right panel shows the result after Poisson regression was employed to estimate the read coverage on B73 and Mo17 alleles using the unique reads at a specific portion of the gene. The Poisson test is then used to compare smoothed read coverage on the two alleles.
The Poisson distribution has been widely used to model the read count feature of RNA-seq and ChIP-seq data. Therefore, we performed a Poisson regression to estimate read coverage for the B73 and Mo17 alleles based on generalized Poisson distribution by considering the amount of B73- and Mo17-unique reads as well as common reads within an allele (Figure 3). We used the Poisson test to evaluate differences of read coverage between the B73 and Mo17 alleles, based on the null hypothesis that the ratio was 1:1 (maternal expression & modification versus paternal expression & modification). To correct the type I error derived from multiple testing, we employed the Sidák correction method to calculate the adjusted P value, adjusted P = 1 − (1 − Pi)1/n, where n is the number of P values derived from multiple testing. Finally, genes and genomic regions with significant allele-specific patterns in terms of gene expression and epigenetic modification were selected using a P value of 0.01.
Conclusion
Allele-specific expression is found ubiquitously in both plant and animal kingdoms, which has been thought largely attributable to associated cis-element variations and allele-specific epigenetic modification patterns. This interesting expression pattern was first observed in maize endosperm and then was expanded to maize meristem evaluated by massively parallel signature sequencing (MPSS). Allele-specific expression phenomenon was also reported in Arabidopsis, suggesting that this phenomenon is widely spread in plants. Allele-specific expression could result in allelic gene expression variation in hybrid and thus may have an impact on heterosis performance of F1 hyrbid. Therefore, profiling of transcriptome and epigenomic data from the hybrid plants that were generated from crosses of the subspecies or different inbred lines has been carried out in many plant species, in order to investigate the correlation between allele-specific gene expression and epigenetic modification and heterosis in crop plants. However, no mature bioinformatic pipelines and computational framework have been developed for this type of study.
Using the Illumina high-throughput sequencing data of the mRNA transcriptome, DNA methylome and H3K27me3 modification in hybrid maize seedling tissue, we developed a computational procedure for detecting allele-specific gene expression and epigenetic modification. The first step was to generate a file storing a variety of natural genomic variations within the syntenic blocks identified in the two parental maize genomes. The second step was to generate a file storing the mapping information from the sequenced RNAs and epigenetic marks in F1 hybrids. The third step was to differentiate the reads mapped only/preferentially to B73 and Mo17 genomes, and commonly to both genomes, finally convert positions of reads on Mo17 to the reference B73 genome. The fourth step generated outcomes in the wiggle format, ready to be visualized in the UCSC genome browser. We also introduced a statistical method to measure the significance of allele-specific gene expression and epigenetic modification using the Chi-square test to accommodate the bias of the inbred-unique reads inherited from the two parental genomes. This computational framework can be applied to both plants and animal research.
Authors’ contributions
XFW conceived the project. XXW performed the analysis. XFW and XXW wrote the manuscript. Both authors read and approved the final manuscript.
Competing interests
The authors declare no conflict of interests.
Acknowledgements
This work was supported by the National Natural Science Foundation of China (Grant No. 31260015), Natural Science Foundation of Qinghai Province (Grant No. 2012-Z-919Q), the Research Fund for Youth Project of Qinghai University (Grant No. 2011-QYY-1) and the State Key Laboratory for Agrobiotechnology of China Agricultural University (Grant No. 2012SKLAB06-5).
Footnotes
Peer review under responsibility of Beijing Institute of Genomics, Chinese Academy of Sciences and Genetics Society of China.

References
- 1.Raissig M.T., Baroux C., Grossniklaus U. Regulation and flexibility of genomic imprinting during seed development. Plant Cell. 2011;23:16–26. doi: 10.1105/tpc.110.081018. [DOI] [PMC free article] [PubMed] [Google Scholar]
- 2.Bauer M.J., Fischer R.L. Genome demethylation and imprinting in the endosperm. Curr Opin Plant Biol. 2011;14:162–167. doi: 10.1016/j.pbi.2011.02.006. [DOI] [PMC free article] [PubMed] [Google Scholar]
- 3.Gutierrez-Marcos J. Imprinting in plants. Chin Sci Bull. 2009;54:2383–2389. [Google Scholar]
- 4.Feng S., Jacobsen S.E., Reik W. Epigenetic reprogramming in plant and animal development. Science. 2010;330:622–627. doi: 10.1126/science.1190614. [DOI] [PMC free article] [PubMed] [Google Scholar]
- 5.Jullien P.E., Katz A., Oliva M., Ohad N., Berger F. Polycomb group complexes self-regulate imprinting of the polycomb group gene MEDEA in Arabidopsis. Curr Biol. 2006;16:486–492. doi: 10.1016/j.cub.2006.01.020. [DOI] [PubMed] [Google Scholar]
- 6.Kinoshita T., Miura A., Choi Y.H., Kinoshita Y., Cao X.F., Jacobsen S.E. One-way control of FWA imprinting in Arabidopsis endosperm by DNA methylation. Science. 2004;303:521–523. doi: 10.1126/science.1089835. [DOI] [PubMed] [Google Scholar]
- 7.Hsieh T.F., Shin J., Uzawa R., Silva P., Cohen S., Bauer M.J. Regulation of imprinted gene expression in Arabidopsis endosperm. Proc Natl Acad Sci U S A. 2011;108:1755–1762. doi: 10.1073/pnas.1019273108. [DOI] [PMC free article] [PubMed] [Google Scholar]
- 8.Zemach A., Kim M.Y., Silva P., Rodrigues J.A., Dotson B., Brooks M.D. Local DNA hypomethylation activates genes in rice endosperm. Proc Natl Acad Sci U S A. 2010;107:18729–18734. doi: 10.1073/pnas.1009695107. [DOI] [PMC free article] [PubMed] [Google Scholar]
- 9.Gehring M., Bubb K.L., Henikoff S. Extensive demethylation of repetitive elements during seed development underlies gene imprinting. Science. 2009;324:1447–1451. doi: 10.1126/science.1171609. [DOI] [PMC free article] [PubMed] [Google Scholar]
- 10.Mosher R.A. Maternal control of Pol IV-dependent siRNAs in Arabidopsis endosperm. New Phytol. 2010;186:358–364. doi: 10.1111/j.1469-8137.2009.03144.x. [DOI] [PubMed] [Google Scholar]
- 11.Mosher R.A., Melnyk C.W., Kelly K.A., Dunn R.M., Studholme D.J., Baulcombe D.C. Uniparental expression of PolIV-dependent siRNAs in developing endosperm of Arabidopsis. Nature. 2009;460:283–286. doi: 10.1038/nature08084. [DOI] [PubMed] [Google Scholar]
- 12.Luedi P.P., Dietrich F.S., Weidman J.R., Bosko J.M., Jirtle R.L., Hartemink A.J. Computational and experimental identification of novel human imprinted genes. Genome Res. 2007;17:1723–1730. doi: 10.1101/gr.6584707. [DOI] [PMC free article] [PubMed] [Google Scholar]
- 13.Waters A.J., Makarevitch I., Eichten S.R., Swanson-Wagner R.A., Yeh C.T., Xu W. Parent-of-origin effects on gene expression and DNA methylation in the maize endosperm. Plant Cell. 2011;23:4221–4233. doi: 10.1105/tpc.111.092668. [DOI] [PMC free article] [PubMed] [Google Scholar]
- 14.Kent W.J. BLAT – the BLAST-like alignment tool. Genome Res. 2002;12:656–664. doi: 10.1101/gr.229202. [DOI] [PMC free article] [PubMed] [Google Scholar]
- 15.Langmead B., Trapnell C., Pop M., Salzberg S.L. Ultrafast and memory-efficient alignment of short DNA sequences to the human genome. Genome Biol. 2009;10:R25. doi: 10.1186/gb-2009-10-3-r25. [DOI] [PMC free article] [PubMed] [Google Scholar]
- 16.Li H., Handsaker B., Wysoker A., Fennell T., Ruan J., Homer N. The Sequence Alignment/Map format and SAMtools. Bioinformatics. 2009;25:2078–2079. doi: 10.1093/bioinformatics/btp352. [DOI] [PMC free article] [PubMed] [Google Scholar]
- 17.Schnable P.S., Ware D., Fulton R.S., Stein J.C., Wei F.S., Pasternak S. The B73 maize genome: complexity, diversity, and dynamics. Science. 2009;326:1112–1115. doi: 10.1126/science.1178534. [DOI] [PubMed] [Google Scholar]