

Abstract
The food-borne pathogen Vibrio parahaemolyticus has been reported as being present in New Zealand (NZ) seawaters, but there have been no reported outbreaks of food-borne infection from commercially grown NZ seafood. Our study determined the current incidence of V. parahaemolyticus in NZ oysters and Greenshell mussels and the prevalence of V. parahaemolyticus tdh and trh strains. Pacific (235) and dredge (21) oyster samples and mussel samples (55) were obtained from commercial shellfish-growing areas between December 2009 and June 2012. Total V. parahaemolyticus numbers and the presence of pathogenic genes tdh and trh were determined using the FDA most-probable-number (MPN) method and confirmed using PCR analysis. In samples from the North Island of NZ, V. parahaemolyticus was detected in 81% of Pacific oysters and 34% of mussel samples, while the numbers of V. parahaemolyticus tdh and trh strains were low, with just 3/215 Pacific oyster samples carrying the tdh gene. V. parahaemolyticus organisms carrying tdh and trh were not detected in South Island samples, and V. parahaemolyticus was detected in just 1/21 dredge oyster and 2/16 mussel samples. Numbers of V. parahaemolyticus organisms increased when seawater temperatures were high, the season when most commercial shellfish-growing areas are not harvested. The numbers of V. parahaemolyticus organisms in samples exceeded 1,000 MPN/g only when the seawater temperatures exceeded 19°C, so this environmental parameter could be used as a trigger warning of potential hazard. There is some evidence that the total V. parahaemolyticus numbers increased compared with those reported from a previous 1981 to 1984 study, but the analytical methods differed significantly.
INTRODUCTION
Because of the halophilic nature and marine habitat of Vibrio parahaemolyticus, raw seafood can naturally harbor this microorganism and is the main food source responsible for the gastroenteritis the microorganism causes (1). A recent report released by the U.S. Centers for Disease Control and Prevention estimated that the average annual incidence of Vibrio species infections in the United States increased by 43% from the 2006 to 2008 period to 2012 (2). The incidence rate of V. parahaemolyticus infection in New Zealand (NZ) is calculated to be 1.6/100,000, increasing to 15.3/100,000 in the Pacific Islander population, with most cases linked to imported seafood (3).
An international risk assessment of V. parahaemolyticus in raw seafood highlighted the importance of exposure to raw oysters based on the incidence of V. parahaemolyticus harboring the thermostable direct hemolysin (tdh) and tdh-related hemolysin (trh) genes at harvest (4).
NZ has two main islands (Fig. 1) that extend from latitudes 34° to 47° south. This means that there are diverse habitats and significant differences in water temperature along the length of the country, with cooler waters in the south. The first reported NZ isolation of V. parahaemolyticus was from Bay of Islands' shellfish (5). Subsequently, Fletcher (6) conducted a 3-year survey on the incidence of V. parahaemolyticus in NZ Pacific oysters (1981 to 1984), showing that high incidences of the microorganism were found when seawater temperatures were elevated in summer. In the 1990s, the NZ Ministry of Health's Domestic Food Monitoring program found V. parahaemolyticus present in 25% of oysters and 14% of cockles sampled from the Waikato region (7). None of these studies investigated the presence of tdh and trh pathogenic genes, and only one NZ study has investigated these (8). This was conducted in the summer of 2008 to 2009 in commercially grown NZ Pacific oysters and detected the tdh gene in 2 of 58 samples.
FIG 1.
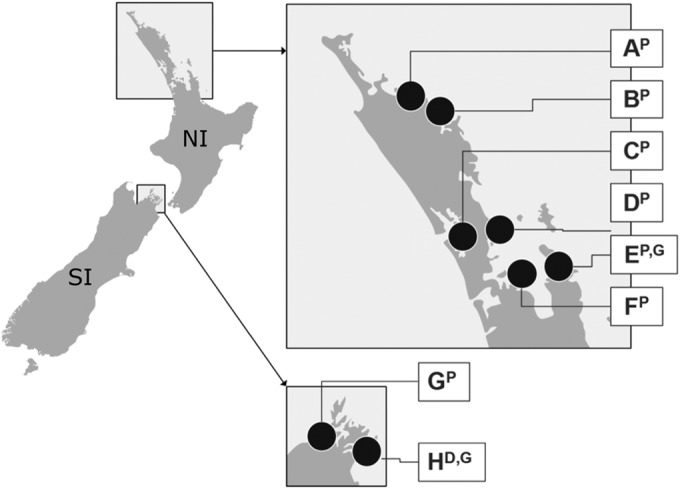
Location of oyster- and mussel-growing areas of the North (NI) and South Islands (SI) of New Zealand. A, Whangaroa Harbor; B, Bay of Islands; C, Kaipara Harbor; D, Mahurangi Harbor; E, Coromandel; F, Hauraki Gulf; G and H, Marlborough Sounds. Superscript letters: P, Pacific oysters; G, Greenshell mussels; D, dredge oysters.
Concerns have been raised in recent years with V. parahaemolyticus-associated outbreaks in areas not previously considered to be hazardous because of their cooler water temperatures: Alaska (9) and Chile (10). The effects of climate change (i.e., increase in seawater temperature), adaptation of pathogens to cooler water, the emergence of new strains, and their distribution via ballast water have been suggested as reasons (11, 12).
A 1994 study by the National Institute for Water and Atmospheric Research (NIWA; NZ) concluded that the average annual NZ temperatures over the ocean surface have warmed by about 0.7°C since the beginning of the century, with a slightly smaller increase in the surface seawater temperature (SST) (13).
The current study sought to evaluate the effect of environmental parameters (temperature and salinity) on V. parahaemolyticus numbers in NZ shellfish, to compare current V. parahaemolyticus numbers with those found in the 1980s, and to address a knowledge gap on the incidence and prevalence of V. parahaemolyticus strains carrying tdh and trh in commercially grown NZ shellfish. The information generated by the study will be used by commercial shellfish growers to provide an enhanced picture of the distribution and ecology of V. parahaemolyticus across NZ seawaters and to help them to manage shellfish harvesting within safety limits.
MATERIALS AND METHODS
Shellfish harvest.
All samples used in this study were harvested between December 2009 and May 2012, which included three complete southern summers. Commercial aquaculture areas for Pacific oyster (Crassostrea gigas) (seven areas; n = 235 samples), dredge oyster (Ostrea chilenses) (one area; n = 21 samples), and Greenshell mussel (Perna canaliculus) (two areas; n = 55 samples) were evaluated (Fig. 1). Shellfish were harvested by farm staff on a monthly basis (fortnightly for North Island samples from December to June, when higher numbers of V. parahaemolyticus were present). Toward the end of 2011, the NZ oyster industry was affected by the Pacific oyster mortality disease, resulting in fewer samples being available for analysis that season. Sites C, D, G, and H (Fig. 1) continued to provide samples until the end of the study (May 2012). Salinity and surface seawater temperature (SST) were measured using a refractometer (Atago S/Mill, Japan) and a conventional thermometer, respectively. Pacific oysters from the North Island (sites A to F) were grown in intertidal racks (exposed to air and sunlight at low tides), while dredge and Pacific oysters from South Island (sites G and H) and mussels (sites E and H) were grown subtidally (fully submerged at all times).
All samples, except those from site G, were shipped overnight to our laboratory in plastic bags and placed in a polystyrene box containing ice but not in direct contact with the samples. Transport temperature was monitored during shipment by using a stainless steel data logger device (iButton; Thermochron, NZ) or by measuring the meat temperature upon arrival using a digital probe thermometer (model TFX 410-1/TPX 400; Ebro, NZ). Microbiological analysis was initiated within 24 h of sample collection. Oyster samples from site G were analyzed by The Cawthron Institute (Nelson, NZ) because of shipment constraints. Open or cracked oysters were not used in the analysis.
Microbiological analysis.
Samples were tested for numbers of total V. parahaemolyticus organisms, as well as numbers of V. parahaemolyticus organisms carrying tdh and trh, using the FDA most-probable-number (MPN) method (14), with minor modifications (15). Briefly, each shellfish was scrubbed with a sterile brush under running tap water to remove any mud. The meat and liquor from 12 shellfish were pooled to constitute one sample for the analysis. Samples were transferred to a sterile laboratory blender (Waring, United States) and processed at low speed for 1.5 min. One gram of each blended shellfish sample was weighed into each of three sterile tubes containing 10 ml of alkaline peptone water (APW; Difco). Decimal serial dilutions were prepared in Vibrio phosphate-buffered saline (Vibrio-PBS) composed of 7.650 g NaCl (AnalaR, England), 0.724 g Na2HPO4 (AnalaR), and 0.210 g KH2PO4 (Univar, Australia) per liter of distilled water, with pH adjusted to 7.4 using a 1N NaOH solution according to expected densities of V. parahaemolyticus in the sample. Triplicate APW tubes then were inoculated and incubated at 35°C for 24 h. To obtain a more efficient culture-based method, we included a chromogenic agar as well as the conventional (thiosulfate-citrate-bile-salt-sucrose [TCBS]) agar and a confirmatory selective cross-streaking step. After incubation in APW, one loopful from the surface of each turbid APW enrichment tube was streaked onto CHROMagar (CA; CHROMagar, Paris, France) and TCBS (Difco) agars for isolation. Four presumptive (based on color and colony morphology) V. parahaemolyticus colonies were selected from each agar and checked by cross-streaking on the other agar (i.e., blue colonies from CA were streaked onto TCBS agar and green colonies from TCBS agar were streaked onto CA). CA and TCBS agar plates were incubated at 35°C for 18 to 24 h (Fig. 2).
FIG 2.

Flow chart of Vibrio parahaemolyticus most-probable-number detection method adapted from Kaysner and DePaola (14) and Cruz et al. (15) using a chromogenic agar and a two-step culture confirmation.
For the DNA extraction, up to four presumptive V. parahaemolyticus colonies isolated from the cross-streaking checking step were streaked onto tryptic soy agar (TSA; Difco) supplemented with 2% NaCl (Scharlau, Germany). TSA plates were incubated at 35°C for 18 to 24 h. Isolated colonies were resuspended in 250 μl of ultrapure water in a sterile tube and boiled at 100°C in a digital dry bath (Labnet, United States) for 10 min. The tubes then were placed on ice for at least 5 min. V. parahaemolyticus primers encoding the Vibrio regulatory protein toxR were used to confirm species (16), and primers for tdh or trh were used to identify pathogenic strains (17, 18). The final PCR mix consisted of 12.5 μl of BioMix Red (Bioline, NZ), 1 μM forward and reverse primers (IDT, NZ), 5 μl of extracted DNA, and 7.5 μl of ultrapure water. One negative and one positive control were prepared for each PCR assay. PCR cycle conditions were performed according to the methods of Tada et al. (18), Kim et al. (16), and Shirai et al. (17). V. parahaemolyticus strains ATCC 43996 (carrying tdh) and NZRM 4289 (carrying trh), as supplied by the Institute of Environmental Science and Research (ESR, NZ), were used as positive controls.
The MPN approach was used for enumeration, recording positive and negative results from a range of decimal serial dilutions of the triplicate set of APW tubes. Turbid APW tubes that were confirmed by conventional PCR for the presence of total V. parahaemolyticus organisms, as well as those carrying tdh and trh genes, were recorded as positive in the MPN spreadsheet developed by Blodgett (19), and the MPN/g value was calculated. The detection limit was 0.36 MPN/g, except for samples from site G that were analyzed by The Cawthron Institute with a detection limit of 3.0 MPN/g.
Statistical analyses.
When V. parahaemolyticus was not detected, a value of half the detection limit (0.18 or 1.5 MPN/g) was used for statistical analyses. To test variations of log10 V. parahaemolyticus numbers between shellfish species and sites and over time, unbalanced analyses of variance (ANOVAs) were fitted, testing the effects of site and year against site-year interaction, and summer/winter differences were tested for consistency against site and site versus year interactions. To test the relationships of log10 V. parahaemolyticus counts with water temperature or salinity, random coefficient regression models were fitted. The models tested linear relationships between these and the bacterial populations reported, allowing for variations between harvest region and harvest period and interaction with shellfish species.
ANOVA and random coefficient regression models were fitted in Genstat (version 15; VSNi Ltd., Hemel Hempstead, United Kingdom). Graphics were produced in SigmaPlot (version 10; Systat Software Inc., San Jose, CA) and Microsoft Excel. The level of significance was set at a P value of <0.001.
RESULTS
V. parahaemolyticus was detected in a total of 80.2% (n = 174) of Pacific oyster samples harvested from the North Island and was not detected in samples from the South Island (n = 18). The numbers of V. parahaemolyticus in Pacific oysters ranged from 0.36 × 10⁴ to 2.4 × 10⁴ MPN/g with a mean of 8.9 × 10² MPN/g, where detected. V. parahaemolyticus was detected in one dredge oyster sample harvested from the South Island (n = 21), with a count of 0.36 MPN/g. V. parahaemolyticus was observed in Greenshell mussels in 16/38 (42.1%) of the North Island samples and in 2/17 (11.8%) of the South Island samples. V. parahaemolyticus numbers in mussel samples ranged from 0.36 to 95.4 MPN/g, with a mean for positive samples from the North Island of 12.1 MPN/g and 0.36 MPN/g for South Island samples.
A seasonal distribution of the microorganism was observed (Fig. 3). The presence and numbers of V. parahaemolyticus organisms observed in summer months were significantly higher than in winter months (June-November versus December-May, P < 0.001). In February, the averages recorded for total V. parahaemolyticus numbers were 3.0 × 10² MPN/g (22.5°C), 2.0 × 10³ MPN/g (23.7°C), and 7.0 × 10³ MPN/g (21.4°C) in 2010, 2011, and 2012, respectively. The highest count of 2.4 × 10⁴ MPN/g was recorded in three samples of Pacific oysters harvested in the North Island during the summer of 2012 (February and March). Conversely, during the winter (between June and November), all shellfish samples harvested had total V. parahaemolyticus numbers below 10 MPN/g or had nondetectable numbers (<0.36 MPN/g and <3 MPN/g for site G) (June-November versus December-May, P < 0.001), with SST ranging from 5.5 to 20.7°C.
FIG 3.

Seasonal distribution of total and pathogenic Vibrio parahaemolyticus numbers in New Zealand shellfish. Each line or bar represents the arithmetic mean of eight sites and three types of shellfish averaged over 14 days. □, total V. parahaemolyticus; ■, pathogenic V. parahaemolyticus (all tdh positive, no trh genes were detected); solid line, surface seawater temperature (°C); dashed line, salinity (ppt).
The incidences of total V. parahaemolyticus observed in growing areas A, B, C, D, E, and F were 87.8%, 89.8%, 77.1%, 92.3%, 78.8%, and 71.6%, respectively. The shellfish-growing areas with the highest recorded incidence (areas B and D) also had the highest average numbers of V. parahaemolyticus across all samples (8.6 × 10² and 2.6 × 10³ MPN/g, respectively). In contrast, shellfish-growing areas C and F had the lowest incidence and lower-than-average V. parahaemolyticus numbers (8.9 × 101 and 4.9 × 10² MPN/g, respectively).
There was no statistical difference in the numbers of total V. parahaemolyticus organisms detected each year across the two-and-a-half years of study (P = 0.436) (Fig. 3).
The SST and salinity of the seawater ranged from 7.9 to 25.5°C (mean, 18.7°C) and 8.5 to 40 ppt (mean, 33.1 ppt), respectively, for North Island harvesting areas, while in the South Island sites SST varied from 10.7 to 20.5°C (mean, 15.0°C) and salinity from 33.8 to 37.0 ppt (mean, 35.2 ppt) (Fig. 3).
V. parahaemolyticus numbers in Pacific oysters appeared to be sensitive to SST (Fig. 4), but we had no evidence of temperature dependence in dredge oysters or Greenshell mussels (R2 < 0.05; data not shown; for shellfish species-SST interaction, P = 0.009; slope for Pacific oysters on a log10 scale, 0.229 [standard errors {SE}, 0.026]; slope for Greenshell mussels on a log10 scale, 0.048 [SE, 0.058]; slope for dredge oysters on a log10 scale, 0.000 [SE, 0.125]).
FIG 4.

Numbers of total Vibrio parahaemolyticus in New Zealand Pacific oysters harvested from each of the North Island shellfish-growing areas (2009 to 2012). Capital letters above each plot indicate the sites of harvest according to Fig. 1.
To assess the consistency of the SST influence on V. parahaemolyticus numbers in Pacific oysters observed in the pooled data, we analyzed the unpooled data of all the sampled North Island shellfish-growing areas (Fig. 4). Similar patterns were observed, with increasing SST leading to high V. parahaemolyticus populations in each growing area.
To analyze the influence of water salinity on the numbers of V. parahaemolyticus organisms present in shellfish samples, a model similar to that of SST was fitted, but no correlation was observed (for salinity main effect, P = 0.212; for salinity-shellfish species interaction, P = 0.949) (Fig. 5). However, adding salinity to the SST model gave a small but significant improvement to the model (P = 0.031), which translated to the fact that each additional unit of salinity would represent an average reduction of 7% total V. parahaemolyticus numbers. The relatively low R2 values in Fig. 4 indicate that other factors have a significant bearing on V. parahaemolyticus numbers as well as SST and salinity.
FIG 5.

Numbers of total Vibrio parahaemolyticus in New Zealand Pacific oysters harvested from each of the North Island shellfish-growing areas (2009 to 2012). Capital letters above each plot indicate the sites of harvest according to Fig. 1.
Although V. parahaemolyticus was detected at all North Island sampling sites included in the study, the distribution showed a distinctive pattern for some shellfish-growing areas. Figure 6 shows data from the same growing areas covered by our study (2009 to 2012), by the survey conducted in the summer of 2008 to 2009 (8), and by the one conducted in the 1980s (6). An increase in the V. parahaemolyticus numbers was observed compared with data from the 1981 to 1984 study, although methods differed in the three studies (Table 1). While samples harvested in the 1980s from the common shellfish-growing areas A, D, and E showed V. parahaemolyticus incidences of 47, 64, and 73%, respectively, the current study found 92, 88, and 79% incidence, respectively, at the same locations. The bacterial populations showed similar differences, with mean counts of 2.2, 4.9 × 101, and 3.1 MPN/g versus 3.8 × 10², 2.6 × 10³, and 4.2 × 10² MPN/g, respectively. For those samples, the average reported SSTs were 19.9, 19.7, and 17.3°C for the 1980s data and 18.0, 18.5, and 18.9°C, respectively, for the current study.
FIG 6.

Numbers of total Vibrio parahaemolyticus in New Zealand Pacific oysters harvested in different shellfish-growing areas of the North Island (1981 to 2012). The capital letter above each plot indicates the shellfish-growing area according to Fig. 1. Grey boxes, harvests of 2009 to 2012; grey diamonds, harvests of 2008 to 2009; black circles, harvests of 1981 to 1984; solid line, regression line for 2009 to 2012; dotted line, regression line for 2008; dashed line, regression line for 1981 to 1984.
TABLE 1.
Comparison of the different New Zealand studies on the detection and enumeration of Vibrio parahaemolyticus in different shellfish-growing areas
| Parameter | Value from: |
||
|---|---|---|---|
| Fletcher (6) | Kirs et al. (8) | Current study | |
| Period of study | 1981–1984 | 2008–2009 | 2009–2012 |
| No. of mo/yr | 7 (summer) | 5 (summer) | 12 (fortnightly for 7) |
| No. of growing areas sampled | 1–4 | 6 | 6–9 |
| Shellfish species | Pacific oysters | Pacific oysters | Pacific oysters, dredge oysters, Greenshell mussels |
| Total no. of samples | 194 | 58 | 311 |
| Primary enrichment | Salt polymyxin broth | Alkaline peptone water | Alkaline peptone water |
| Selective agar(s) | TCBS | TCBS, CA | TCBS, CHROMAgar Vibrio |
| Confirmation | VP medium | API 20NE (quantitative PCR) | PCR |
| Positive samples (%) | 57 | 95 | 73 (Pacific oysters) |
| Geometric mean (MPN/g) | 1.6 | 77.4 | 25.5 (Pacific oysters) |
| Seawater temp (°C) | 11–25 | 18–24 | 5.5–25.5 |
| Salinity (ppt) | 32–35.5 | ≥31 | 21–40 |
In contrast, the study conducted in the summer of 2008 to 2009 and our survey found similar incidences of total V. parahaemolyticus levels. Over the summer periods, V. parahaemolyticus was present in 100% of Pacific oysters from both studies. The numbers did not vary much between growing areas analyzed in the two most recent studies, with area B having the highest numbers of total V. parahaemolyticus and shellfish-growing area C the lowest. V. parahaemolyticus numbers ranged from 1.8 × 101 MPN/g to 1.1 × 10³ MPN/g and 8.9 × 101 MPN/g to 7.7 × 10² MPN/g for the periods of 2008 to 2009 and 2009 to 2012, respectively (P values comparing the two studies adjusted for seasonality ranged from 0.221 to 0.772 at different sites) (Fig. 6).
V. parahaemolyticus carrying the tdh virulence gene was present in only 3/217 (1.4%) of the North Island Pacific oyster samples. The method used in this study did not detect trh genes in any samples, which is in agreement with the previous study of Kirs et al. (8). Shellfish samples harboring V. parahaemolyticus carrying the tdh gene were harvested only in the last two seasons of the survey (Fig. 4). Some PCR gels showed bands with molecular weights similar to those of the trh control (see Fig. S1 in the supplemental material). PCR products, amplified using the primers described above, were purified using a QIAquick PCR purification kit (Qiagen) and sequenced by Macrogen Inc. (Seoul, South Korea) in order to confirm the presence of trh. With the sequence results obtained, a comparative BLAST search was conducted against other bacterial DNA sequences present in GenBank (www.ncbi.nlm.nih.gov/GenBank/). None of these PCR products from NZ isolates matched the trh gene, whereas PCR products from a control strain gave a good match.
DISCUSSION
Currently, there are no regulatory limits for Vibrio spp. in seafood in NZ. However, appropriate control measures (e.g., time to chilled storage temperatures) are in place to ensure quality and safety (20), and no outbreaks of food-borne illness have ever been attributed to V. parahaemolyticus in seafood produced in NZ.
A seasonal trend was observed, with V. parahaemolyticus numbers in Pacific oysters increasing with increasing seawater temperatures. Numbers peaked in late summer, when most oyster farmers are not harvesting commercially. The seawater temperature may be used as a strong predictor of maximum incidence and numbers of total V. parahaemolyticus organisms in the aquatic environment and, consequently, in shellfish; this has been shown by other researchers worldwide and is reaffirmed in our study (21–30). Despite this, some of the samples harvested at warm temperatures (>20°C) had low numbers of V. parahaemolyticus organisms, clearly showing that temperature is not the only factor that influences the bacterium's abundance and distribution. For example, shellfish-growing areas C and D are located in similar latitudes but on opposite coasts. The average SST between these two locations differed by only 0.1°C, but V. parahaemolyticus numbers were very different (numbers in area C averaged 1.5 log10 MPN/g less than those in area D). The average salinity value also was similar (33 and 34.5 ppt for areas C and D, respectively). The differences in V. parahaemolyticus numbers between the two harbors might be related to differences in nutrient concentration (plankton composition and oxygen and particulate organic matter availability), as well as to levels of freshwater flows and depth of the harvesting area. Area C is located on a larger and more open harbor on the northwestern side toward Tasman sea, while area D is a more enclosed harbor, fed by a river that passes close to a township. Area D oysters also are grown at a slightly closer distance to the seafloor (1.0 m compared with 1.4 m in area C). Interestingly, Moore et al. (31) showed that two U.S. coast sites, with different mean salinities due to more fresh water input in one harvest area, had almost identical mean numbers of V. parahaemolyticus in oysters. They also showed the variety of association between bacterial abundance and either salinity or temperatures depending on the harbor studied.
In relation to V. parahaemolyticus strains harboring the tdh gene, one of three tdh-positive samples was isolated when SSTs were as low as 17.5°C in November 2010. These findings suggest that environmental factors interact differently for each subpopulation. Remote sensing of SST rise could be a valuable tool for a risk assessment framework covering this pathogen in oysters at harvest (32), as well as plankton composition (32) and water turbidity (33). Other studies have shown that numbers of V. parahaemolyticus containing the tdh or trh gene were variable and sometimes inversely related to temperature (34, 35), whereas our limited tdh data did not support the latter observation. However, our data do support other studies where levels of V. parahaemolyticus harboring tdh and trh were not necessarily proportionate to the total V. parahaemolyticus population (25, 34–36). Although peak numbers of V. parahaemolyticus strains carrying tdh or trh occurred at a time point similar to that for total V. parahaemolyticus (Fig. 4), high total counts often were observed when no tdh or trh V. parahaemolyticus strains were detected. In 2010, despite seeing the normal summer peak in the total population, no tdh or trh V. parahaemolyticus strains were detected for the whole season.
In another as-yet unpublished study, the authors detected trh genes in V. parahaemolyticus isolated from NZ Pacific oysters using real-time PCR. The numbers of V. parahaemolyticus organisms carrying the trh gene were low; the maximum numbers recorded during the study were 2 MPN/g.
The literature reports contradictory conclusions on the association between salinity and Vibrio spp. Some studies have shown a linear relationship, similar to that of SST, when testing water samples (25, 28, 31, 33). However, the data from our study did not show a particular correlation between salinity and V. parahaemolyticus in oyster samples, and these are results that are similar to those from some other studies (8, 27, 30, 31, 37). This could be related to the narrow range of salinity in our shellfish-growing areas.
Martinez-Urtaza et al. (12) estimated that the maximum probability of V. parahaemolyticus detection was around salinity of 25 ppt, similar to the findings of optimal salinity for V. parahaemolyticus presence in oysters of 23 ppt (14). NZ seawaters are more saline. In the present study, most of our samples (71%) were harvested in areas with ≥30 ppt, with only 4.5% of them obtained from areas with ≤25 ppt water salinity. The samples harboring >104 V. parahaemolyticus/g were found in the salinity range of 33 to 35 ppt, while V. parahaemolyticus organisms carrying tdh were isolated from shellfish harvested in seawater with salinity measurements of 35 to 36.5 ppt.
Comparing the results from the three NZ V. parahaemolyticus surveys (Fig. 6 and Table 1), higher numbers were recorded in 2008 to 2013 than in the 1980s, and SST had a larger influence on the numbers (i.e., steeper slope). In previous NZ studies, the lack of relationship between SST and V. parahaemolyticus was assumed to be due to the relatively few samples analyzed and the narrow range of temperature where samples were collected (8). It is not clear if the differences between studies were due to the different methods used, which included the use of different enrichment broths (i.e., salt polymyxin broth and APW) and confirmatory tests (i.e., VP medium, API 20NE, and PCR), or whether they represent a real increase in numbers over the 30-year period, which could be related to higher average SST.
All shellfish from the South Island (areas G and H) had a low incidence and numbers of V. parahaemolyticus. In these areas, all of the shellfish were grown subtidally, whereas Pacific oysters were grown intertidally in all other areas. However, the effect of production method on V. parahaemolyticus numbers could not be evaluated in this study, as no samples of the same species were harvested from similar shellfish-growing areas while being grown under different conditions (i.e., tide exposure or distance from the sea floor). Previous NZ work did not show any impact on V. parahaemolyticus concentration when intertidal oyster samples were collected from bags, racks, or sticks or at different distances from the sea floor (8), but a survey carried out in the Pacific Northwest and Atlantic regions (38) showed that oysters harvested from intertidal sites harbored higher numbers of V. parahaemolyticus strains carrying tdh or trh as well as total V. parahaemolyticus than those harvested by dredging.
Conclusions.
This study increases the knowledge of V. parahaemolyticus ecology and distribution in NZ shellfish, identifying conditions (SST) and times (December to May) where high numbers might be present.
By extending the length of the study, the number of harvest areas, and the shellfish species included, we could identify the influence of specific environmental parameters on the abundance of the microorganism. The results indicate that the incidence of V. parahaemolyticus has increased over a 30-year period. However, considerably more research is required to be able to predict when V. parahaemolyticus numbers will be high or low. The study shows that the environmental factors that influence the numbers of total V. parahaemolyticus and tdh or trh strains of V. parahaemolyticus are complex and may be site specific.
Furthermore, we have produced data that the presence of V. parahaemolyticus in NZ Pacific oysters harvested in North Island areas can be high when SSTs are elevated, but that V. parahaemolyticus strains harboring tdh or trh are rarely present. There is no evidence of human health risk from tdh or trh strains of V. parahaemolyticus in commercially grown NZ shellfish.
A seasonal correlation for North Island shellfish-growing areas was observed. Using a temperature of 19°C as a risk trigger parameter might be useful should growers wish to harvest oysters in the summer months in the different locations, but they must be sure to comply with U.S. regulatory limits of 10,000/g. The results presented here also provide information that can help the seafood industry to tailor risk management measures for specific shellfish-growing areas if the needs arise.
Supplementary Material
ACKNOWLEDGMENTS
We are grateful to the NZ oyster and mussel industries for providing samples and environmental data, to Jessicah Win, Hima Reddy, Lucia Kreczi, Jennifer Arlidge, and Swapna Gannabathula for technical assistance, and to Simon Brown for assistance with sampling. We are also thankful to Jessica Jones (U.S. FDA), Anneke van Laanen (Cawthron Institute), and Muriel Dufour (ESR) for expert technical advice. The Cawthron Institute analyzed samples from site G.
This work was funded by The New Zealand Ministry of Business, Innovation, and Employment (MBIE) (contract CAWX0301).
Footnotes
Supplemental material for this article may be found at http://dx.doi.org/10.1128/AEM.04020-14.
REFERENCES
- 1.Hlady WG, Klontz KC. 1996. The epidemiology of Vibrio infections in Florida, 1981-1993. J Infect Dis 173:1176–1183. doi: 10.1093/infdis/173.5.1176. [DOI] [PubMed] [Google Scholar]
- 2.CDC. 2013. Incidence and trends of infection with pathogens transmitted commonly through food–Foodborne Diseases Active Surveillance Network, 10 U.S. sites, 1996-2012. MMWR Morb Mortal Wkly Rep 62:283–287. [PMC free article] [PubMed] [Google Scholar]
- 3.Thornton V, Hazell W, Simmons G. 2002. Acute gastroenteritidis associated with seafood privately imported from the Pacific Islands. N Z Med J 1154:234–236. [PubMed] [Google Scholar]
- 4.WHO. 2011. Risk assessment of Vibrio parahaemolyticus in seafood. Microbiological risk assessment series. WHO, Geneva, Switzerland: http://www.who.int/foodsafety/publications/micro/MRA_16_JEMRA.pdf. [Google Scholar]
- 5.Cawley P, Norris D. 1973. Isolation of Vibrio parahaemolyticus in New Zealand. N Z Med J 78:107. [PubMed] [Google Scholar]
- 6.Fletcher GC. 1985. The potential food poisoning hazard of Vibrio parahaemolyticus in New Zealand oysters. N Z J Mar Freshwater Res 19:12. [Google Scholar]
- 7.Lake R, Hudson A, Cressey P. 2003. Risk profile: Vibrio parahaemolyticus in seafood. Institute of Environmental Science and Research Ltd., Christchurch, New Zealand. [Google Scholar]
- 8.Kirs M, Depaola A, Fyfe R, Jones JL, Krantz J, Van Laanen A, Cotton D, Castle M. 2011. A survey of oysters (Crassostrea gigas) in New Zealand for Vibrio parahaemolyticus and Vibrio vulnificus. Int J Food Microbiol 147:149–153. doi: 10.1016/j.ijfoodmicro.2011.03.012. [DOI] [PubMed] [Google Scholar]
- 9.McLaughlin JB, DePaola A, Bopp CA, Martinek KA, Napolilli NP, Allison CG, Murray SL, Thompson EC, Bird MM, Middaugh JP. 2005. Outbreak of Vibrio parahaemolyticus gastroenteritis associated with Alaskan oysters. N Engl J Med 353:1463–1470. doi: 10.1056/NEJMoa051594. [DOI] [PubMed] [Google Scholar]
- 10.Fuenzalida L, Hernandez C, Toro J, Rioseco ML, Romero J, Espejo RT. 2006. Vibrio parahaemolyticus in shellfish and clinical samples during two large epidemics of diarrhoea in southern Chile. Environ Microbiol 8:675–683. doi: 10.1111/j.1462-2920.2005.00946.x. [DOI] [PubMed] [Google Scholar]
- 11.Gonzalez-Escalona N, Cachicas V, Acevedo C, Rioseco ML, Vergara JA, Cabello F, Romero J, Espejo RT. 2005. Vibrio parahaemolyticus diarrhea, Chile, 1998 and 2004. Emerg Infect Dis 11:129–131. doi: 10.3201/eid1101.040762. [DOI] [PMC free article] [PubMed] [Google Scholar]
- 12.Martinez-Urtaza J, Huapaya B, Gavilan RG, Blanco-Abad V, Ansede-Bermejo J, Cadarso-Suarez C, Figueiras A, Trinanes J. 2008. Emergence of Asiatic Vibrio diseases in South America in phase with El Nino. Epidemiology 19:829–837. doi: 10.1097/EDE.0b013e3181883d43. [DOI] [PubMed] [Google Scholar]
- 13.Folland CK, Salinger MJ. 1995. Surface temperature trends and variations in New Zealand and the surrounding ocean, 1871-1993. Int J Climatol 15:1195–1218. doi: 10.1002/joc.3370151103. [DOI] [Google Scholar]
- 14.Kaysner CA, DePaola A. 2004. Vibrio. In Bacteriological analytical manual, 9th ed. US FDA, Washington, DC. [Google Scholar]
- 15.Cruz CD, Win JK, Fletcher GC. 2013. An improved method for quantification of Vibrio vulnificus in oysters. J Microbiol Methods 95:397–399. doi: 10.1016/j.mimet.2013.07.024. [DOI] [PubMed] [Google Scholar]
- 16.Kim YB, Okuda J, Matsumoto C, Takahashi N, Hashimoto S, Nishibuchi M. 1999. Identification of Vibrio parahaemolyticus strains at the species level by PCR targeted to the toxR gene. J Clin Microbiol 37:1173–1177. [DOI] [PMC free article] [PubMed] [Google Scholar]
- 17.Shirai H, Ito H, Hirayama T, Nakamoto Y, Nakabayashi N, Kumagai K, Takeda Y, Nishibuchi M. 1990. Molecular epidemiologic evidence for association of thermostable direct hemolysin (TDH) and TDH-related hemolysin of Vibrio parahaemolyticus with gastroenteritis. Infect Immun 58:3568–3573. [DOI] [PMC free article] [PubMed] [Google Scholar]
- 18.Tada J, Ohashi T, Nishimura N, Shirasaki Y, Ozaki H, Fukushima S, Takano J, Nishibuchi M, Takeda Y. 1992. Detection of the thermostable direct hemolysin gene (tdh) and the thermostable direct hemolysin-related hemolysin gene (trh) of Vibrio parahaemolyticus by polymerase chain reaction. Mol Cell Probes 6:477–487. doi: 10.1016/0890-8508(92)90044-X. [DOI] [PubMed] [Google Scholar]
- 19.Blodgett R. 2006. Most probable number from serial dilutions. Bacteriological analytical manual, appendix 2. US FDA, Washington, DC: http://www.fda.gov/Food/FoodScienceResearch/LaboratoryMethods/ucm109656.htm. [Google Scholar]
- 20.New Zealand Food Safety Authority. 2006. Animal products (specifications for bivalve molluscan shellfish), p 77 Notice 2006 New Zealand Food Safety Authority, Wellington, New Zealand. [Google Scholar]
- 21.Hara-Kudo Y, Nishina T, Nakagawa H, Konuma H, Hasegawa J, Kumagai S. 2001. Improved method for detection of Vibrio parahaemolyticus in seafood. Appl Environ Microbiol 67:5819–5823. doi: 10.1128/AEM.67.12.5819-5823.2001. [DOI] [PMC free article] [PubMed] [Google Scholar]
- 22.Martinez-Urtaza J, Lozano-Leon A, Varela-Pet J, Trinanes J, Pazos Y, Garcia-Martin O. 2008. Environmental determinants of the occurrence and distribution of Vibrio parahaemolyticus in the rias of Galicia, Spain. Appl Environ Microbiol 74:265–274. doi: 10.1128/AEM.01307-07. [DOI] [PMC free article] [PubMed] [Google Scholar]
- 23.Parveen S, Hettiarachchi KA, Bowers JC, Jones JL, Tamplin ML, McKay R, Beatty W, Brohawn K, Dasilva LV, Depaola A. 2008. Seasonal distribution of total and pathogenic Vibrio parahaemolyticus in Chesapeake Bay oysters and waters. Int J Food Microbiol 128:354–361. doi: 10.1016/j.ijfoodmicro.2008.09.019. [DOI] [PubMed] [Google Scholar]
- 24.Johnson CN, Flowers AR, Noriea NF III, Zimmerman AM, Bowers JC, DePaola A, Grimes DJ. 2010. Relationships between environmental factors and pathogenic vibrios in the Northern Gulf of Mexico. Appl Environ Microbiol 76:7076–7084. doi: 10.1128/AEM.00697-10. [DOI] [PMC free article] [PubMed] [Google Scholar]
- 25.Julie D, Solen L, Antoine V, Jaufrey C, Annick D, Dominique HH. 2010. Ecology of pathogenic and nonpathogenic Vibrio parahaemolyticus on the French Atlantic coast. Effects of temperature, salinity, turbidity and chlorophyll a. Environ Microbiol 12:929–937. doi: 10.1111/j.1462-2920.2009.02136.x. [DOI] [PubMed] [Google Scholar]
- 26.Sobrinho PS, Destro MT, Franco BD, Landgraf M. 2010. Correlation between environmental factors and prevalence of Vibrio parahaemolyticus in oysters harvested in the southern coastal area of Sao Paulo State, Brazil. Appl Environ Microbiol 76:1290–1293. doi: 10.1128/AEM.00861-09. [DOI] [PMC free article] [PubMed] [Google Scholar]
- 27.Igbinosa EO, Obi CL, Okoh AI. 2011. Seasonal abundance and distribution of Vibrio species in the treated effluent of wastewater treatment facilities in suburban and urban communities of Eastern Cape Province, South Africa. J Microbiol 49:224–232. doi: 10.1007/s12275-011-0227-x. [DOI] [PubMed] [Google Scholar]
- 28.Oberbeckmann S, Wichels A, Wiltshire KH, Gerdts G. 2011. Occurrence of Vibrio parahaemolyticus and Vibrio alginolyticus in the German Bight over a seasonal cycle. Antonie Van Leeuwenhoek 100:291–307. doi: 10.1007/s10482-011-9586-x. [DOI] [PubMed] [Google Scholar]
- 29.DePaola A, Nordstrom JL, Bowers JC, Wells JG, Cook DW. 2003. Seasonal abundance of total and pathogenic Vibrio parahaemolyticus in Alabama oysters. Appl Environ Microbiol 69:1521–1526. doi: 10.1128/AEM.69.3.1521-1526.2003. [DOI] [PMC free article] [PubMed] [Google Scholar]
- 30.Young I, Gropp K, Fazil A, Smith BA. 27 June 2014. Knowledge synthesis to support risk assessment of climate change impacts on food and water safety: a case study of the effects of water temperature and salinity on Vibrio parahaemolyticus in raw oysters and harvest waters. Food Res Int doi: 10.1016/j.foodres.2014.06.035. [DOI] [Google Scholar]
- 31.Moore JG, Ruple A, Ballenger-Bass K, Bell S, Pennington PL, Scott GI. 2014. Snapshot of Vibrio parahaemolyticus densities in open and closed shellfish beds in coastal South Carolina and Mississippi. Environ Monit Assess 186:7949–7960. doi: 10.1007/s10661-014-3979-z. [DOI] [PubMed] [Google Scholar]
- 32.Turner JW, Malayil L, Guadagnoli D, Cole D, Lipp EK. 2014. Detection of Vibrio parahaemolyticus, Vibrio vulnificus and Vibrio cholerae with respect to seasonal fluctuations in temperature and plankton abundance. Environ Microbiol 16:1019–1028. doi: 10.1111/1462-2920.12246. [DOI] [PubMed] [Google Scholar]
- 33.López-Hernández KM, Pardío-Sedas VT, Lizárraga-Partida L, Williams JD, Martínez-Herrera JD, Flores-Primo A, Uscanga-Serrano R, Rendón-Castro K. 12 December 2014. Environmental parameters influence on the dynamics of total and pathogenic Vibrio parahaemolyticus densities in Crassostrea virginica harvested from Mexico's Gulf coast. Mar Pollut Bull doi: 10.1016/j.marpolbul.2014.11.015. [DOI] [PubMed] [Google Scholar]
- 34.Zimmerman AM, DePaola A, Bowers JC, Krantz JA, Nordstrom JL, Johnson CN, Grimes DJ. 2007. Variability of total and pathogenic Vibrio parahaemolyticus densities in northern Gulf of Mexico water and oysters. Appl Environ Microbiol 73:7589–7596. doi: 10.1128/AEM.01700-07. [DOI] [PMC free article] [PubMed] [Google Scholar]
- 35.Johnson CN, Bowers JC, Griffitt KJ, Molina V, Clostio RW, Pei S, Laws E, Paranjpye RN, Strom MS, Chen A, Hasan NA, Huq A, Noriea NF III, Grimes DJ, Colwell RR. 2012. Ecology of Vibrio parahaemolyticus and Vibrio vulnificus in the coastal and estuarine waters of Louisiana, Maryland, Mississippi, and Washington (United States). Appl Environ Microbiol 78:7249–7257. doi: 10.1128/AEM.01296-12. [DOI] [PMC free article] [PubMed] [Google Scholar]
- 36.Depaola A, Jones JL, Noe KE, Byars RH, Bowers JC. 2009. Survey of postharvest-processed oysters in the United States for levels of Vibrio vulnificus and Vibrio parahaemolyticus. J Food Prot 72:2110–2113. [DOI] [PubMed] [Google Scholar]
- 37.Ramos RJ, Miotto LA, Miotto M, Silveira Junior N, Cirolini A, Silva HS, Rodrigues Ddos P, Vieira CR. 2014. Occurrence of potentially pathogenic Vibrio in oysters (Crassostrea gigas) and waters from bivalve mollusk cultivations in the South Bay of Santa Catarina. Rev Soc Bras Med Trop 47:327–333. doi: 10.1590/0037-8682-0069-2014. [DOI] [PubMed] [Google Scholar]
- 38.FDA. 2005. Quantitative risk assessment on the public health impact of pathogenic Vibrio parahaemolyticus in raw oysters. US FDA, Washington, DC. [Google Scholar]
Associated Data
This section collects any data citations, data availability statements, or supplementary materials included in this article.