Background: Activity-regulated cytoskeleton-associated protein (Arc) transcription is activated by BDNF.
Results: BDNF activated the Arc proximal promoter, whereas class I histone deacetylases (HDACs) inhibited this activation.
Conclusion: Class I HDACs repress BDNF-induced Arc transcription through its serum response element-containing proximal promoter.
Significance: Neuronal Arc expression is regulated by chromatin structure, which may lead to long-lasting changes in neuronal functions.
Keywords: brain-derived neurotrophic factor (BDNF), histone deacetylase 1 (HDAC1), neuron, receptor tyrosine kinase, transcription regulation, activity-regulated cytoskeleton-associated protein
Abstract
We examined the transcriptional regulation of the activity-regulated cytoskeleton-associated protein gene (Arc), focusing on BDNF-induced Arc expression in cultured rat cortical cells. Although the synaptic activity-responsive element (SARE), located −7 kbp upstream of the Arc transcription start site, responded to NMDA, BDNF, or FGF2, the proximal region of the promoter (Arc/−1679) was activated by BDNF or FGF2, but not by NMDA, suggesting the presence of at least two distinct Arc promoter regions, distal and proximal, that respond to extracellular stimuli. Specificity protein 4 (SP4) and early growth response 1 (EGR1) controlled Arc/−1679 transcriptional activity via the region encompassing −169 to −37 of the Arc promoter. We found that trichostatin A (TSA), a histone deacetylase (HDAC) inhibitor, significantly enhanced the inductive effects of BDNF or FGF2, but not those of NMDA on Arc expression. Inhibitors of class I/IIb HDACs, SAHA, and class I HDACs, MS-275, but not of class II HDACs, MC1568, enhanced BDNF-induced Arc expression. The enhancing effect of TSA was mediated by the region from −1027 to −1000 bp, to which serum response factor (SRF) and HDAC1 bound. The binding of HDAC1 to this region was reduced by TSA. Thus, Arc expression was suppressed by class I HDAC-mediated mechanisms via chromatin modification of the proximal promoter whereas the inhibition of HDAC allowed Arc expression to be markedly enhanced in response to BDNF or FGF2. These results contribute to our understanding of the physiological role of Arc expression in neuronal functions such as memory consolidation.
Introduction
The gene encoding activity-regulated cytoskeleton-associated protein (Arc),3 also known as the activity-regulated gene of 3.1 kb (Arg3.1), is an immediate early gene (IEG), the expression of which is rapidly activated in response to neuronal activity (1, 2). In neurons, Arc expression is regulated by various stimuli including not only neuronal activity, but also BDNF, cAMP, and PDGF (3–6). Arc mRNA has been detected in cell bodies, dendrites, and spines after stimulation (7, 8), and the Arc protein could be synthesized locally at dendritic spines (9, 10). Arc is known to be required for the endocytosis of AMPA receptors (10) and for long-term potentiation (LTP)-induced F-actin stabilization (9, 11). Okuno et al. (12) reported that Arc plays a role in the inverse synaptic tagging of silent synapses; Arc accumulated in silent synapses to reduce surface AMPA receptors (12). Thus, Arc is a unique molecule involved in the control of synaptic plasticity (10, 13, 14).
Kawashima et al. (4) demonstrated that a distal enhancer, synaptic activity-responsive element (SARE), which contains binding sites for cAMP-response element (CRE)-binding protein (CREB), myocyte enhancer factor 2 (MEF2), and serum response factor (SRF), located −7 kbp upstream of the Arc transcription start site, was essential for activity-dependent transcriptional activation of Arc (4). In addition, Pintchovski et al. (5) reported that a serum response element (SRE) located in SARE, and a Zeste-like element were also involved in the transcriptional activation of the Arc promoter. Li et al. (15) also demonstrated the involvement of early growth response (EGR) family transcription factors in the expression of Arc in vivo. On the other hand, evidence has accumulated to show that Arc expression is involved in the control of memory consolidation in accordance with the actions of BDNF (9, 16–18). A previous study in rats reported two waves of Arc induction in the hippocampus after a single spatial exploration, the second one of which spanned the interval from 8 to 24 h post-exploration (19), and may involve the actions of BDNF in local translation at spines (9). However, it currently remains unclear how Arc expression is regulated by neuronal activity or BDNF in terms of synaptic plasticity.
In this present study, we focused on transcriptional regulation of Arc in response to BDNF in cultured rat cortical cells and found that the proximal region of the Arc promoter controlled transcription in response to BDNF or FGF2, but that neuronal activity did not affect transcription to the same extent. We also assigned the regions responsible for the basal and BDNF-induced activation of Arc transcription in the proximal Arc promoter, the locations of which differed from those reported by Pintchovski et al. (5). Through these regions, Arc transcription was controlled by class I histone deacetylase (HDAC). The repressive states of these regions regulated the responsiveness of Arc transcription to BDNF or FGF2. The results of the present study demonstrate novel regulation of Arc expression mediated by receptor tyrosine kinase (RTK) signaling in neurons. This regulation is related to the repressive activity of chromatin, and may provide a better understanding of the role of Arc expression in long-lasting changes of neuronal functions such as memory consolidation.
EXPERIMENTAL PROCEDURES
Reagents
K252a, U0126, NMDA, dl-2-amino-5-phosphopentanoic acid (dl-APV), trichostatin A (TSA), SAHA, and MC1568 were purchased from Sigma-Aldrich, MS-275 was from Focus Biomolecules (Plymouth Meeting, PA), FGF2 was from Miltenyi Biotec (Bergisch Gladbach, Germany). BDNF was generously donated by Dainippon Sumitomo Pharma Co., Ltd. (Osaka, Japan).
Cell Culture
Primary cultures of rat cortical neuronal cells were prepared from the cerebral cortices of 17-day-old Sprague-Dawley rat embryos (Japan SLC, Shizuoka, Japan) as previously described (20). Animal care and all experiments were carried out in accordance with the Guidelines for the Care and Use of Laboratory Animals of the University of Toyama. Dissociated cells were suspended in DMEM (Invitrogen, Carlsbad, CA) containing 10% FCS, and 100 μg/ml kanamycin (Invitrogen) and were seeded at 1.8 × 10⁶ cells in 35-mm culture dishes (for quantitative RT-PCR analysis and promoter analysis) (Asahi Techno Glass, Tokyo, Japan) or 5 × 10⁶ cells in 60-mm culture dishes (for chromatin immunoprecipitation (ChIP) assay) (Asahi Techno Glass). Culture dishes were coated with poly-l-lysine (Sigma-Aldrich). Cells were grown for 2 days and the medium was then replaced with transferrin-insulin-sodium selenite (TIS) medium (serum-free DMEM containing 4.5 mg/ml glucose, 5 μg/ml transferrin, 5 μg/ml insulin, 5 ng/ml sodium selenite, 1 mg/ml BSA, 100 μg/ml kanamycin sulfate), and 0.2 μm cytosine arabinoside (Ara-C, Sigma-Aldrich). The medium was replaced 1 day later with Ara-C-free TIS medium.
Quantitative RT-PCR
RNA was isolated from cultured cells using a previously described protocol (20, 21). Briefly, total RNA was isolated using TRIsure (BIOLINE, London, UK). One microgram of RNA was reverse-transcribed into cDNA using SuperScript II reverse transcriptase (Invitrogen), as previously described (20, 21). Quantitative PCR amplification was performed using the Stratagene Mx3000p Real-Time PCR system (Agilent Technologies, Inc., Santa Clara, CA), as previously described (20, 21). Standard curves were generated for each gene using a plasmid dilution series containing the target sequences. The threshold cycle for each sample was taken from the linear range and converted to the starting amount by interpolation from a standard curve. The levels of Arc and Bdnf exon I-IX mRNAs were normalized to that of glyceraldehyde-3-phosphate dehydrogenase (Gapdh). The primer sequences were as follows: Gapdh; 5′-ATCGTGGAAGGGCTCATGAC-3′ and 5′-TAGCCCAGGATGCCCTTTAGT-3′, Arc; 5′-CGCTGGAAGAAGTCCATCAA-3′ and 5′-GGGCTAACAGTGTAGTCGTA-3′, Bdnf exon I-IX; 5′-GACACATTACCTTCCAGCATC-3′ and 5′-GCCCATTCACGCTCTCCA-3′.
Plasmids
We used the reporter plasmid, pGL4.12-Luc2CP (Promega) to measure Arc promoter activity. pGL4.12-rat Arc promoter/−1679 (pGL4.12-Arc/−1679) was generated by inserting the rat Arc promoter fragment −1679 bp to +95 bp, amplified by PCR with the specific primers: 5′-ATGGTACCCTGCCTTCTGTGTCCGCCTACT-3′ and 5′-ATGAGCTCTGCCGGAGGAGCTTAGCGAGTGT-3′, into the KpnI/SacI sites of pGL4.12-Luc2CP. The 5′-deleted mutant promoters, pGL4.12-Arc/−1374, Arc/−1139, Arc/−1107, Arc/−1067, Arc/−987, Arc/−940, Arc/−787, Arc/−659, Arc/−249, Arc/−169, Arc/−93, Arc/−65, and Arc/−37 were generated by inserting the corresponding regions into the KpnI/SacI sites of the vector. pGL4.12-Arc/−1030 and Arc/−203 were generated by inserting the regions into the BglII/SacI sites of the vector. These regions were amplified by PCR with the common reverse primer: 5′- ATGAGCTCTGCCGGAGGAGCTTAGCGAGTGT-3′ and 5′-specific forward primers: Arc/−1374: 5′-TAATGGTACCGTGAGTGGAGGCATGAGTCTACAGAG-3′, Arc/−1249: 5′-TAATGGTACCAGGGGGAGTTGACAAAGAGGGAAAGG-3′, Arc/−1139: 5′-TAATGGTACCGGAAGACCTAGACCCATGTATCTGGC-3′, Arc/−1107: 5′-TAATGGTACCTAAGCCAAGAAAGATGCCCTCC-3′, Arc/−1067: 5′-TAATGGTACCTGTTGCCAGGGAATCGGAAG-3′, Arc/−1030: 5′-ATAGATCTGAATCTCAGCTTCCGGAGCCCCATT-3′ Arc/−987: 5′-TAATGGTACCTTTCCTCTGCTGGCTCCTTCC-3′, Arc/−940: 5′-TAATGGTACCGTCCTCCAGTCTAACCTCTTAGAAGTCTTG-3′, Arc/−787: 5′-ATGGTACCCAGGGCACTGCAGGCTACTGAC-3′, Arc/−659: 5′-ATGGTACCGACTTATGACTCTTGGGGCAATGATG-3′, Arc/−249: 5′-ATGGTACCAAGATCCCTCCGGGTGGGAGGC-3′, Arc/−203: 5′-ATAGATCTCCGGGCTGTGAAGGGGCG-3′; Arc/−169: 5′-TAATGGTACCCGCGGAAGGGGAGCGAGTAG-3′, Arc/−93: 5′-TAATGGTACCGCCTGGGCGCGGCCAATG-3′, Arc/−65: 5′-TAATGGTACCCTCCGCGAGCTGCCGCC-3′, and Arc/−37: 5′-TAATGGTACCCGCAGCATAAAAAGCCGCCGGTG-3′.
Internally deleted promoters were generated using the KOD-Plus-Mutagenesis Kit (Toyobo, Osaka, Japan), according to the manufacturer's instructions. The primer sequences used were as follows; Arc/Δ−1100∼−1083: 5′-ACTGCACCACAGCGCTGTTGCCA-3′ and 5′-TGGCTTACACCAAGCCAGATACAT-3′, Arc/Δ−1082∼−1067: 5′-GTTGCCAGGGAATCGGAAGG-3′ and 5′-GGGGGAGGGCATCTTTCTTGGCTT-3′, Arc/Δ−1069∼−1041: 5′-CCTCTAGAGGGAATCTCAGC-3′ and 5′-GCTGTGGTGCAGTGGGGGAGGGCAT-3′, Arc/Δ−1040∼−1025: 5′-CAGCTTCCGGAGCCCCATTCCTTA-3′ and 5′-GAGGCCCCTTCCGATTCCCTG-3′, Arc/Δ−1027∼−1009: 5′-ATTCCTTATATGGCATCTTGCTTTC-3′ and 5′-TTCCCTCTAGAGGGAGGCCCCTTCCGA-3′ and Arc/Δ−1008∼−1000: 5′-ATGGCATCTTGCTTTCCTCT-3′ and 5′-GGGGCTCCGGAAGCTGAGA-3′.pGL4.11-Arc/−7000 bp and Arc/SARE were generously provided by Dr. H. Bito (Graduate School of Medicine, The University of Tokyo, Tokyo, Japan).
DNA Transfection and Measurement of Luciferase Activity
DNA transfection of cells was carried out at 3 days in vitro (DIV) using calcium phosphate/DNA precipitation as previously described (20). Briefly, calcium phosphate/DNA precipitates were prepared with one volume (67 μl) of plasmid DNA (6 μg, F-luc:R-luc = 10:1). In the experiment using ZnEGR1, ZnEGR3, and SP4 shRNA (shSP4), 2 μg of the reporter plasmid (F-luc:R-luc = 10:1) and 4 μg of the expression vector (Empty vector, ZnEGR1, ZnEGR3, pSuper, or shSP4) were co-transfected. The knockdown of SP4 was performed as previously described (22). The ZnEGR1 and ZnEGR3 expression vectors were generously provided by Dr. J. M. Baraban (The Johns Hopkins University). Plasmid DNA was dissolved in a 250 mm CaCl2 solution with an equal volume of 2 × HEPES-buffered saline, and added to cells in a 35-mm dish. After 30 min, the dish was washed two times with phosphate-buffered saline (PBS) and replenished with fresh TIS medium. After 40 h, transfected cells were treated with BDNF or vehicle for 6 h, and the lysate was extracted with 1× passive lysis buffer (Promega). In the experiment using shSP4, neurons were treated with BDNF 72 h after DNA transfection. Dual (firefly and Renilla) luciferase activity was measured using the Dual-luciferase Reporter Assay System (Promega) with the TD-20/20 Luminometer (Promega).
ChIP Assay
ChIP assays were performed using the Magna ChIP A Kit (Millipore, Billerica, MA), according to the manufacturer's instructions. Approximately 1 × 10⁷ cells were used for each ChIP assay. Briefly, cells were cross-linked with 1% formaldehyde in culture medium for 10 min at room temperature. Cells were pelleted by centrifugation and then resuspended in cell lysis buffer. After cell lysis, lysates were centrifuged to pellet nuclei, and these were then resuspended in nuclear lysis buffer for sonication. These lysates were sonicated to share cross-linked DNA. After centrifugation, the supernatant (∼1 × 10⁶ cell equivalents of lysate) was diluted, and mixed with protein A magnetic beads and a specific antibody (10 μg of anti-EGR1 (558X, Santa Cruz Biotechnology, Dallas, TX), 10 μg of anti-SP4 (v-20X, Santa Cruz Biotechnology), 10 μg of anti-SRF (G-20X, Santa Cruz Biotechnology), or 3 μl of anti-HDAC1 (17–10199, Millipore)) overnight at 4 °C with rotation. The precipitated protein/DNA complex was washed and eluted in elution buffer with proteinase K. The eluted DNA was purified by a spin filter. The purified DNA was amplified using KOD FX DNA polymerase (Toyobo). The primer sequences used were as follows: Region-1; 5′-CAGTGATATGTCCCCAAGTAACATC-3′ and 5′-CCAGAAGCTTCAAGACTTCTAAGAG-3′, Region-2; 5′-GTCACTCCGGGCTGTGAA-3′ and 5′-GGCGGCTTTTTATGCTGCG-3′. PCR products were separated on 2% agarose gels. The amplification of Region-2 was also performed using the Stratagene Mx3000p Real-Time PCR system (Agilent Technologies) with a SYBR Select Master Mix (Invitrogen).
Statistics
All values represent the mean ± S.E. for the number of separate experiments performed in duplicate, as indicated in the corresponding figures. Statistical analyses were performed using a one-way ANOVA with Sheffe's F test. Student's t test followed by the F test was also used (Figs. 1, D–F, 4A, and 8B).
FIGURE 1.
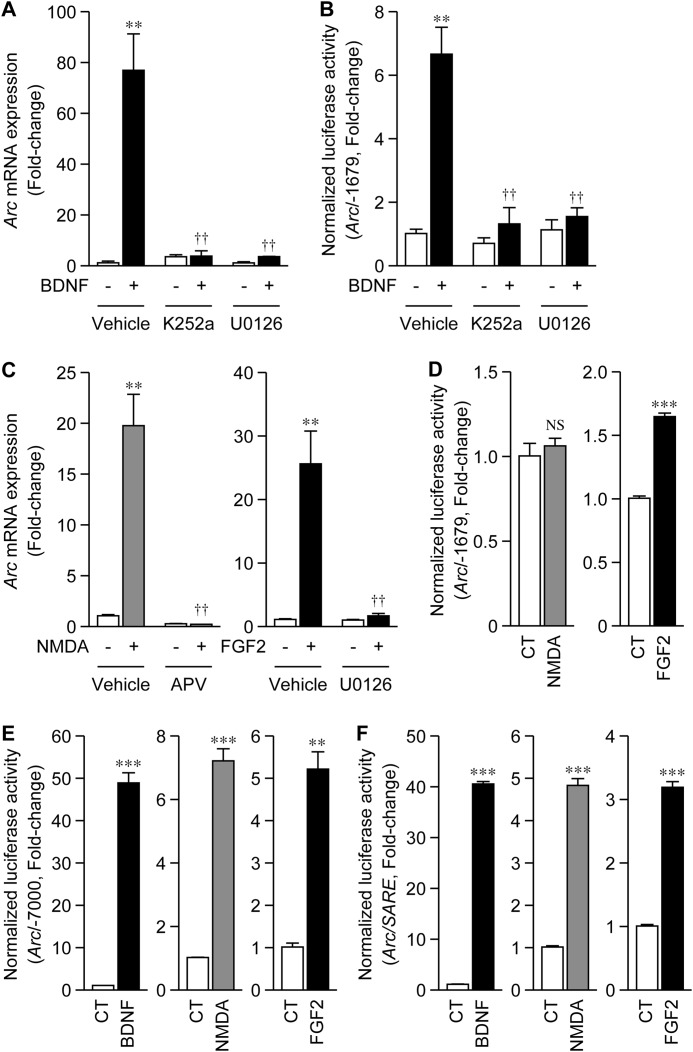
Proximal region of the Arc promoter was activated by RTK signaling. A, change in Arc mRNA levels with BDNF treatment. At 5 DIV, cortical cells were treated with 100 ng/ml BDNF, and total RNA was extracted 1 h after treatment. Ten minutes before BDNF treatment, 200 nm K252a or 20 μm U0126 was added to the cells. The change in Arc mRNA levels was investigated using quantitative RT-PCR. Values represent the mean ± S.E. (n = 3). **, p < 0.01 versus control (the sample without BDNF). ††, p < 0.01 versus vehicle (the same sample without inhibitors). B, change in Arc/−1679 activity with BDNF treatment. To measure the promoter activity of Arc/−1679, reporter plasmids were transfected into cultured cortical cells at 3 DIV. Forty hours after transfection, cells were treated with BDNF, and cell lysates were prepared 6 h after treatment. K252a or U0126 was added to cells 10 min before BDNF treatment. Values represent the mean ± S.E. (n = 5–7). **, p < 0.01 versus control. ††, p < 0.01 versus vehicle. C and D, change in Arc mRNA levels (C) and Arc/−1679 activity (D) upon the treatment of cells with 100 μm NMDA or 100 ng/ml FGF2. APV (200 μm) or U0126 was added to cells 10 min before treatment (C). Values represent the mean ± S.E. (n = 3–4). **, p < 0.01 and ***, p < 0.001 versus control. ††, p < 0.01 versus vehicle. NS: not significant. E and F, change in Arc/−7000 (E) or Arc/SARE (F) activity upon treatment of cells with BDNF, NMDA, or FGF2. Values represent the mean ± S.E. (n = 3–4). **, p < 0.01 and ***, p < 0.001 versus control.
FIGURE 4.
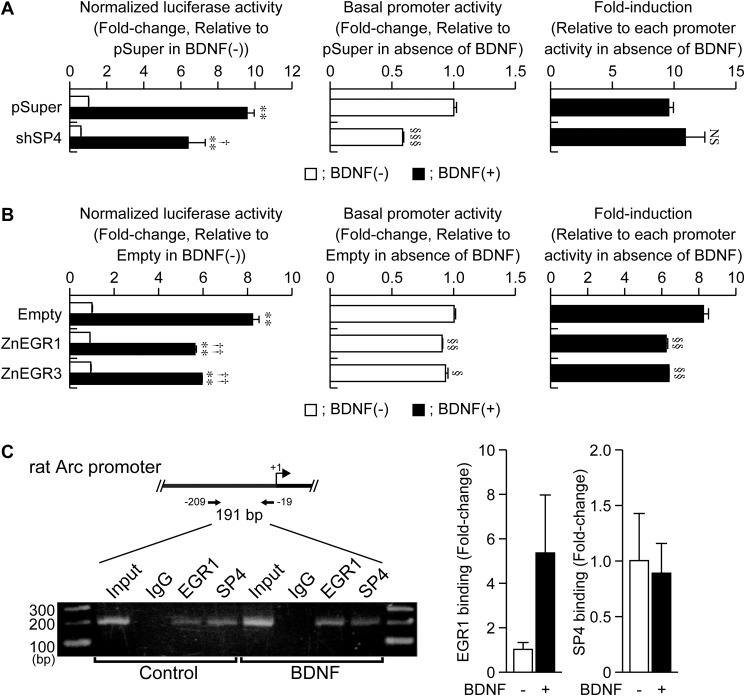
Involvement of SP4 and EGR1 in the BDNF-induced activation of Arc/−1679. A and B, effect of endogenous SP4 knockdown (A) or overexpression of dominant negative EGR (ZnEGR1 or ZnEGR3) (B) on the BDNF-induced activation of Arc/−1679. At 3 DIV, an expression vector of SP4 shRNA (shSP4), ZnEGR1, or ZnEGR3 was co-transfected with reporter plasmids into cells. Seventy-two hours (A) or 40 h (B) after the DNA transfection, cells were treated with BDNF for 6 h, and cell lysates were extracted for the dual-luciferase assay. Values represent the mean ± S.E. (n = 3). **, p < 0.01 versus control (the sample without BDNF). †, p < 0.05 and ††, p < 0.01 versus pSuper (A) or empty vector (B) in the presence of BDNF. The basal activity and fold-induction were also shown. §, p < 0.05, §§, p < 0.01, and §§§, p < 0.001 versus pSuper (A) or empty vector (B). NS: not significant. C, binding of EGR1 and SP4 to Region-2. At 5 DIV, cells were treated with BDNF for 30 min, and then cross-linked with 1% formaldehyde for ChIP assays. After immunoprecipitation, purified DNA was amplified by PCR, and the product was separated on 2% agarose gels. Purified DNA was also amplified by real-time PCR. Values represent the mean ± S.E. (n = 3–4).
FIGURE 8.
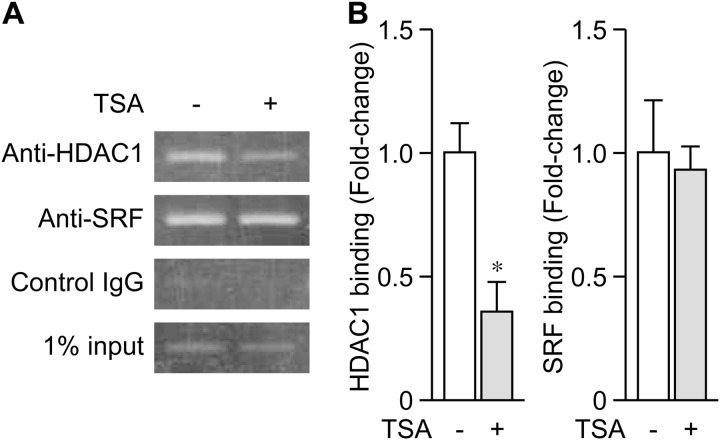
Changes in the binding of HDAC1 to Region-1 upon TSA treatment. At 5 DIV, cultured cortical cells were treated with TSA for 24 h, and then cross-linked with 1% formaldehyde for ChIP assays. After immunoprecipitation with anti-HDAC1, anti-SRF, or control IgG, purified DNA was amplified by PCR, and products were separated on 2% agarose gels (A). Purified DNA was also amplified by real-time PCR (B). Values represent the mean ± S.E. (n = 3). *, p < 0.05 versus control (the sample without TSA).
RESULTS
Proximal Region of the Arc Promoter Was Activated by BDNF or FGF2, but Not by NMDA Receptor Activation
We investigated changes in the expression of Arc mRNA following treatment of primary cultures of rat cortical cells with BDNF. As shown in Fig. 1A, Arc expression was markedly induced 1 h after BDNF treatment, and the induction was abolished by the addition of K252a or U0126, inhibitors of tropomyosin-related kinase (Trk) signaling and MEK1/2, respectively (Fig. 1A). These results indicated that the TrkB-Ras-ERK/MAPK pathway was involved in BDNF-induced Arc expression.
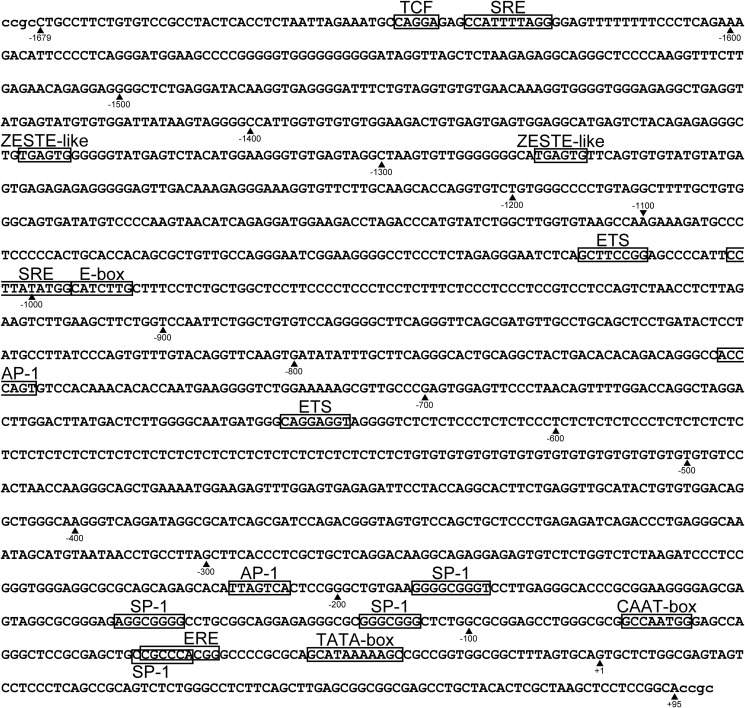
We then constructed a reporter plasmid to clarify the transcriptional regulation of Arc. We focused on the proximal region of the Arc promoter, the activation of which can be controlled by Ca2+ and cAMP signals (3). The rat Arc promoter region from −1679 to +95 bp (Fig. 2) was fused to the firefly luciferase gene (Arc/−1679). Corresponding to the induction of Arc expression (Fig. 1A), BDNF significantly activated Arc/−1679 transcription, which was abolished in the presence of K252a or U0126 (Fig. 1B).
FIGURE 2.
Sequence of the Arc proximal promoter region. The transcription start site was designed as +1. Regulatory elements were boxed (3, 5, 6, 15).
Previous studies have established that the expression of Arc is activated by neuronal activity (1, 2, 4, 5). Consistent with this finding, we found that the expression of Arc mRNA was also increased by the direct activation of NMDA receptor (NMDAR) with exogenously added NMDA (Fig. 1C). However, Arc mRNA expression was also increased by the treatment of cortical cells with FGF2 (Fig. 1C). NMDA-induced Arc expression was suppressed by APV, while that induced by FGF2 was suppressed by U0126 (Fig. 1C). The promoter activity of Arc/−1679 was activated by FGF2, but not by NMDA (Fig. 1D).
Because the distal enhancer, SARE, has been shown to play a crucial role in Arc induction (4), we measured Arc promoter activity using the Arc promoter encompassing −7 kbp upstream of the transcriptional start site (Arc/−7000) (4). Arc/−7000 was markedly activated by BDNF, and also by NMDA or FGF2 (Fig. 1E), and corresponded to the changes in the mRNA levels (Fig. 1, A and C). To investigate the role of the SARE in Arc promoter activation, we used the reporter plasmid in which the SARE fragment was fused to the minimum region of the CMV promoter (Arc/SARE) (4). Arc/SARE was also activated by BDNF, NMDA, or FGF2 (Fig. 1F), although the induction level of Arc/SARE was slightly lower than that with Arc/−7000 (Fig. 1E). These results indicated that RTK signaling, which is activated by neurotrophic or growth factors such as BDNF and FGF2, respectively, induced the expression of Arc via the distal SARE enhancer and the proximal region of the Arc promoter, whereas NMDAR activation-induced Arc expression was mainly mediated by SARE.
Identification of BDNF-responsive Elements in the Proximal Region of the Arc Promoter
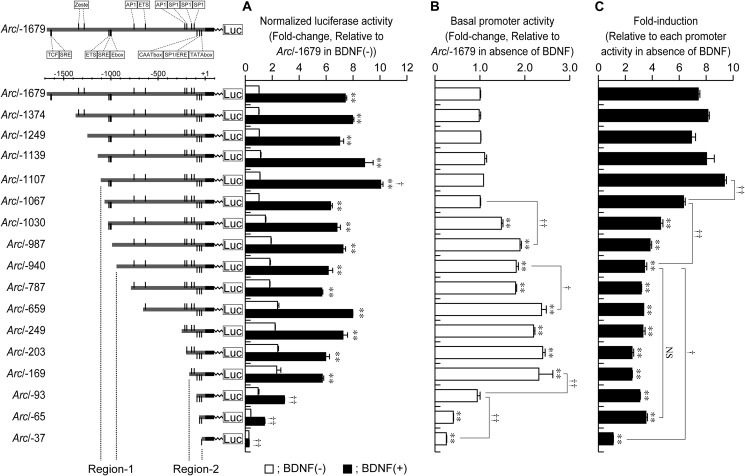
The binding sites of transcription factors, such as SRF, activator protein 1 (AP1), EGR, and specificity protein (SP) family transcription factors, have been identified in Arc/−1679 (Fig. 2) (3, 5, 6, 15). To identify the region involved in BDNF-induced Arc/−1679 activation, we constructed a series of deletion mutants of the proximal promoter (Fig. 3A). As shown in Fig. 3B, compared with Arc/−1679, the increases in basal promoter activity (promoter activity in the absence of BDNF) were significant in Arc/−1030, Arc/−987, Arc/−940, Arc/−787, Arc/−659, Arc/−249, Arc/−203, and Arc/−169. Significant decreases in basal activity were detected in Arc/−65 and Arc/−37 (Fig. 3B). In particular, the deletion of the regions encompassing −1067 to −987 bp and −940 to −659 significantly increased the basal activity (Fig. 3B), suggesting that these regions negatively regulate the Arc proximal promoter. Although the basal level of Arc/−93 was the same as that of Arc/−1679, the basal activity of Arc/−93 was significantly reduced, compared with that of Arc/−169 (Fig. 3B). Furthermore, the deletion of the region encompassing −93 to −37 significantly reduced the basal activity (Fig. 3B). This suggests that the region encompassing −169 to −37 positively regulated the Arc proximal promoter. In contrast, compared with Arc/−1679, significant reductions of BDNF-induced promoter activation (fold-induction) were observed for Arc/−1030, Arc/−987, Arc/−940, Arc/−787, Arc/−659, Arc/−249, Arc/−203, Arc/−169, Arc/−93, Arc/−65, and Arc/−37 (Fig. 3C). Notably, promoter activation was significantly reduced when the regions encompassing −1107 to −1067 bp and −1067 to −940 bp were deleted (Fig. 3C), suggesting that these regions participate in the BDNF-induced activation of the Arc proximal promoter. The promoter activity of Arc/−1249 was not significantly different to that of Arc/−1374, despite two Zeste-like elements, which have been shown to be involved in BDNF-induced Arc promoter activation (5), being deleted in Arc/−1249. Compared with the BDNF-induced activation of Arc/−940, that of Arc/−37, but not that of Arc/−65, was significantly decreased (Fig. 3C), suggesting that the region encompassing −65 to −37 bp is involved in BDNF-induced activation. Based on these statistical analyses (Fig. 3, B and C), we termed the region encompassing −1107 to −940 bp “Region-1” (Fig. 3), which could negatively regulate the basal promoter activity but positively regulate BDNF-induced activation (Fig. 3, B and C). We also termed the region encompassing −169 to −37 bp “Region-2” (Fig. 3), which could positively regulate both the basal activity and BDNF-induced activation of the promoter (Fig. 3, B and C). Although the region encompassing −940 to −659 bp negatively regulated the Arc proximal promoter (Fig. 3B), we focused on Region-1 and Region-2, which could be involved in the basal transcriptional activity and BDNF-induced activation of the Arc/−1679.
FIGURE 3.
Identification of BDNF-responsive regions in Arc/−1679. A, to identify regions contributing to the transcriptional activation of Arc/−1679, we constructed 5′-deletion mutants of the promoter. Values represent the mean ± S.E. (n = 3–6). **, p < 0.01 versus control (the sample without BDNF). †, p < 0.05 and ††, p < 0.01 versus Arc/−1679 activity in the presence of BDNF. B, basal activity of full length and 5′-deleted Arc promoters. Values represent the mean ± S.E. (n = 3–6). **, p < 0.01 versus Arc/-1679. †, p < 0.05, and ††, p < 0.01. C, fold-induction level of each promoter (Fold-induction) was calculated relative to the basal activity of each promoter. Values represent the mean ± S.E. (n = 3–6). **, p < 0.01 versus Arc/−1679. †, p < 0.05 and ††, p < 0.01. NS: not significant.
Involvement of Zinc-finger Transcription Factors, EGR1 and SP4, in the Regulation of the Arc Proximal Promoter
Region-2 is a GC-rich region and contains binding sites for transcription factors such as SP and EGR family members (Fig. 2). We previously reported that, among SP family transcription factors, SP3 and SP4 were expressed in the nuclei of cultured rat cortical cells (22). We also found that mRNA levels of Egr1, Egr2, and Egr4, but not that of Egr3, were strongly up-regulated by BDNF (23). Moreover, among the EGR family transcription factors, EGR1 and EGR3 were previously shown to be able to bind the EGR-response element (ERE) located in Region-2 (15). Therefore, we focused on SP3/4 and EGR1 in the present study. Although the expression of a dominant negative SP3 did not affect Arc/−1679 activity (data not shown), the knockdown of SP4 reduced the basal activity of Arc/−1679, but not BDNF-induced activation of the promoter (Fig. 4A). We have already demonstrated that levels of endogenous SP4 protein are decreased in the neurons transfected with shSP4, but not with control vector (22). However, the BDNF-induced activation of Arc/−1679 was partially prevented by the co-expression of a dominant negative EGR, ZnEGR1, or ZnEGR3 (Fig. 4B). These dominant negative EGRs also slightly reduced the basal activity of the promoter (Fig. 4B). The effects of dominant negative EGR and SP4 knockdown on Arc/−1679 were similar to those on Arc/−169 (data not shown), indicating that SP4 and EGR controlled the basal activity and BDNF-induced activation of Arc/−1679 via Region-2. Using the chromatin immunoprecipitation (ChIP) assay, we detected the binding of SP4 and EGR1 to Region-2. In addition, the binding to this region increased slightly with BDNF treatment, especially for EGR1 (Fig. 4C).
Identification of BDNF-responsive Elements in Region-1 of the Arc Proximal Promoter
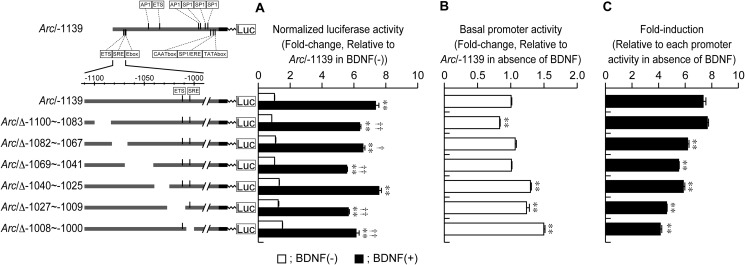
By focusing on Region-1, we further examined the regions involved in the regulation of the Arc proximal promoter using the internal deleted mutants of Arc/−1139 (Fig. 5A). Compared with Arc/−1139, significant increases in basal promoter activity were detected for Arc/Δ−1040∼−1025, Arc/Δ−1027∼−1009, and Arc/Δ−1008∼−1000, while a reduction was observed for Arc/Δ−1100∼−1083 (Fig. 5B). Also, significant reductions of BDNF-induced activation of the promoter were observed for Arc/Δ−1082∼−1067, Arc/Δ−1069∼−1041, Arc/Δ−1040∼−1025, Arc/Δ−1027∼−1009, and Arc/Δ−1008∼−1000 (Fig. 5C). Deletion of the region encompassing −1008 to −1000 bp produced both an increase in basal activity and a decrease in BDNF-induced promoter activation (Fig. 5, B and C). This region contains a cis-regulatory element, the binding site of SRF (Fig. 2). Moreover, the region encompassing −1027 to −1009 bp, which also affected the activity of the promoter (Fig. 5, B and C), contains the binding site of the E-twenty six (Ets) transcription factor family, a cofactor of SRF (Fig. 2). Therefore, these regions, which contain cis-regulatory elements involved in SRF-dependent transcription, could negatively regulate basal promoter activity, but could also be involved in the BDNF-induced activation of the Arc proximal promoter.
FIGURE 5.
Identification of BDNF-responsive elements in Region-1. A, to identify the BDNF-responsive regions in Region-1, we constructed a series of internal deletion mutants. Values represent the mean ± S.E. (n = 3). **, p < 0.01 versus control (the sample without BDNF). †, p < 0.05 and ††, p < 0.01 versus Arc/−1139 activity in the presence of BDNF. B, basal activity of Arc/−1139 and internally deleted Arc/−1139. Values represent the mean ± S.E. (n = 3). **, p < 0.01 versus Arc/−1139. C, fold-induction level of each promoter (Fold-induction) was calculated relative to the basal activity of each promoter. Values represent the mean ± S.E. (n = 3). **, p < 0.01 versus Arc/−1139.
HDAC Inhibition Enhanced BDNF-induced Arc Expression
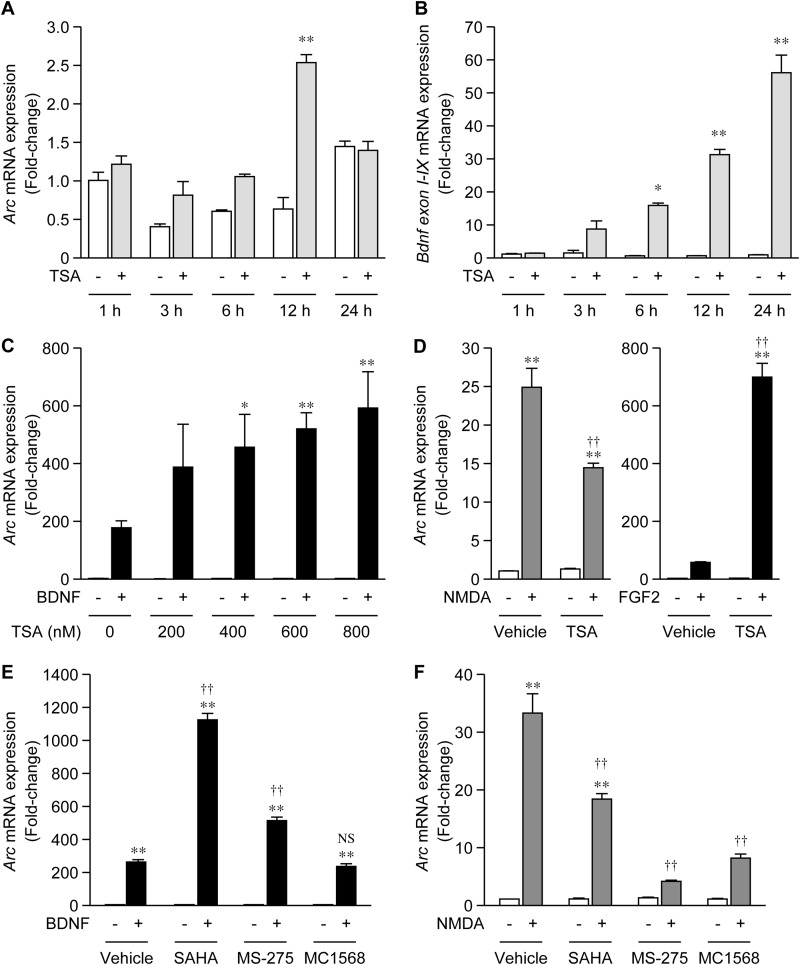
Analysis of a series of deleted mutants revealed that Region-1 negatively regulated Arc expression; therefore, we hypothesized that some negative transcriptional factors could be involved in the repression of Arc expression. As SRF and Ets-like transcription factor 1 (Elk1), binding sites for which are present in Region-1, were previously reported to interact with HDACs (24, 25), it is possible that Arc transcription is suppressed by HDAC-mediated repressive machinery. Therefore, we examined the effects of trichostatin A (TSA), an inhibitor of HDAC, on Arc expression. Although Arc mRNA levels were slightly increased 12 h after treatment with TSA only, this increase was not observed at other time points (3, 6, and 24 h) (Fig. 6A). Valproic acid (VPA), another inhibitor of HDAC, also did not affect Arc expression (21). In contrast, levels of Bdnf exon I-IX mRNA, the expression of which was previously shown to be repressed by the RE-1 silencing transcription factor (REST)/HDAC-mediated mechanism (26, 27), markedly increased after TSA treatment in a time-dependent manner (Fig. 6B), suggesting that TSA effectively inhibited HDAC in this culture system. In contrast to the non-responsiveness of basal Arc expression to TSA, the up-regulation of Arc mRNA levels by BDNF was markedly enhanced in the presence of TSA in a dose-dependent manner (Fig. 6C). The enhancing effect of TSA on BDNF-induced Arc mRNA levels was also detected when cells were treated with FGF2 (Fig. 6D). In contrast, TSA did not enhance, but inhibited NMDA-induced Arc mRNA levels (Fig. 6D). Thus, TSA selectively enhanced RTK signaling-induced Arc expression. This enhancing effect of TSA likely corresponded with regulation of transcription from the proximal promoter, which can be activated by BDNF or FGF2, but not by NMDA (Fig. 1).
FIGURE 6.
Effects of HDAC inhibitors on Arc mRNA expression. A and B, time-course of the changes in the levels of Arc (A) and Bdnf exon I-IX (B) mRNA after TSA treatment. At 5 DIV, cultured cortical cells were treated with 800 nm TSA, and total RNA was extracted at the indicated time points. The expression level of each mRNA was measured by quantitative RT-PCR analysis. Values represent the mean ± S.E. (n = 3). *, p < 0.05 and **, p < 0.01 versus control (the sample without TSA) at the same time point. C, effects of TSA on BDNF-induced Arc mRNA levels. At 5 DIV, cells were treated with TSA for 24 h, and BDNF was then added to the TSA-treated or non-treated cells. One hour after BDNF treatment, total RNA was extracted, and the levels of Arc mRNA were measured by quantitative RT-PCR analysis. Values represent the mean ± S.E. (n = 3–4). *, p < 0.05 and **, p < 0.01 versus control (the sample without TSA/BDNF). D, twenty-four hours after the 800 nm TSA treatment, cells were further treated with NMDA or FGF2 for 1 h. Values represent the mean ± S.E. (n = 3–4). **, p < 0.01 versus control (the sample without NMDA or FGF2). ††, p < 0.01 versus vehicle (the same sample without TSA). E and F, effects of SAHA, MS-275, and MC1568 on BDNF (E) or NMDA (F)-induced Arc expression. Twenty-four hours after the HDAC inhibitor treatment, cells were further treated with BDNF or NMDA for 1 h. The concentration for each HDAC inhibitor (5 μm) was taken from a previous report (33). Values represent the mean ± S.E. (n = 3–4). **, p < 0.01 versus control (the sample without BDNF). ††, p < 0.01 versus vehicle (the same sample without HDAC inhibitors). NS: not significant.
TSA is a pan-HDAC inhibitor. We next examined the effects of other HDAC inhibitors. We used SAHA, a class I/IIb HDAC inhibitor (28), MS-275, a selective class I HDAC inhibitor (29, 30), and MC1568, a selective class II HDAC inhibitor (31, 32). As reported recently (33), these HDAC inhibitors did not affect basal Arc mRNA levels (Fig. 6, E and F). The BDNF-induced increase in Arc mRNA levels was robustly enhanced by SAHA and also significantly by MS-275 (Fig. 6E). MC1568 had no effect on BDNF-induced Arc mRNA levels (Fig. 6E), indicating that a class I HDAC was, at least in part, involved in the repression of BDNF-induced Arc expression. However, NMDA-induced Arc mRNA expression was inhibited by SAHA, MS-275, or MC1568 (Fig. 6F).
The Enhancing Effect of TSA on Arc Transcription Because of SRF and Elk-1 Binding Sites Located in Region-1 of the Proximal Promoter
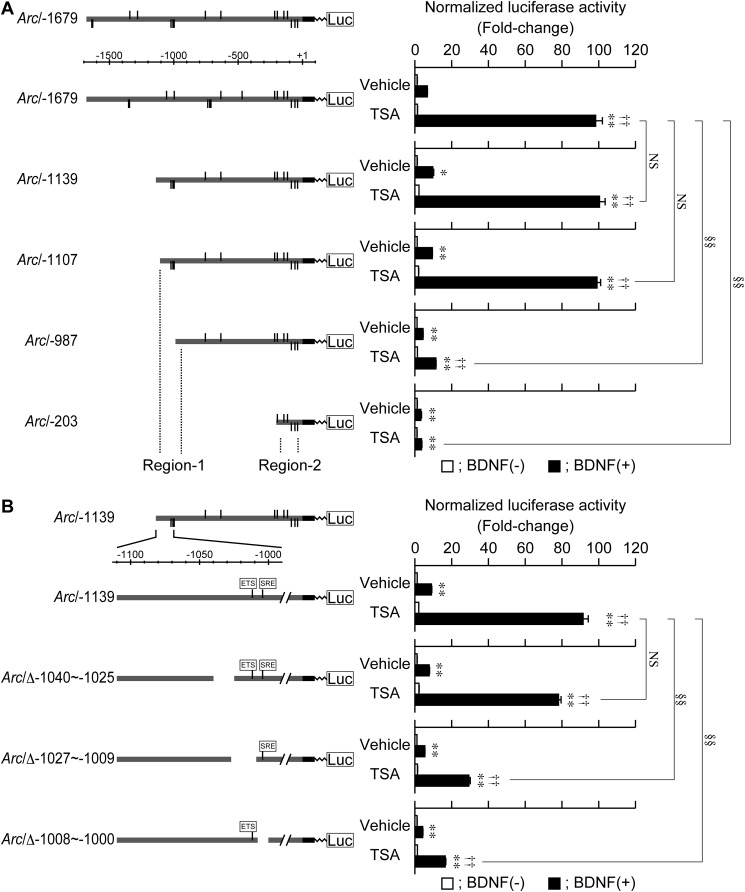
As shown in Fig. 7A, we showed that the BDNF-induced transcriptional activation of Arc/−1679 was synergistically enhanced by TSA, indicating that the enhancing effect of TSA occurred at the transcriptional level. Using a series of deletion mutants (Figs. 3 and 5), we found that the enhancing effect of TSA was also observed in Arc/−1139 and Arc/−1107, but that the effect of TSA was significantly reduced in Arc/−987 and Arc/−203 (Fig. 7A). Further analyses showed that the enhancing effect of TSA was significantly attenuated when the region encompassing −1027 to −1009 bp or −1008 to −1000 bp, which includes the cis-regulatory elements involved in the control of SRF-mediated transcription, was deleted (Fig. 7B).
FIGURE 7.
TSA enhanced the BDNF-induced activation of Arc/−1679. At 3 DIV, reporter plasmids were transfected into cultured cortical cells to measure promoter activity of Arc/−1679 and a series of deletion mutants (Figs. 2 and 4). Forty hours after DNA transfection, cells were treated with 800 nm TSA for 24 h, and BDNF was then added. Cell lysates were prepared 6 h after BDNF treatment. Values represent the mean ± S.E. (n = 3–5). *, p < 0.05 and **, p < 0.01 versus control (the sample without BDNF). ††, p < 0.01 versus vehicle (the same sample without TSA). §§, p < 0.01 versus Arc/−1679 (A) and Arc/−1139 (B) in the presence of TSA/BDNF. NS: not significant.
We performed ChIP assays with a specific antibody for HDAC1 or SRF to determine whether HDAC1 and SRF bound to Region-1. As shown in Fig. 8, we detected the binding of HDAC1 and SRF to Region-1. Using quantitative PCR analysis, we found that, although SRF binding did not change 24 h after TSA treatment, HDAC1 binding significantly decreased under the same condition (Fig. 8). Thus, Region-1 negatively regulated Arc expression and the release of HDAC1 from Region-1 could, at least in part, allow the expression of Arc to be strongly induced in response to BDNF.
DISCUSSION
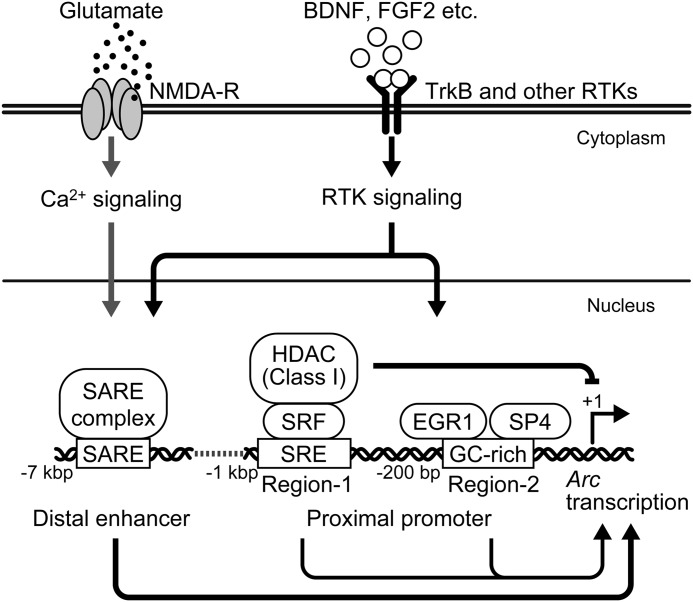
By focusing on BDNF-induced Arc transcription using Arc/−1679, we herein demonstrated that the proximal region of the Arc promoter contributed to the transcriptional regulation of Arc (Fig. 9), although the distal enhancer, SARE, has previously been shown to play a crucial role in activity-dependent Arc expression (4). Arc/−7000 and Arc/SARE were activated by NMDAR activation, whereas Arc/−1679 was activated by BDNF or FGF2, but not by NMDA. These results indicate that the SARE could mediate NMDAR-induced Arc expression, which is consistent with previous findings (4), while not only SARE but also the proximal promoter are involved in BDNF- or FGF2-induced Arc expression. Because both of the receptors for BDNF and FGF2 are RTK members, RTK signaling and NMDAR activation differentially control Arc expression via two distinct promoter regions, the SARE and the proximal promoter.
FIGURE 9.
A schematic model of Arc expression in neurons. BDNF-TrkB and other RTK signaling pathways induce the expression of Arc via either the distal SARE enhancer or the proximal region of the Arc promoter, whereas NMDAR activation-induced Arc expression is mainly mediated by the SARE. RTK signaling-induced Arc expression is repressed by HDACs (class I HDACs)-mediated mechanisms through Region-1, which contains binding sites for SRF and Elk1. The inhibition of class I HDACs allows Arc expression to be markedly induced in response to RTK signaling.
Using a series of deletion mutants of the Arc promoter, we identified two regulatory regions, termed Region-1 and Region-2, in Arc/−1679 (Fig. 9). In the present study, we demonstrated that EGR1 and SP4 bound to GC-rich Region-2 to regulate the basal activity and BDNF-induced activation of the Arc promoter, respectively. EGR1 is an activity-dependent IEG and contributes to the expression of long-lasting changes in neuronal functions such as long-term memory (34). Peng et al. (6) previously reported the involvement of EGR1 in PDGF-induced Arc expression. Thus, EGR1 appears to be important for RTK signaling-induced Arc expression. However, ZnEGRs, which is a highly conserved DNA-binding domain of all four EGR family transcription factors, partially inhibited BDNF-induced activation of Arc/−1679, whereas dominant negative EGRs almost completely suppressed nerve growth factor (NGF)-induced EGR-dependent transcription (35). In addition, knockdown of endogenous SP4 significantly reduced the basal activity of Arc/−1679, but not the BDNF-induced activation. Therefore, other factors are also likely be involved in the BDNF-induced activation of Arc/−1679. Among the SP family transcription factors, SP4 is predominantly expressed in neuronal cells (36) and contributes to the transcriptional regulation of neuronal genes, such as neurotrophin-3 (Nt-3) (22). Previous studies also reported that SP4 was involved in neuronal functions such as dendritic patterning in the cerebellum (37), development of the hippocampal dentate gyrus (38), and sensorimotor gating and memory (39). Therefore, the SP4-mediated transcriptional regulation of Arc may be involved in the regulation of several types of physiological functions in the brain.
Pintchovski et al. (5) reported that the binding site of the invertebrate transcription factor, Zeste, was involved in Arc promoter activation. However, using 5′-deleted promoters, we could not confirm whether deletion of the region including Zeste-like elements altered activation of the proximal promoter. Therefore, it is unlikely that Zeste-like elements participated in activation of the Arc promoter. Pintchovski et al. (5) examined the enhancer activity of the region including Zeste-like binding sites fused to the simian virus 40 (SV40) promoter, but not to the natural Arc promoter, which may be the reason why their results are different from ours.
The results obtained in the present study with internal deletion mutants of the Arc proximal promoter indicated that Region-1, including the cis-regulatory elements responsible for SRF-dependent transcription, negatively controlled basal promoter activity and positively controlled BDNF-induced promoter activation. We focused on the negative regulation of Arc expression via Region-1, and examined the effects of TSA on Arc expression. The levels of Arc mRNA did not change in neurons treated with TSA. However, the levels of Bdnf exon I-IX mRNA significantly increased in a time-dependent manner upon the TSA treatment because the Bdnf promoter I is remotely repressed by the RE-1 sequence located ∼1 kbp downstream of promoter I through HDAC-mediated repressive activity (27). These findings indicate that the repressive state of the Arc promoter differed from that of Bdnf promoter I, and that HDAC inhibition, which has been shown to accelerate the acetylation of histones, leading to the activation of gene transcription (40), was not sufficient for Arc induction. However, it is important to note that BDNF-induced Arc expression was markedly enhanced in the presence of TSA, and that this was not observed for Bdnf exon I-IX (data not shown). This result suggested that the repressive state of the chromatin structure could be erased by TSA and that the transcriptional machineries activated by BDNF could be easily recruited to the proximal region of the Arc promoter, resulting in the marked induction of Arc expression by BDNF. This enhancing effect of TSA was also observed in FGF2-induced, but not NMDA-induced, Arc expression, indicating that RTK signaling-induced Arc expression could be regulated by common mechanisms including chromatin structure dynamics. We also demonstrated that a selective class I HDAC inhibitor, but not a class II inhibitor, significantly enhanced BDNF-induced Arc expression. Because HDAC1 bound to the region around Region-1, HDAC1 could, at least in part, be involved in the repression of BDNF-induced Arc expression. Although SAHA inhibits class I/IIb HDACs, MS-275 preferentially inhibits HDAC1, 2, and 3 (30). This different range of inhibition may be one reason why the enhancing effect of SAHA on the Arc induction was stronger than that of MS-275. However, all HDAC inhibitors used in this study significantly suppressed NMDA-induced Arc expression, suggesting that most HDACs are likely to be involved in the induction by NMDA. In this study, however, it remains unresolved as to how HDACs positively control NMDA-induced Arc expression.
Although HDAC inhibition could be artificially achieved by TSA in cultured neurons, it currently remains unclear how repressive activity mediated by HDAC could be released under the physiological conditions present in the brain. In the case of c-fos, HDAC1 is known to be recruited to the promoter region via the transcriptional co-repressor retinoblastoma protein (Rb), chromatin remodeling factor BRG1, and Ca2+-responsive transactivator (CREST), in the absence of neuronal activity (41), whereas HDAC1 dissociates from the Rb/BRG1/CREST complex when neurons are stimulated in an activity-dependent manner. Furthermore, a previous study reported that HDAC1 could interact with Elk1 (24), which is a coactivator of SRF and binds to the Ets transcription factor family-binding site. Because the effects of TSA were attenuated by deletion of the binding sites for SRF and Ets transcription factor located in Region-1, it is plausible that the binding of HDAC1 to Region-1 could be reduced in an activity-dependent manner, resulting in an enhancement in BDNF-induced Arc expression. Further investigations are needed to clarify this possibility.
Evidence has accumulated to show that the combination of both BDNF and Arc actions plays an important role in the expression of various neuronal functions (9, 42). Messaoudi et al. (11) reported that Arc protein synthesis was required for BDNF-induced LTP. Furthermore, two waves of Arc induction have been observed after a single spatial exploration (19). We previously demonstrated that the robust stimulation of TrkB with BDNF in cultured rat cortical cells induced the biphasic expression of Bdnf mRNA, which was observed 1–3 h (primary induction) and 24–72 h (secondary induction) after the stimulation, and that this biphasic expression of Bdnf mRNA was accompanied by a similar expression profile for Arc mRNA (43). It is important to note that the induction of Arc mRNA in the secondary phase was mediated by the binding of endogenously synthesized BDNF to TrkB, while the secondary induction of Bdnf mRNA was controlled in an activity-dependent manner (43). Therefore, the distinct usage of the SARE and the proximal Arc promoter may be involved in the control of two waves of Arc induction (19); the secondary wave of Arc synthesis could be mainly mediated by the interaction between secreted BDNF and TrkB under cellular conditions in which HDAC1-mediated repressive activity may have been released from the Arc promoter. Thus, BDNF-induced Arc expression could provide a clearer understanding of the molecular mechanisms underlying Arc-mediated long-lasting changes in neuronal functions in the brain.
Acknowledgment
We thank Dr. J. M. Baraban (The Johns Hopkins University) for providing expression vectors for the dominant-negative EGRs, ZnEGR1, and ZnEGR3.
This study was supported in part by a Grant-in-aid for Scientific Research from the Ministry of Education, Science, Sports and Culture, Japan (Project Number: 20390023, to M. T.) and the Mitsubishi Foundation (to M. T.).
- Arc
- activity-regulated cytoskeleton-associated protein
- HDAC
- histone deacetylase
- BDNF
- brain-derived neurotrophic factor
- TSA
- trichostatin A
- SARE
- synaptic activity-responsive element
- SP4
- specificity protein 4
- EGR
- early growth response
- SRF
- serum response factor
- DIV
- days in vitro.
REFERENCES
- 1. Link W., Konietzko U., Kauselmann G., Krug M., Schwanke B., Frey U., Kuhl D. (1995) Somatodendritic expression of an immediate early gene is regulated by synaptic activity. Proc. Natl. Acad. Sci. U.S.A. 92, 5734–5738 [DOI] [PMC free article] [PubMed] [Google Scholar]
- 2. Lyford G. L., Yamagata K., Kaufmann W. E., Barnes C. A., Sanders L. K., Copeland N. G., Gilbert D. J., Jenkins N. A., Lanahan A. A., Worley P. F. (1995) Arc, a growth factor and activity-regulated gene, encodes a novel cytoskeleton-associated protein that is enriched in neuronal dendrites. Neuron 14, 433–445 [DOI] [PubMed] [Google Scholar]
- 3. Waltereit R., Dammermann B., Wulff P., Scafidi J., Staubli U., Kauselmann G., Bundman M., Kuhl D. (2001) Arg3.1/Arc mRNA induction by Ca2+ and cAMP requires protein kinase A and mitogen-activated protein kinase/extracellular regulated kinase activation. J. Neurosci. 21, 5484–5493 [DOI] [PMC free article] [PubMed] [Google Scholar]
- 4. Kawashima T., Okuno H., Nonaka M., Adachi-Morishima A., Kyo N., Okamura M., Takemoto-Kimura S., Worley P. F., Bito H. (2009) Synaptic activity-responsive element in the Arc/Arg3.1 promoter essential for synapse-to-nucleus signaling in activated neurons. Proc. Natl. Acad. Sci. U.S.A. 106, 316–321 [DOI] [PMC free article] [PubMed] [Google Scholar]
- 5. Pintchovski S. A., Peebles C. L., Kim H. J., Verdin E., Finkbeiner S. (2009) The serum response factor and a putative novel transcription factor regulate expression of the immediate-early gene Arc/Arg3.1 in neurons. J. Neurosci. 29, 1525–1537 [DOI] [PMC free article] [PubMed] [Google Scholar]
- 6. Peng F., Yao H., Bai X., Zhu X., Reiner B. C., Beazely M., Funa K., Xiong H., Buch S. (2010) Platelet-derived growth factor-mediated induction of the synaptic plasticity gene Arc/Arg3.1. J. Biol. Chem. 285, 21615–21624 [DOI] [PMC free article] [PubMed] [Google Scholar]
- 7. Steward O., Wallace C. S., Lyford G. L., Worley P. F. (1998) Synaptic activation causes the mRNA for the IEG Arc to localize selectively near activated postsynaptic sites on dendrites. Neuron 21, 741–751 [DOI] [PubMed] [Google Scholar]
- 8. Rodríguez J. J., Davies H. A., Silva A. T., De Souza I. E., Peddie C. J., Colyer F. M., Lancashire C. L., Fine A., Errington M. L., Bliss T. V., Stewart M. G. (2005) Long-term potentiation in the rat dentate gyrus is associated with enhanced Arc/Arg3.1 protein expression in spines, dendrites and glia. Eur. J. Neurosci. 21, 2384–2396 [DOI] [PubMed] [Google Scholar]
- 9. Bramham C. R., Worley P. F., Moore M. J., Guzowski J. F. (2008) The immediate early gene arc/arg3.1: regulation, mechanisms, and function. J. Neurosci. 28, 11760–11767 [DOI] [PMC free article] [PubMed] [Google Scholar]
- 10. Waung M. W., Pfeiffer B. E., Nosyreva E. D., Ronesi J. A., Huber K. M. (2008) Rapid translation of Arc/Arg3.1 selectively mediates mGluR-dependent LTD through persistent increases in AMPAR endocytosis rate. Neuron 59, 84–97 [DOI] [PMC free article] [PubMed] [Google Scholar]
- 11. Messaoudi E., Kanhema T., Soule J., Tiron A., Dagyte G., da Silva B., Bramham C. R. (2007) Sustained Arc/Arg3.1 synthesis controls long-term potentiation consolidation through regulation of local actin polymerization in the dentate gyrus in vivo. J. Neurosci. 27, 10445–10455 [DOI] [PMC free article] [PubMed] [Google Scholar]
- 12. Okuno H., Akashi K., Ishii Y., Yagishita-Kyo N., Suzuki K., Nonaka M., Kawashima T., Fujii H., Takemoto-Kimura S., Abe M., Natsume R., Chowdhury S., Sakimura K., Worley P. F., Bito H. (2012) Inverse synaptic tagging of inactive synapses via dynamic interaction of Arc/Arg3.1 with CaMKIIb. Cell 149, 886–898 [DOI] [PMC free article] [PubMed] [Google Scholar]
- 13. Plath N., Ohana O., Dammermann B., Errington M. L., Schmitz D., Gross C., Mao X., Engelsberg A., Mahlke C., Welzl H., Kobalz U., Stawrakakis A., Fernandez E., Waltereit R., Bick-Sander A., Therstappen E., Cooke S. F., Blanquet V., Wurst W., Salmen B., Bösl M. R., Lipp H. P., Grant S. G., Bliss T. V., Wolfer D. P., Kuhl D. (2006) Arc/Arg3.1 is essential for the consolidation of synaptic plasticity and memories. Neuron 52, 437–444 [DOI] [PubMed] [Google Scholar]
- 14. Park S., Park J. M., Kim S., Kim J. A., Shepherd J. D., Smith-Hicks C. L., Chowdhury S., Kaufmann W., Kuhl D., Ryazanov A. G., Huganir R. L., Linden D. J., Worley P. F. (2008) Elongation factor 2 and fragile X mental retardation protein control the dynamic translation of Arc/Arg3.1 essential for mGluR-LTD. Neuron 59, 70–83 [DOI] [PMC free article] [PubMed] [Google Scholar]
- 15. Li L., Carter J., Gao X., Whitehead J., Tourtellotte W. G. (2005) The neuroplasticity-associated arc gene is a direct transcriptional target of early growth response (Egr) transcription factors. Mol. Cell Biol. 25, 10286–10300 [DOI] [PMC free article] [PubMed] [Google Scholar]
- 16. Ying S. W., Futter M., Rosenblum K., Webber M. J., Hunt S. P., Bliss T. V., Bramham C. R. (2002) Brain-derived neurotrophic factor induces long-term potentiation in intact adult hippocampus: requirement for ERK activation coupled to CREB and upregulation of Arc synthesis. J. Neurosci. 22, 1532–1540 [DOI] [PMC free article] [PubMed] [Google Scholar]
- 17. Rao V. R., Pintchovski S. A., Chin J., Peebles C. L., Mitra S., Finkbeiner S. (2006) AMPA receptors regulate transcription of the plasticity-related immediate-early gene Arc. Nat. Neurosci. 9, 887–895 [DOI] [PubMed] [Google Scholar]
- 18. Wibrand K., Messaoudi E., Håvik B., Steenslid V., Løvlie R., Steen V. M., Bramham C. R. (2006) Identification of genes co-upregulated with Arc during BDNF-induced long-term potentiation in adult rat dentate gyrus in vivo. Eur. J. Neurosci. 23, 1501–1511 [DOI] [PubMed] [Google Scholar]
- 19. Ramírez-Amaya V., Vazdarjanova A., Mikhael D., Rosi S., Worley P. F., Barnes C. A. (2005) Spatial exploration-induced Arc mRNA and protein expression: Evidence for selective, network-specific reactivation. J. Neurosci. 25, 1761–1768 [DOI] [PMC free article] [PubMed] [Google Scholar]
- 20. Fukuchi M., Tabuchi A., Tsuda M. (2004) Activity-dependent transcriptional activation and mRNA stabilization for cumulative expression of pituitary adenylate cyclase-activating polypeptide mRNA controlled by calcium and cAMP signals in neurons. J. Biol. Chem. 279, 47856–47865 [DOI] [PubMed] [Google Scholar]
- 21. Fukuchi M., Nii T., Ishimaru N., Minamino A., Hara D., Takasaki I., Tabuchi A., Tsuda M. (2009) Valproic acid induces up- or down-regulation of gene expression responsible for the neuronal excitation and inhibition in rat cortical neurons through its epigenetic actions. Neurosci. Res. 65, 35–43 [DOI] [PubMed] [Google Scholar]
- 22. Ishimaru N., Tabuchi A., Hara D., Hayashi H., Sugimoto T., Yasuhara M., Shiota J., Tsuda M. (2007) Regulation of neurotrophin-3 gene transcription by Sp3 and Sp4 in neurons. J. Neurochem. 100, 520–531 [DOI] [PubMed] [Google Scholar]
- 23. Fukuchi M., Fujii H., Takachi H., Ichinose H., Kuwana Y., Tabuchi A., Tsuda M. (2010) Activation of tyrosine hydroxylase (TH) gene transcription induced by brain-derived neurotrophic factor (BDNF) and its selective inhibition through Ca2+ signals evoked via the N-methyl-D-aspartate (NMDA) receptor. Brain Res. 1366, 18–26 [DOI] [PubMed] [Google Scholar]
- 24. Yang S. H., Vickers E., Brehm A., Kouzarides T., Sharrocks A. D. (2001) Temporal recruitment of the mSin3A-histone deacetylase corepressor complex to the ETS domain transcription factor Elk-1. Mol. Cell Biol. 21, 2802–2814 [DOI] [PMC free article] [PubMed] [Google Scholar]
- 25. Davis F. J., Gupta M., Camoretti-Mercado B., Schwartz R. J., Gupta M. P. (2003) Calcium/calmodulin-dependent protein kinase activates serum response factor transcription activity by its dissociation from histone deacetylase, HDAC4. Implications in cardiac muscle gene regulation during hypertrophy. J. Biol. Chem. 278, 20047–20058 [DOI] [PubMed] [Google Scholar]
- 26. Timmusk T., Palm K., Lendahl U., Metsis M. (1999) Brain-derived neurotrophic factor expression in vivo is under the control of neuron-restrictive silencer element. J. Biol. Chem. 274, 1078–1084 [PubMed] [Google Scholar]
- 27. Hara D., Fukuchi M., Miyashita T., Tabuchi A., Takasaki I., Naruse Y., Mori N., Kondo T., Tsuda M. (2009) Remote control of activity-dependent BDNF gene promoter-I transcription mediated by REST/NRSF. Biochem. Biophys. Res. Commun. 384, 506–511 [DOI] [PubMed] [Google Scholar]
- 28. Bradner J. E., West N., Grachan M. L., Greenberg E. F., Haggarty S. J., Warnow T., Mazitschek R. (2010) Chemical phylogenetics of histone deacetylases. Nat. Chem. Biol. 6, 238–243 [DOI] [PMC free article] [PubMed] [Google Scholar]
- 29. Hu E., Dul E., Sung C.-M., Chen Z., Kirkpatrick R., Zhang G.-F., Johanson K., Liu R., Lago A., Hofmann G., Macarron R., de los Frailes M., Perez P., Krawiec J., Winkler J., Jaye M. (2003) Identification of novel isoform-selective inhibitors within class I histone deacetylases. J. Pharmacol. Exp. Ther. 307, 720–728 [DOI] [PubMed] [Google Scholar]
- 30. Khan N., Jeffers M., Kumar S., Hackett C., Boldog F., Khramtsov N., Qian X., Mills E., Berghs S. C., Carey N., Finn P. W., Collins L. S., Tumber A., Ritchie J. W., Jensen P. B., Lichenstein H. S., Sehested M. (2008) Determination of the class and isoform selectivity of small-molecule histone deacetylase inhibitors. Biochem. J. 409, 581–589 [DOI] [PubMed] [Google Scholar]
- 31. Mai A., Massa S., Pezzi R., Simeoni S., Rotili D., Nebbioso A., Scognamiglio A., Altucci L., Loidl P., Brosch G. (2005) Class II (IIa)-selective histone deacetylase inhibitors. 1. Synthesis and biological evaluation of novel (aryloxopropenyl) pyrrolyl hydroxyamides. J. Med. Chem. 48, 3344–3353 [DOI] [PubMed] [Google Scholar]
- 32. Nebbioso A., Manzo F., Miceli M., Conte M., Manente L., Baldi A., De Luca A., Rotili D., Valente S., Mai A., Usiello A., Gronemeyer H., Altucci L. (2009) Selective class II HDAC inhibitors impair myogenesis by modulating the stability and activity of HDAC-MEF2 complexes. EMBO Rep. 10, 776–782 [DOI] [PMC free article] [PubMed] [Google Scholar]
- 33. Koppel I., Timmusk T. (2013) Differential regulation of Bdnf expression in cortical neurons by class-selective histone deacetylase inhibitors. Neuropharmacology 75, 106–115 [DOI] [PubMed] [Google Scholar]
- 34. Veyrac A., Besnard A., Caboche J., Davis S., Laroche S. (2014) The transcription factor zif268/egr1, brain plasticity, and memory. Prog. Mol. Biol. Transl. Sci. 122, 89–129 [DOI] [PubMed] [Google Scholar]
- 35. Levkovitz Y., O'Donovan K. J., Baraban J. M. (2001) Blockade of NGF-induced neurite outgrowth by a dominant-negative inhibitor of the egr family of transcription regulatory factors. J. Neurosci. 21, 45–52 [DOI] [PMC free article] [PubMed] [Google Scholar]
- 36. Suske G. (1999) The Sp-family of transcription factors. Gene 238, 291–300 [DOI] [PubMed] [Google Scholar]
- 37. Ramos B., Gaudillière B., Bonni A., Gill G. (2007) Transcription factor Sp4 regulates dendritic patterning during cerebellar maturation. Proc. Natl. Acad. Sci. U.S.A. 104, 9882–9887 [DOI] [PMC free article] [PubMed] [Google Scholar]
- 38. Zhou X., Qyang Y., Kelsoe J. R., Masliah E., Geyer M. A. (2007) Impaired postnatal development of hippocampal dentate gyrus in Sp4 null mutant mice. Genes Brain Behav. 6, 269–276 [DOI] [PubMed] [Google Scholar]
- 39. Zhou X., Long J. M., Geyer M. A., Masliah E., Kelsoe J. R., Wynshaw-Boris A., Chien K. R. (2005) Reduced expression of the Sp4 gene in mice causes deficits in sensorimotor gating and memory associated with hippocampal vacuolization. Mol. Psychiatry 10, 393–406 [DOI] [PubMed] [Google Scholar]
- 40. Peterson C. L., Laniel M. A. (2004) Histones and histone modifications. Curr. Biol. 14, R546–R551 [DOI] [PubMed] [Google Scholar]
- 41. Qiu Z., Ghosh A. (2008) A calcium-dependent switch in a CREST-BRG1 complex regulates activity-dependent gene expression. Neuron 60, 775–787 [DOI] [PMC free article] [PubMed] [Google Scholar]
- 42. Binder D. K., Scharfman H. E. (2004) Brain-derived neurotrophic factor. Growth Factors 22, 123–131 [DOI] [PMC free article] [PubMed] [Google Scholar]
- 43. Yasuda M., Fukuchi M., Tabuchi A., Kawahara M., Tsuneki H., Azuma Y., Chiba Y., Tsuda M. (2007) Robust stimulation of TrkB induces delayed increases in BDNF and Arc mRNA expression in cultured rat cortical neurons via distinct mechanisms. J. Neurochem. 103, 626–636 [DOI] [PubMed] [Google Scholar]


