

Background: SK channels are implicated in atrial fibrillation (AF), and diabetes (DM) is a risk factor for AF.
Results: Atrial SK2 and SK3 are significantly down-regulated from accelerated turnover in diabetic mice, resulting in action potential prolongation and arrhythmias.
Conclusion: SK channel down-regulation may lead to arrhythmogenesis.
Significance: SK channel down-regulation contributes to atrial electrophysiological dysfunction in DM.
Keywords: Cardiomyocyte, Diabetes, Mouse, Oxidative Stress, Patch Clamp, Potassium Channel, HL-1 Cells, SK Channels
Abstract
The small conductance Ca2+-activated K+ (SK) channels have recently been found to be expressed in the heart, and genome-wide association studies have shown that they are implicated in atrial fibrillation. Diabetes mellitus is an independent risk factor of atrial fibrillation, but the ionic mechanism underlying this relationship remains unclear. We hypothesized that SK channel function is abnormal in diabetes mellitus, leading to altered cardiac electrophysiology. We found that in streptozotocin-induced diabetic mice, the expression of SK2 and SK3 isoforms was down-regulated by 85 and 92%, respectively, whereas that of SK1 was not changed. SK currents from isolated diabetic mouse atrial myocytes were significantly reduced compared with controls. The resting potentials of isolated atrial preparations were similar between control and diabetic mice, but action potential durations were significantly prolonged in the diabetic atria. Exposure to apamin significantly prolonged action potential durations in control but not in diabetic atria. Production of reactive oxygen species was significantly increased in diabetic atria and in high glucose-cultured HL-1 cells, whereas exposure of HL-1 cells in normal glucose culture to H2O2 reduced the expression of SK2 and SK3. Tyrosine nitration in SK2 and SK3 was significantly increased by high glucose culture, leading to accelerated channel turnover. Treatment with Tiron prevented these changes. Our results suggest that increased oxidative stress in diabetes results in SK channel-associated electrical remodeling in diabetic atria and may promote arrhythmogenesis.
Introduction
Diabetes mellitus (DM)3 has become a global epidemic. Currently, 29.1 million people in the United States have DM (8.3% of the total population), including 9.3 million who are undiagnosed, with an additional 86 million who are prediabetic (1). Cardiovascular diseases are the cause of death in more than 50% of diabetic patients, and patients with diabetes have a 2–6-fold increase in the risk of coronary artery disease and stroke (2, 3). DM is a strong independent risk factor for atrial fibrillation (AF) (4, 5), and diabetic patients have a higher rate of recurrence after AF catheter ablation and are more prone to progress to permanent AF (6). However, very little is known about the effects of DM on atrial electrophysiology.
Recently, a genome-wide association study identified the small conductance Ca2+-activated K+ (SK) channel gene as a new locus for AF (7). SK channels are widely distributed in excitable and non-excitable cells (8). They belong to the KCNN gene family, and three isoforms have been cloned: SK1 (KCNN1), SK2 (KCNN2), and SK3 (KCNN3) (9). SK channels have similar topology to members of the voltage-gated K+ channel subfamily. They have small conductances (10–20 picosiemens) that are not activated by voltage but by intracellular free Ca2+ with sensitivity conferred by intimate interaction between calmodulin and each of the four channel subunits (9, 10). These channels are blocked by the bee venom neurotoxin apamin with differential sensitivity of SK2 > SK3 > SK1 (8, 9). How SK channels are involved in AF is unknown. SK channels have recently been shown to be expressed in cardiac tissue (11). In this study, we hypothesized that atrial SK channel function is abnormal in DM, resulting in altered cardiac electrophysiology, which in turn may lead to development of arrhythmias.
EXPERIMENTAL PROCEDURES
Development of Type 1 Diabetic Mice
Male mice were purchased from Harlan Inc. (Indianapolis, IN) at 6–8 weeks of age and received an injection of streptozotocin (100 mg/kg of body weight intraperitoneally) (12). Control mice received vehicle injections. Mice with blood glucose >300 mg/dl were considered diabetic and used for experiments after 8 weeks. Handling and care of animals as well as animal procedures were approved by the Institutional Animal Care and Use Committee of Mayo Clinic Foundation.
HL-1 Cell Culture
HL-1 cells, a continuously proliferating cardiomyocyte cell line derived from mouse atrial hyperplastic cardiac muscle cells, were maintained in modified Claycomb medium (Sigma-Aldrich) supplemented with 10% fetal bovine serum, 100 μg/ml penicillin-streptomycin, 0.1 mm norepinephrine, and 2 mm l-glutamine (13). HL-1 cells were cultured with modified Claycomb medium containing either normal glucose (NG; 5 mm) or high glucose (HG; 25 mm) for 2 weeks, which is the time required for the cells to develop oxidative stress from an imbalance between reactive oxygen species (ROS) generation and scavenger enzyme down-regulation as reported previously (14). Selected HL-1 cells were treated with Tiron (10 mm) after a 2-week culture in HG. Cells were cultured in HG with or without Tiron for another 24 h before harvest (15).
Western Blot Analysis
Western blotting was performed as described previously (16). Briefly, isolated mouse atria and HL-1 cells were homogenized, and proteins were separated by polyacrylamide gel electrophoresis, transferred to a nitrocellulose membrane, and then immunoblotted against the following antibodies: anti-SK1 (1:200; Alomone Labs, Jerusalem, Israel), anti-SK2 (1:200; Alomone Labs), anti-SK3 (1:200; Alomone Labs), anti-Cav1.3 (1:200; Abcam Inc., Cambridge, MA), anti-Kir6.2 (1:1000; custom-made), anti-KCNQ1 (1:200; Santa Cruz Biotechnology, Inc., Santa Cruz, CA), anti-HERG (1:200; Santa Cruz Biotechnology, Inc.), anti-GAPDH (1:200; Santa Cruz Biotechnology, Inc.), and anti-β-actin (1:500; Santa Cruz Biotechnology, Inc.) antibodies. After extensive washing, blots were exposed to horseradish peroxidase-conjugated secondary antibodies, and signals were developed by the Immun-Star HRP Chemiluminescent kit (Bio-Rad). Optical density of the bands was analyzed using Scion Image software (Scion, Frederick, MD). Protein expression was expressed as relative abundance normalized to that of GAPDH or β-actin.
Immunoprecipitation Analysis
Immunoprecipitation was performed as we have reported previously (16). In brief, HL-1 cells were harvested after three washes with phosphate-buffered saline (PBS). The cells collected were incubated with 200 μl of radioimmune precipitation assay buffer (50 mm Tris, 150 mm NaCl, 2 mm NaF, 1 mm EDTA, 1 mm EGTA, 1 mm NaVO4, and 1% Triton X-100) and 1 μl of protease inhibitor on ice for 1 h followed by homogenization and then centrifugation at 8000 rpm at 4 °C for 10 min. The supernatant (about 600 μg of protein in 600 μl) was incubated overnight at 4 °C with anti-nitrotyrosine (Millipore Inc.) antibodies at a final concentration of 5 μg/ml. The samples were then incubated with 35 μl of Protein G Plus-agarose (Santa Cruz Biotechnology, Inc.) at 4 °C overnight with rotation. After centrifugation at 2000 rpm for 3 min and washing three times with radioimmune precipitation assay/protease inhibitor buffer, the immunoprecipitates were collected and eluted from the agarose with 30 μl of SDS-PAGE loading buffer. The immunoprecipitates were resolved by SDS-PAGE and blotted against anti-SK channel antibodies.
Action Potential Recordings
Action potential recordings of isolated mouse atrial tissues were performed using standard microelectrode techniques as described previously (17). Mice were sacrificed after being anesthetized with sodium pentobarbital (100 mg/kg intraperitoneally). The atria were rapidly excised, placed in a temperature-regulated 5-ml chamber, and continuously superfused with oxygenated Tyrode's solution at 4 ml/min at 37 °C. The Tyrode's solution contained 129 mm NaCl, 4 mm KCl, 0.9 mm NaH2PO4, 20 mm NaHCO3, 1.8 mm CaCl2, 0.5 mm MgSO4, and 5.5 mm d-glucose gassed with 95% O2 and 5% CO2 and adjusted to pH 7.4. After 30 min of equilibration, the mouse atrial tissue was impaled with a micropipette with a tip resistance of 10–25 megaohms when filled with 3 m KCl, and the output signals were sampled at 100 kHz without filter by a high input impedance preamplifier (Duo 773, World Precision Instruments, Sarasota, FL). The atrial preparations were paced using a stimulator (Bloom Associates, Ltd., Reading, PA) with a stimulus output at twice diastolic threshold.
Results were analyzed off-line using pCLAMP 10 software (Molecular Devices, Sunnyvale, CA) as described previously (17). Mouse atrial resting membrane potentials as well as action potential durations at 50 and 90% repolarization (APD50 and APD90, respectively) were measured at a paced cycle length (CL) of 300 ms. The effects of the SK-specific inhibitor apamin (100 pm) on APDs were measured after 15 min of exposure.
Mouse Atrial Myocyte Isolation and Whole-cell SK Current Recording
Single atrial cardiac myocytes were isolated enzymatically as described previously (18). Mice were anesthetized, and isolated hearts were retrogradely perfused on a Langendorff apparatus (1 ml/min) with nominally Ca2+-free Krebs-Ringer solution containing 35 mm NaCl, 4.75 mm KCl, 1.2 mm KH2PO4, 16 mm Na2HPO4, 134 mm sucrose, 10 mm Hepes, 10 mm glucose, 25 mm NaHCO3, pH 7.4 with NaOH and equilibrated with 95% O2 and 5% CO2 at 37 °C for 5 min. The perfusate was then switched to a nominally Ca2+-free Krebs-Ringer solution containing 1 mg/ml collagenase (CLS-2, 347 units/mg; Worthington) for another 40 min. The atria were cut into small pieces and stored in KB solution containing 70 mm KOH, 40 mm KCl, 50 mm l-glutamic acid, 20 mm taurine, 0.5 mm MgCl2, 1.0 mm K2HPO4, 0.5 mm EGTA, 10 mm Hepes, 5.0 mm creatine, 5.0 mm pyruvic acid, and 5.0 mm Na2ATP, pH 7.38 with KOH.
Whole-cell K+ currents in freshly isolated mouse atrial myocytes were recorded from a holding potential of −60 mV with testing potentials of −120 to +10 mV in 10-mV increments using an Axopatch 200B integrating amplifier (Molecular Devices), filtered at 2 kHz, and digitized at 50 kHz (16-bit resolution). The glass pipette had a typical resistance of 0.5–1 megaohm after filling with a pipette solution that contained 140 mm KCl, 1.0 mm MgCl2, 0.5 mm Na2GTP, 5.0 mm Na2ATP, 1.0 mm EGTA, 10 mm Hepes, and 0.814 mm CaCl2 (free Ca2+ concentration, 1 μm), pH 7.35 with KCl (16). The bath solution contained 140 mm N-methylglucamine, 4 mm KCl, 1.0 mm MgCl2, 5.0 mm glucose, and 10 mm Hepes, pH 7.4. Cell capacitance was compensated by >80% as described previously (16). The SK currents were determined as the K+ current component sensitive to 100 pm apamin (19, 20). All experiments were performed at room temperature (24 °C).
RNA Isolation and Real Time PCR
Total RNA from mouse atria was isolated using an RNeasy Mini kit (Qiagen, Valencia, CA) and treated with deoxyribonuclease (DNA-free; Ambion, Life Technologies). RNAs were reverse transcribed using the ThermoScript RT-PCR System (Invitrogen, Life Technologies) according to the manufacturer's instructions as described previously (21).
Real time semiquantitative PCR analyses were performed using the ABI PRISM 7700 Sequence Detection System and software. Brilliant SYBR Green QPCR Master Mix was obtained from Stratagene (La Jolla, CA). Primer sequences for specific amplification of SK1, SK2, SK3, and GAPDH were selected from the published sequences: 1) SK1: forward, ATCCATCAGGCTCAGAAGCTCC; reverse, AGCTCTGACACCACCTCATATGC; 2) SK2: forward, ATGGATACTCAGCTGACCAAAAGA; reverse, GCTTGCAAGAATTTCCGTTGATGC; 3) SK3: forward, TCCTCCAGGCAAGGCAGCCA; reverse, GGGCTTCATGACCCCACCGC; and 4) GAPDH: forward, AACTGCTTAGCACCCCTGGC; reverse, ATGACCTTGCCCACAGCCTT. We verified that the PCR products were of the expected size and that no other products were obtained before using these primers for real time PCR studies. All samples were run in duplicates, and results were normalized to the reference gene signal (GAPDH). CT was the number of amplification cycles required by each gene to reach a fixed threshold of signal intensity. The practical working range was within CT values of 18–35. The non-template control CT was 40. Relative abundance was calculated as 2ΔCT, where ΔCT = Test CT − Control CT (22).
Intracellular Oxidative Stress Measurements
Unfixed frozen atria from control and diabetic mice were cut into 15-μm-thick sections and placed on a glass slide. Dihydroethidium (DHE; 2 μm) was topically applied to each tissue section and incubated in a light-protected humidified chamber at 37 °C for 30 min. Slides were then coverslipped, and fluorescent images were obtained using laser confocal microscopy (LSM 510, Zeiss, Germany) with a 63× water immersion lens. DHE was excited at 488 nm, and fluorescence emission was detected with a 585–615-nm band pass filter. In addition, autofluorescence intrinsic to the internal elastic lamina, which separates the endothelium from smooth muscles and is present in small arteries, was detected using a 505–550-nm band pass filter (green fluorescence) (23), and transmitted light micrographs of the same sections were obtained. The light micrograph and fluorescence images for DHE and internal elastic lamina were digitally merged to demonstrate anatomical distribution of superoxide. The DHE signals were further analyzed densitometrically using Scion Image software, and the results were expressed as relative densitometric units/unit area.
Inhibition of SK Channel Protein Synthesis by Cycloheximide
To assess SK channel protein turnover in HL-1 cells cultured in NG and HG, we performed experiments using cycloheximide, a protein synthesis inhibitor. After a 2-week culture in NG or HG, HL-1 cells were incubated in fresh NG or HG medium containing 100 μg/ml cycloheximide. Cells were harvested after 6 h, and the levels of SK2 and SK3 protein expression were evaluated by Western blot analysis. Cells not treated with cycloheximide were used as a control.
Statistical Analysis
Data are presented as mean ± S.E. One-way analysis of variance followed by Tukey test was used to compare data from multiple groups. A paired t test was used to compare data before and after drug treatment. Pairwise comparisons among groups were also performed using Fisher's exact test. Statistical significant difference was defined as a p value <0.05.
RESULTS
Protein Expression of SK2 and SK3 Is Down-regulated in Diabetic Mouse Atria
After 8 weeks of DM, protein expression of SK2 and SK3 was dramatically down-regulated by 85 and 92%, respectively, in mouse atria (n = 3, p < 0.05 for both versus control). In contrast, expression of SK1 remained unchanged, suggesting that the down-regulation of the SK channel is isoform-specific (Fig. 1, A and B). Similar findings were observed in type 2 diabetic db/db mouse atria (data not shown).
FIGURE 1.

SK channel expression in control and diabetic mouse atria. A, immunoblots of SK1, SK2, SK3, and GAPDH in homogenates from control and DM mouse atria. B, group data showing significant down-regulation of SK2 and SK3 protein expression in DM, whereas SK1 protein expression was unchanged (n = 3). C, group data showing relative mRNA expression of SK1, SK2, and SK3 in control and DM mouse atria (n = 6). There was no significant difference for SK1 and SK2 between control and DM, but that of SK3 was increased by more than 2-fold in DM. D, immunoblots of Cav1.3, HERG, KCNQ, and Kir6.2 in control and diabetic mouse atria. E, group data showing that the expression of these channels was not altered in DM in contrast to those of SK2 and SK3 channels (n = 7). * represents p < 0.05 versus controls. Error bars represent S.E.
We then determined whether the down-regulation of SK2 and SK3 channel protein expression was due to down-regulation of their mRNA expression using real time PCR techniques. There was no significant change in the levels of atrial SK1 and SK2 mRNA expression between control and diabetic mice, but diabetic atria showed a 2.3 ± 0.5-fold increase in SK3 mRNA (n = 6, p < 0.05 versus control) (Fig. 1C). These results suggest that the down-regulation of SK2 and SK3 protein expression in diabetic mouse atrium is not due to the down-regulation of mRNA for these channel isoforms.
For comparison, we examined the effects of DM on the protein expression of other cardiac ion channels, including Cav1.3, HERG, KCNQ, and Kir6.2. The protein levels of these ion channels were not altered in diabetic mouse atria compared with control mouse atria (n = 7, p not significant for all versus control) (Fig. 1, D and E). These results suggest that not all cardiac ion channels are down-regulated in the diabetic mouse atria and that the changes in SK2 and SK3 are relevant to the pathologic changes in atrial electrical remodeling associated with DM.
Protein Expression of SK2 and SK3 Is Down-regulated in HL-1 Cells Cultured in High Glucose
When the mouse atrial cardiac myocyte cell line HL-1 was cultured in HG (25 mm), the protein expression of SK2 and SK3 was significantly down-regulated by 42 and 56%, respectively, compared with cells cultured in NG (5 mm) (n = 8, p < 0.05 for both versus control). The expression of SK1 in HL-1 cells was not altered by culture in HG, similar to the findings in diabetic mouse atria (Fig. 2, A and B). In addition, the mRNA expression of SK1 and SK2 was not significantly changed in HL-1 cells cultured in HG, but that of SK3 increased by 6.1 ± 0.1-fold (n = 3, p < 0.05 versus NG) (Fig. 2C). These results suggest that HL-1 cells are reasonable surrogates for studying the effects of DM on SK channel expression in atrial myocytes.
FIGURE 2.
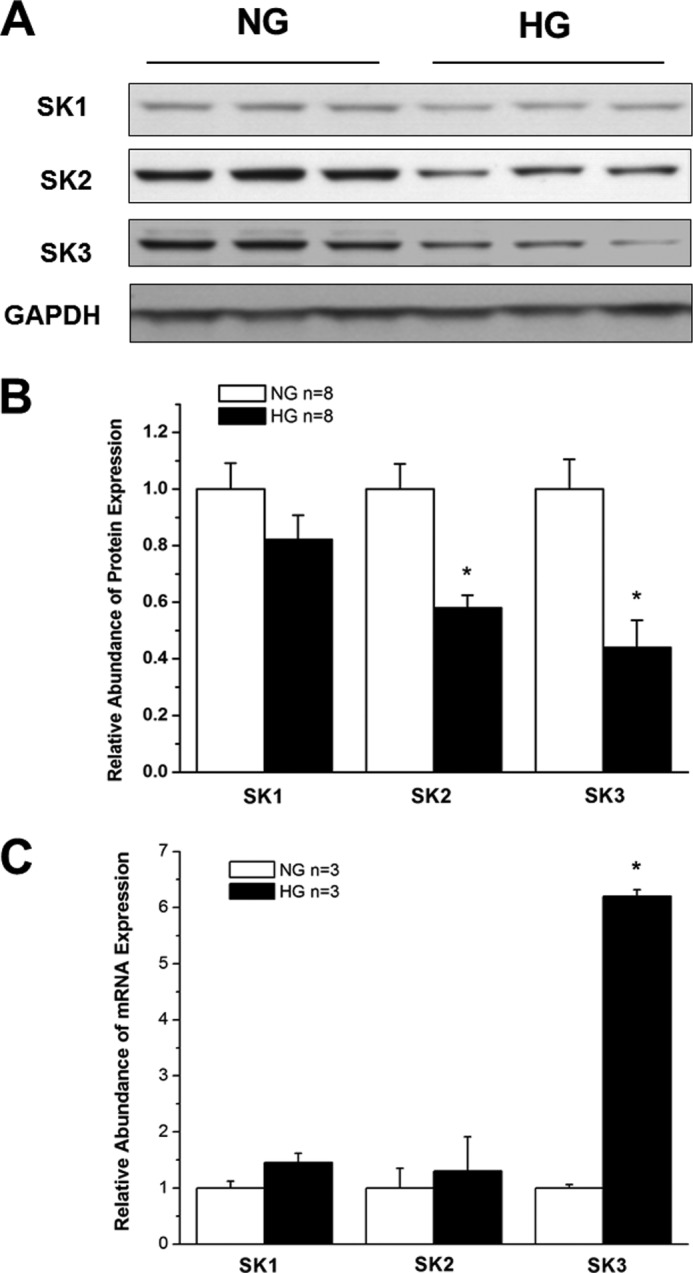
SK channel expression in HL-1 cells cultured in NG and HG. A, immunoblots of SK1, SK2, SK3, and GAPDH in HL-1 cells after 2 weeks of culture in medium containing NG (5 mm) and HG (25 mm). B, group results showing that SK2 and SK3 protein expression was significantly down-regulated in HG culture, whereas that of SK1 was not (n = 8). * represents p < 0.05 versus controls. C, group data showing relative mRNA expression of SK1, SK2, and SK3 in HL-1 cells cultured in NG and HG (n = 3). There was no significant difference for SK1 and SK2 mRNA between NG and HG culture, but that of SK3 was increased by more than 6-fold in HG. * represents p < 0.05 versus NG. Error bars represent S.E.
Apamin-sensitive and Total K+ Currents Are Down-regulated in Diabetic Atrial Myocytes
To determine the functional consequence of reduced SK2 and SK3 expression in diabetic atria, we measured the apamin-sensitive and total K+ currents in freshly isolated atrial cardiac myocytes from control and diabetic mice. Fig. 3A shows representative tracings of whole-cell K+ currents recorded in freshly isolated atrial myocytes from control and diabetic mice at baseline and after exposure to 100 pm apamin. Apamin significantly inhibited both the inward and outward components of total K+ currents in control mice but had very little effect in diabetic atrial myocytes. The current-voltage relationships of SK and total K+ currents in control and diabetic mouse atrial myocytes are shown in Fig. 3B. SK current densities were markedly reduced in diabetic mice compared with controls (Fig. 3B, left panel). These were associated with significant decreases in total K+ current densities at the action potential plateau voltages of +10 to −10 mV in diabetic myocytes (Fig. 3B, right panel).
FIGURE 3.
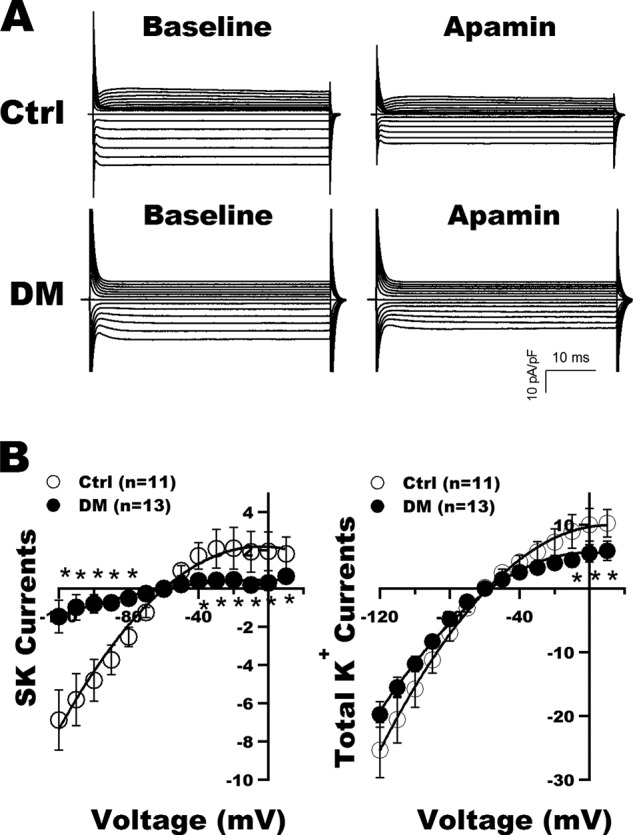
SK current recordings in atrial myocytes from control and DM mice. A, representative tracings of whole-cell K+ currents recorded in freshly isolated atrial myocytes from control (Ctrl) and diabetic mice before (Baseline) and after exposure to apamin (100 pm). B, left panel, the current-voltage relationships of SK currents (defined as K+ currents sensitive to 100 pm apamin) showed marked reduction in current densities over a wide range of testing potentials in the diabetic myocytes compared with controls. Right panel, the current-voltage relationship of total K+ currents showed a significant decrease of the total outward K+ current densities from +10 to −10 mV in diabetic atrial myocytes compared with controls. * represents p < 0.05 versus controls. Error bars represent S.E. pF, picofarad.
Action Potential Durations Are Prolonged in Diabetic Atria
We then sought to determine the role of SK channels in the regulation of atrial electrophysiology by direct recordings of action potentials from isolated atrial myocardial tissue from control and diabetic mice. Atrial tissues were stimulated at a CL of 300 ms, and resting membrane potentials, action potential amplitudes, APD50, and APD90 were measured at baseline and after exposure to apamin (100 pm for 15 min). Representative tracings are shown in Fig. 4. APD50 and APD90 were significantly prolonged in diabetic mouse atria compared with control, and exposure to apamin had no significant effect on APD in the diabetic atria (Table 1).
FIGURE 4.

Action potential recordings from control and diabetic mouse atrial preparations. A, representative action potential recordings in freshly isolated atrial tissue from a control mouse elicited by electrical impulses at a CL of 300 ms. B, superimposed action potentials from control and diabetic atrial myocytes paced at a CL of 300 ms. Action potentials were prolonged in DM. Exposure to apamin (100 pm for 15 min) produced action potential prolongations in controls (C) but had no effect in diabetic mouse atria (D).
TABLE 1.
Electrophysiological measurements of control and diabetic mouse atria
| Control (n = 11) |
DM (n = 12) |
|||
|---|---|---|---|---|
| Baseline | Apamin | Baseline | Apamin | |
| Resting potential (mV) | 72.2 ± 1.5 | 71.5 ± 1.4 | 73.2 ± 1.4 | 74.6 ± 1.6 |
| Amplitude (mV) | 86.0 ± 4.1 | 89.0 ± 4.5 | 94.0 ± 2.0 | 92.4 ± 2.6 |
| APD50 (CL of 300 ms) (ms) | 11.5 ± 1.2 | 13.4 ± 1.6 | 17.7 ± 1.8a | 18.6 ± 2.3 |
| APD90 (CL of 300 ms) (ms) | 34.4 ± 2.0 | 42.0 ± 2.6b | 42.6 ± 2.4a | 42.8 ± 4.3 |
a p < 0.05 versus control.
b p < 0.05 versus baseline.
Spontaneous Atrial Arrhythmias Are More Prevalent in DM
To further evaluate the abnormalities in atrial electrophysiology in DM, we recorded arrhythmias from isolated atrial tissues from control and diabetic mice. Arrhythmias in the form of spontaneous premature beats, early after-depolarizations, and early after-depolarization-induced trigger activities were absent in control preparations (0 of 11). However, such arrhythmias were significantly more prevalent in diabetic preparations (5 of 12) (p < 0.05 versus controls). Fig. 5 shows representative tracings of such arrhythmias recorded in atrial preparations from diabetic mice.
FIGURE 5.
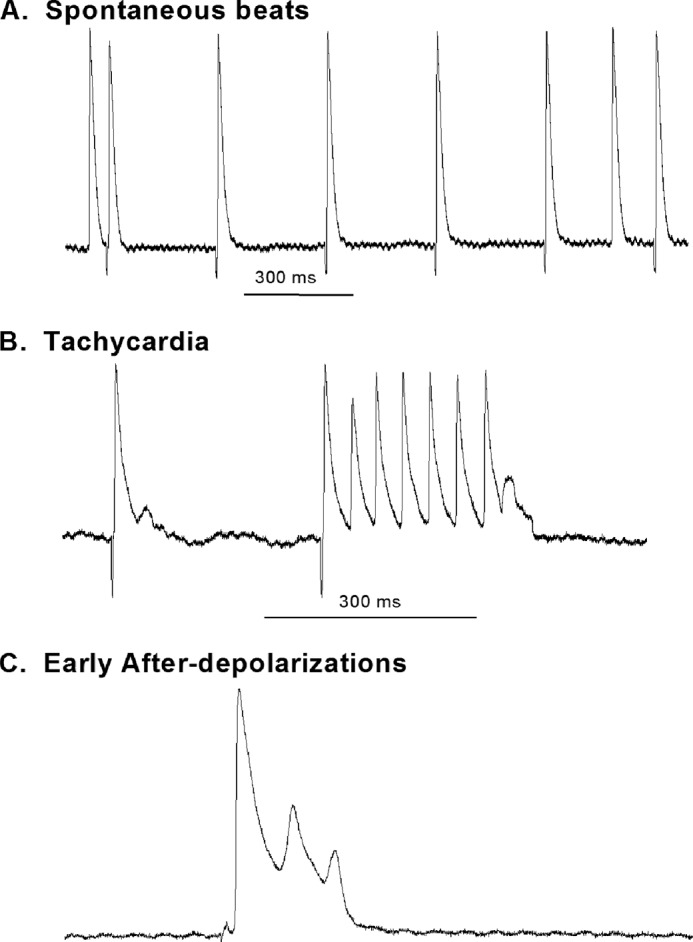
Representative tracings showing recordings of arrhythmias in DM atria. Arrhythmias were only observed in DM preparations and not in controls. Examples of arrhythmias observed are displayed. A, spontaneous atrial premature beats with the tissue constantly stimulated at a CL of 300 ms. B, a run of atrial tachycardia. The preceding beat showed evidence of an early after-depolarization, and the tachycardia terminates with a depolarization that did not reach threshold, suggesting triggered activity in operation. C, early after-depolarizations from a diabetic mouse atria.
The effects of diabetes on atrial arrhythmias were mimicked by exposure to apamin (100 pm for 30 min). Atrial arrhythmias were observed in 10% (2 of 20) of control atria but in 36.4% (8 of 22, p < 0.05 compared with control) of preparations after treatment with apamin. These results suggest that down-regulation and inhibition of SK currents are arrhythmogenic.
Increased Oxidative Stress in Diabetic Mouse Atria
We measured and compared the levels of ROS in control and diabetic mouse atria by using fluorescence microscopy with DHE. The DHE fluorescence images from control atria showed only low levels of ROS, which was represented by red fluorescence. However, under identical imaging settings and experimental conditions, atrial sections from diabetic mice showed marked bright red fluorescence, indicating elevated levels of oxidative stress (Fig. 6A). These results suggest that the increased levels of ROS might be involved in the abnormal SK channel expression in DM.
FIGURE 6.

Increased oxidative stress and down-regulation of SK channels in DM and HG. A, images of DHE fluorescence from control (left panel) and DM (right panel) mouse atria with identical imaging settings and conditions showed markedly elevated levels of oxidative stress in the DM preparation. A 24-h exposure to 50 μm H2O2 reduced the protein expression of SK2 (B) by 51% and SK3 (C) by 49% in HL-1 cells cultured with NG (n = 3) but not that of SK1, CACNA1C, and Kir2.1 channels (D) under the same conditions. Error bars represent S.E.
In support of this premise, the protein expression of SK2 and SK3 was reduced by 51 and 49%, respectively, in HL-1 cells cultured with NG after a 24-h incubation with 50 μm H2O2 (Fig. 6, B and C). In contrast, the protein expression of SK1, CACNA1C, and Kir2.1 channels was unaltered in these cells under the same conditions (Fig. 6D). Hence, exogenous H2O2 mimicked the effects of HG on SK2 and SK3 protein down-regulation. These results suggest that not all cardiac ion channels in HL-1 cells are down-regulated by H2O2 and that the changes in SK2 and SK3 are relevant to the pathologic changes in atrial electrical remodeling associated with oxidative stress.
To further elucidate the involvement of O2⨪ in HG-induced down-regulation of SK channels in HL-1 cells, the cells were pretreated for 24 h with a cell-permeable O2⨪ scavenger, Tiron (10 mm). Tiron attenuated the down-regulation of SK2 and SK3 in HL-1 cells cultured with HG (Fig. 7, A and B), resulting in preservation of SK2 and SK3 channel expression. These results indicate that ROS may play a central role in SK channel down-regulation in DM. Further molecular evidence of such a mechanism was provided by immunoprecipitation experiments using anti-nitrotyrosine antibodies. HL-1 cells cultured in HG showed a 5.2-fold increase in SK2 and a 4.7-fold increase in SK3 tyrosine nitration (n = 3 for both, p < 0.05 versus NG for both) (Fig. 7, C and D). Similar experiments did not show an increase in SK1 tyrosine nitration (Fig. 7E). Furthermore, after treatment with Tiron, immunoprecipitation experiments showed a significant reduction of protein tyrosine nitration of SK2 and SK3 in HL-1 cells cultured in HG (Fig. 7F). These results suggest that post-translational modification of these channels by ROS may underlie the molecular mechanism of channel down-regulation.
FIGURE 7.

Effects of Tiron on SK channel expression and increased tyrosine nitration of SK channels in HG. A 24-h incubation with the cell-permeable O2⨪ scavenger Tiron (10 mm) attenuated the down-regulation of SK2 (A) and SK3 (B) by H2O2 (50 μm) in HL-1 cells cultured with HG and NG (n = 3). The abundance of tyrosine-nitrated SK2 (C) and SK3 (D) in HL-1 cells cultured with HG was increased by >5-fold (n = 3). * represents p < 0.05. In contrast, tyrosine-nitrated SK1 was not changed by culture with HG in these cells (n = 3, p not significant) (E). After treatment with Tiron, the abundance of tyrosine-nitrated SK2 and SK3 was significantly reduced in HL-1 cells cultured in HG (n = 3 for each; * represents p < 0.05 versus no Tiron treatment) (F). Error bars represent S.E.
To determine whether there is increased turnover of SK2 and SK3 in HG, we treated HL-1 cells in NG and HG for 2 weeks and then examined the effects of protein synthesis inhibition by cycloheximide (100 μg/ml for 6 h) on the level of SK2 and SK3 protein expression. After 6 h of cycloheximide treatment, the level of SK2 was reduced by 36% in NG but by 69% in HG (n = 3, p < 0.05) (Fig. 8, A and B). Similarly, after 6 h of cycloheximide treatment, the level of SK3 was reduced by 65% in NG and by 92% in HG (n = 3, p < 0.05) (Fig. 8, A and C). These results confirmed that SK2 and SK3 channel protein turnover is accelerated in HG, leading to the down-regulation of channel expression.
FIGURE 8.

Increased SK2 and SK3 channel protein turnover in HG. A, immunoblots of SK2 and SK3 and GAPDH in HL-1 cells cultured with NG and HG in the presence and absence of cycloheximide (100 μg/ml for 6 h). B, group data showing that SK2 protein turnover was significantly accelerated in HG culture (n = 3). * represents p < 0.05 versus no treatment with cycloheximide and between cycloheximide-treated cells in NG and HG. C, group data showing that SK3 protein turnover was significantly accelerated in HG culture (n = 3). * represents p < 0.05 versus no treatment with cycloheximide and between cycloheximide treated-cells in NG and HG. Error bars represent S.E.
DISCUSSION
In this study, we have made several important observations. First, the expression of SK2 and SK3 is dramatically down-regulated in diabetic mouse atria, whereas that of SK1 is not, suggesting that the changes in DM are isoform-specific. Second, the down-regulation of SK2 and SK3 in diabetic mouse atria is not due to down-regulation of mRNA expression; hence, is not the result of transcriptional control. Third, the down-regulation of SK channels results in the down-regulation of apamin-sensitive K+ currents in diabetic atrial myocytes with prolongation of atrial action potential durations, indicating that these changes are physiologically relevant. Fourth, the changes of SK channels in DM are mimicked by culturing HL-1 cells in HG and by exposing them to H2O2, thus pointing toward oxidative stress as the culprit causing these changes. Fifth, there is compelling evidence that DM and HG produce increased post-translational modification of SK channels by ROS, which may lead to protein instability and channel dysfunction; meanwhile, the effects of oxidative stress can be abrogated by an ROS scavenger. These findings provide novel insights into the role of SK channels in the regulation of atrial electrophysiology in DM.
SK channels are widely distributed, and their role in the regulation of somatic excitability in the central nervous system is well established, contributing to the action potential after-hyperpolarization as well as regulating spike frequency adaptation and fundamental parameters of excitability (8, 9). In addition, SK channels are known to be important determinants of endothelial function (24). However, their role in the heart remains unclear. mRNAs of all three SK isoforms have been detected in mouse atria and ventricles; SK1 and SK2 are more abundant in the atria than in the ventricles, whereas SK3 shows similar levels of expression in both atria and ventricles (11). It is interesting that we did not observe any down-regulation of SK1 in the mouse atria in DM. Unlike the human SK1, the rodent SK1 has been reported not to form functional homomeric channels (25). The role of this finding in the regulation of SK1 and in the extrapolation of our findings in the human heart is unclear but may deserve further examination. Atrial myocytes from mice with genetic ablation of SK2 exhibit action potential prolongation and inducible atrial fibrillation (19). The dramatic down-regulation of SK channels in diabetic mouse atria is associated with significant action potential prolongation, which may lead to an increased propensity for development of atrial arrhythmias in DM.
The role of SK channels in the development of atrial arrhythmias was also suggested by a report that expression of SK2 is up-regulated in the rabbit pulmonary vein but not in Bachmann bundle after a 3-h intermittent burst pacing protocol that resulted in shortening of the pulmonary vein action potential. This effect is Ca2+-dependent and is abolished by apamin (26). Although we cannot extrapolate the effects of a 3-h intervention to steady-state changes in chronic pathologic conditions such as DM, these results nonetheless indicate that both up-regulation and down-regulation of SK2 may result in arrhythmia development, underscoring the physiological importance of these channels. The role of SK channels in the pathogenesis of AF is further supported by results from a recent genome-wide association study that showed that the common variants of KCNN3, which encodes SK3, are associated with lone atrial fibrillation (7). In addition, SK2 has been implicated in the regulation of atrioventricular nodal physiology (27). All these findings support the notion that SK channels play an important role in the regulation of atrial electrophysiology and arrhythmogenesis.
Our novel finding that SK channels are significantly down-regulated in DM provides further support that SK channels are involved in the atrial electrical remodeling in disease states such as DM. Although patients with permanent AF are known to have shortened atrial refractoriness and action potentials (28), these changes were thought to be the consequence of AF rather than the cause of AF (29, 30). It is recognized that the pathogenesis of AF is multifactorial, but once present it alters the electrophysiological properties of the atrial myocardium to promote self-perpetuation of the arrhythmia (28, 29). Hence, both action potential shortening and action potential lengthening may lead to arrhythmia development. A KCNA5 loss-of-function mutation is associated with idiopathic familial AF (31). KCNA5 encodes Kv1.5, which underlies IKur, the ultra-rapid delayed rectifier potassium currents; the associated mutation results in action potential prolongation and development of early after-depolarizations. The down-regulation of atrial SK channels in DM is also associated with APD prolongation and triggered activity from early after-depolarizations. Moreover, the role of SK channels in AF is underscored by the increased inducibility of AF in SK2-null mice (19). In our study, we found that inhibition of SK channels by apamin resulted in increased incidence of arrhythmia in normal atrial preparations. It is envisioned that the electrophysiological changes resulting from K+ channel down-regulation promote the development of “atrial torsade de pointes” for AF initiation. Indeed, a recent report showed that apamin induces early after-depolarizations and torsade de pointes in failing rabbit ventricles, confirming that suppression of SK channels is proarrhythmic (32).
The mechanism underlying the down-regulation of SK channels in AF is unclear. DM is known to be associated with increased oxidative stress, which we confirmed in the diabetic mouse atria (Fig. 6). Our findings that the effects of DM on SK channel expression were mimicked by exposure to H2O2 and abrogated by the antioxidant Tiron (Fig. 7) suggest that ROS are involved. These contentions were further substantiated by the dramatic increase in tyrosine nitration of SK channels. Superoxide reacts with nitric oxide to form peroxynitrite, a highly reactive oxidizing and nitrating agent that produces an array of biological actions contributing to organ dysfunction, and tyrosine nitration of proteins is a recognized biomarker for endogenous peroxynitrite formation (33, 34). We have reported that in diabetic rat vessels increased tyrosine nitration of 12-lipoxygenase resulted in loss of function of enzyme activity, leading to impaired vasodilator production and vessel dysfunction (21). Our findings in this study also suggest that increased oxidative stress in DM causes SK channel down-regulation through post-translational modification of SK channels, resulting in channel inactivation; SK channel down-regulation is also be produced by increased channel protein turnover (Fig. 8).
Taken together, our study supports the important functional roles of SK channels in diabetic mouse atria. Moreover, down-regulation of the expression of SK2 and SK3 channels results in prolongation of the atrial action potential, which is associated with an increased incidence of arrhythmias, possibly through an increased propensity for early after-depolarizations and triggered activity development. To our knowledge, the present study is the first comprehensive analysis of the changes in three SK channel subtypes and IK,Ca, the calcium-activated potassium currents, in diabetic mice. Our results provide new insights into the mechanisms of cardiac electrical remodeling in diabetes. These findings may have important clinical implications because pharmacological inhibitors of K+ channels are commonly used to treat arrhythmias and may potentially contribute to proarrhythmia adverse effects, especially in diabetic patients who have reduced repolarization reserve partly due to SK channel down-regulation.
This work was supported, in whole or in part, by National Institutes of Health Grants HL-080118 and HL-074180 (to H.-C. L.). This work was also supported by the Xijing Hospital, Fourth Military Medical University, Xi'an, China; the Ruijin Hospital, Shanghai JiaoTong University School of Medicine, Shanghai, China; National Natural Science Foundation of the Peoples' Republic of China Grants 81000686 and 81470479 (to F. Y.) and 81400248 (to T.-Y. L.); and American Diabetes Association Grant 1-12-BS-119 (to T. L.).
- DM
- diabetes mellitus
- SK
- small conductance Ca2+-activated K+
- AF
- atrial fibrillation
- APD
- action potential duration
- APD50 and APD90
- action potential durations at 50 and 90% repolarization, respectively
- NG
- normal glucose
- HG
- high glucose
- ROS
- reactive oxygen species
- CL
- cycle length
- DHE
- dihydroethidium
- HERG
- human ether-à-go-go-related gene.
REFERENCES
- 1. Centers for Disease Control and Prevention (2011) National Diabetes Fact Sheet: National Estimates and General Information on Diabetes and Prediabetes in the United States, 2011, United States Department of Health and Human Services, Centers for Disease Control and Prevention, Atlanta, GA [Google Scholar]
- 2. Goldstein L. B., Bushnell C. D., Adams R. J., Appel L. J., Braun L. T., Chaturvedi S., Creager M. A., Culebras A., Eckel R. H., Hart R. G., Hinchey J. A., Howard V. J., Jauch E. C., Levine S. R., Meschia J. F., Moore W. S., Nixon J. V., Pearson T. A. (2011) Guidelines for the primary prevention of stroke: a guideline for healthcare professionals from the American Heart Association/American Stroke Association. Stroke 42, 517–584 [DOI] [PubMed] [Google Scholar]
- 3. Resnick H. E., Howard B. V. (2002) Diabetes and cardiovascular disease. Annu. Rev. Med. 53, 245–267 [DOI] [PubMed] [Google Scholar]
- 4. Kannel W. B., Benjamin E. J. (2008) Status of the epidemiology of atrial fibrillation. Med. Clin. North Am. 92, 17–40 [DOI] [PMC free article] [PubMed] [Google Scholar]
- 5. Movahed M. R., Hashemzadeh M., Jamal M. M. (2005) Diabetes mellitus is a strong, independent risk for atrial fibrillation and flutter in addition to other cardiovascular disease. Int. J. Cardiol. 105, 315–318 [DOI] [PubMed] [Google Scholar]
- 6. Jongnarangsin K., Suwanagool A., Chugh A., Crawford T., Good E., Pelosi F., Jr., Bogun F., Oral H., Morady F. (2012) Effect of catheter ablation on progression of paroxysmal atrial fibrillation. J. Cardiovasc. Electrophysiol. 23, 9–14 [DOI] [PubMed] [Google Scholar]
- 7. Ellinor P. T., Lunetta K. L., Glazer N. L., Pfeufer A., Alonso A., Chung M. K., Sinner M. F., de Bakker P. I., Mueller M., Lubitz S. A., Fox E., Darbar D., Smith N. L., Smith J. D., Schnabel R. B., Soliman E. Z., Rice K. M., Van Wagoner D. R., Beckmann B. M., van Noord C., Wang K., Ehret G. B., Rotter J. I., Hazen S. L., Steinbeck G., Smith A. V., Launer L. J., Harris T. B., Makino S., Nelis M., Milan D. J., Perz S., Esko T., Köttgen A., Moebus S., Newton-Cheh C., Li M., Möhlenkamp S., Wang T. J., Kao W. H., Vasan R. S., Nöthen M. M., MacRae C. A., Stricker B. H., Hofman A., Uitterlinden A. G., Levy D., Boerwinkle E., Metspalu A., Topol E. J., Chakravarti A., Gudnason V., Psaty B. M., Roden D. M., Meitinger T., Wichmann H. E., Witteman J. C., Barnard J., Arking D. E., Benjamin E. J., Heckbert S. R., Kääb S. (2010) Common variants in KCNN3 are associated with lone atrial fibrillation. Nat. Genet. 42, 240–244 [DOI] [PMC free article] [PubMed] [Google Scholar]
- 8. Adelman J. P., Maylie J., Sah P. (2012) Small-conductance Ca2+-activated K+ channels: form and function. Annu. Rev. Physiol. 74, 245–269 [DOI] [PubMed] [Google Scholar]
- 9. Stocker M. (2004) Ca2+-activated K+ channels: molecular determinants and function of the SK family. Nat. Rev. Neurosci. 5, 758–770 [DOI] [PubMed] [Google Scholar]
- 10. Maylie J., Bond C. T., Herson P. S., Lee W. S., Adelman J. P. (2004) Small conductance Ca2+-activated K+ channels and calmodulin. J. Physiol. 554, 255–261 [DOI] [PMC free article] [PubMed] [Google Scholar]
- 11. Tuteja D., Xu D., Timofeyev V., Lu L., Sharma D., Zhang Z., Xu Y., Nie L., Vázquez A. E., Young J. N., Glatter K. A., Chiamvimonvat N. (2005) Differential expression of small-conductance Ca2+-activated K+ channels SK1, SK2, and SK3 in mouse atrial and ventricular myocytes. Am. J. Physiol. Heart Circ. Physiol. 289, H2714–H2723 [DOI] [PubMed] [Google Scholar]
- 12. Zhang D. M., He T., Katusic Z. S., Lee H. C., Lu T. (2010) Muscle-specific F-box only proteins facilitate BK channel β1 subunit downregulation in vascular smooth muscle cells of diabetes mellitus. Circ. Res. 107, 1454–1459 [DOI] [PMC free article] [PubMed] [Google Scholar]
- 13. Claycomb W. C., Lanson N. A., Jr., Stallworth B. S., Egeland D. B., Delcarpio J. B., Bahinski A., Izzo N. J., Jr. (1998) HL-1 cells: a cardiac muscle cell line that contracts and retains phenotypic characteristics of the adult cardiomyocyte. Proc. Natl. Acad. Sci. U.S.A. 95, 2979–2984 [DOI] [PMC free article] [PubMed] [Google Scholar]
- 14. Lu T., He T., Katusic Z. S., Lee H. C. (2006) Molecular mechanisms mediating inhibition of human large conductance Ca2+-activated K+ channels by high glucose. Circ. Res. 99, 607–616 [DOI] [PubMed] [Google Scholar]
- 15. Lang D., Kredan M. B., Moat S. J., Hussain S. A., Powell C. A., Bellamy M. F., Powers H. J., Lewis M. J. (2000) Homocysteine-induced inhibition of endothelium-dependent relaxation in rabbit aorta: role for superoxide anions. Arterioscler. Thromb. Vasc. Biol. 20, 422–427 [DOI] [PubMed] [Google Scholar]
- 16. Lu T., Zhang D. M., Wang X. L., He T., Wang R. X., Chai Q., Katusic Z. S., Lee H. C. (2010) Regulation of coronary arterial BK channels by caveolae-mediated angiotensin II signaling in diabetes mellitus. Circ. Res. 106, 1164–1173 [DOI] [PMC free article] [PubMed] [Google Scholar]
- 17. Lee H. C., Cai J. J., Arnar D. O., Shibata E. F., Martins J. B. (1996) Mechanism of α2 adrenergic modulation of canine cardiac Purkinje action potential. J. Pharmacol. Exp. Ther. 278, 597–606 [PubMed] [Google Scholar]
- 18. Lee H. C., Lu T., Weintraub N. L., VanRollins M., Spector A. A., Shibata E. F. (1999) Effects of epoxyeicosatrienoic acids on the cardiac sodium channels in isolated rat ventricular myocytes. J. Physiol. 519, 153–168 [DOI] [PMC free article] [PubMed] [Google Scholar]
- 19. Li N., Timofeyev V., Tuteja D., Xu D., Lu L., Zhang Q., Zhang Z., Singapuri A., Albert T. R., Rajagopal A. V., Bond C. T., Periasamy M., Adelman J., Chiamvimonvat N. (2009) Ablation of a Ca2+-activated K+ channel (SK2 channel) results in action potential prolongation in atrial myocytes and atrial fibrillation. J. Physiol. 587, 1087–1100 [DOI] [PMC free article] [PubMed] [Google Scholar]
- 20. Xu Y., Tuteja D., Zhang Z., Xu D., Zhang Y., Rodriguez J., Nie L., Tuxson H. R., Young J. N., Glatter K. A., Vázquez A. E., Yamoah E. N., Chiamvimonvat N. (2003) Molecular identification and functional roles of a Ca2+-activated K+ channel in human and mouse hearts. J. Biol. Chem. 278, 49085–49094 [DOI] [PubMed] [Google Scholar]
- 21. Zhou W., Wang X. L., Kaduce T. L., Spector A. A., Lee H. C. (2005) Impaired arachidonic acid-mediated dilation of small mesenteric arteries in Zucker diabetic fatty rats. Am. J. Physiol. Heart Circ. Physiol. 288, H2210–H2218 [DOI] [PubMed] [Google Scholar]
- 22. Bustin S. A. (2002) Quantification of mRNA using real-time reverse transcription PCR (RT-PCR): trends and problems. J. Mol. Endocrinol. 29, 23–39 [DOI] [PubMed] [Google Scholar]
- 23. Burnham M. P., Bychkov R., Félétou M., Richards G. R., Vanhoutte P. M., Weston A. H., Edwards G. (2002) Characterization of an apamin-sensitive small-conductance Ca2+-activated K+ channel in porcine coronary artery endothelium: relevance to EDHF. Br. J. Pharmacol. 135, 1133–1143 [DOI] [PMC free article] [PubMed] [Google Scholar]
- 24. Félétou M. (2009) Calcium-activated potassium channels and endothelial dysfunction: therapeutic options? Br. J. Pharmacol. 156, 545–562 [DOI] [PMC free article] [PubMed] [Google Scholar]
- 25. D'hoedt D., Hirzel K., Pedarzani P., Stocker M. (2004) Domain analysis of the calcium-activated potassium channel SK1 from rat brain. Functional expression and toxin sensitivity. J. Biol. Chem. 279, 12088–12092 [DOI] [PubMed] [Google Scholar]
- 26. Ozgen N., Dun W., Sosunov E. A., Anyukhovsky E. P., Hirose M., Duffy H. S., Boyden P. A., Rosen M. R. (2007) Early electrical remodeling in rabbit pulmonary vein results from trafficking of intracellular SK2 channels to membrane sites. Cardiovasc. Res. 75, 758–769 [DOI] [PMC free article] [PubMed] [Google Scholar]
- 27. Zhang Q., Timofeyev V., Lu L., Li N., Singapuri A., Long M. K., Bond C. T., Adelman J. P., Chiamvimonvat N. (2008) Functional roles of a Ca2+-activated K+ channel in atrioventricular nodes. Circ. Res. 102, 465–471 [DOI] [PMC free article] [PubMed] [Google Scholar]
- 28. Schotten U., Verheule S., Kirchhof P., Goette A. (2011) Pathophysiological mechanisms of atrial fibrillation: a translational appraisal. Physiol. Rev. 91, 265–325 [DOI] [PubMed] [Google Scholar]
- 29. Kourliouros A., Savelieva I., Kiotsekoglou A., Jahangiri M., Camm J. (2009) Current concepts in the pathogenesis of atrial fibrillation. Am. Heart J. 157, 243–252 [DOI] [PubMed] [Google Scholar]
- 30. Van Wagoner D. R., Pond A. L., McCarthy P. M., Trimmer J. S., Nerbonne J. M. (1997) Outward K+ current densities and Kv1.5 expression are reduced in chronic human atrial fibrillation. Circ. Res. 80, 772–781 [DOI] [PubMed] [Google Scholar]
- 31. Olson T. M., Alekseev A. E., Liu X. K., Park S., Zingman L. V., Bienengraeber M., Sattiraju S., Ballew J. D., Jahangir A., Terzic A. (2006) Kv1.5 channelopathy due to KCNA5 loss-of-function mutation causes human atrial fibrillation. Hum. Mol. Genet 15, 2185–2191 [DOI] [PubMed] [Google Scholar]
- 32. Chang P. C., Hsieh Y. C., Hsueh C. H., Weiss J. N., Lin S. F., Chen P. S. (2013) Apamin induces early after-depolarizations and torsades de pointes ventricular arrhythmia from failing rabbit ventricles exhibiting secondary rises in intracellular calcium. Heart Rhythm 10, 1516–1524 [DOI] [PMC free article] [PubMed] [Google Scholar]
- 33. Crow J. P., Ischiropoulos H. (1996) Detection and quantitation of nitrotyrosine residues in proteins: in vivo marker of peroxynitrite. Methods Enzymol. 269, 185–194 [DOI] [PubMed] [Google Scholar]
- 34. Turko I. V., Murad F. (2002) Protein nitration in cardiovascular diseases. Pharmacol. Rev. 54, 619–634 [DOI] [PubMed] [Google Scholar]