

Background: The physiological functions of the O-GlcNAcase in development and metabolism are unclear.
Results: Conditional disruption of the O-GlcNAcase in mice leads to metabolic deregulation and semi-penetrant perinatal lethality.
Conclusion: Murine O-GlcNAcase maintains metabolic homeostasis and is particularly important during pregnancy and the postpartum period of development.
Significance: The findings reported here suggest a general role for OGA in the overall maintenance of metabolic homeostasis.
Keywords: Glycogen Synthase Kinase 3 (GSK-3), Metabolism, Mouse Genetics, O-GlcNAcylation, O-Linked N-Acetylglucosamine (O-GlcNAc), O-GlcNAcase, Perinatal Lethality
Abstract
O-GlcNAc cycling is maintained by the reciprocal activities of the O-GlcNAc transferase and the O-GlcNAcase (OGA) enzymes. O-GlcNAc transferase is responsible for O-GlcNAc addition to serine and threonine (Ser/Thr) residues and OGA for its removal. Although the Oga gene (MGEA5) is a documented human diabetes susceptibility locus, its role in maintaining insulin-glucose homeostasis is unclear. Here, we report a conditional disruption of the Oga gene in the mouse. The resulting homozygous Oga null (KO) animals lack OGA enzymatic activity and exhibit elevated levels of the O-GlcNAc modification. The Oga KO animals showed nearly complete perinatal lethality associated with low circulating glucose and low liver glycogen stores. Defective insulin-responsive GSK3β phosphorylation was observed in both heterozygous (HET) and KO Oga animals. Although Oga HET animals were viable, they exhibited alterations in both transcription and metabolism. Transcriptome analysis using mouse embryonic fibroblasts revealed deregulation in the transcripts of both HET and KO animals specifically in genes associated with metabolism and growth. Additionally, metabolic profiling showed increased fat accumulation in HET and KO animals compared with WT, which was increased by a high fat diet. Reduced insulin sensitivity, glucose tolerance, and hyperleptinemia were also observed in HET and KO female mice. Notably, the respiratory exchange ratio of the HET animals was higher than that observed in WT animals, indicating the preferential utilization of glucose as an energy source. These results suggest that the loss of mouse OGA leads to defects in metabolic homeostasis culminating in obesity and insulin resistance.
Introduction
To date, ∼1,000 proteins have been determined to possess the O-GlcNAc modification (1–4). Furthermore, OGT2 and OGA have been found to be ubiquitously expressed in all tissues examined, exhibiting the highest levels in brain, pancreas and placenta (5–7). It is thought that the O-GlcNAc modification can alter protein function and downstream signaling in a manner that is analogous to protein phosphorylation (1, 3, 8–10). Because the substrate of OGT, uridine diphosphate N-acetylglucosamine (UDP-GlcNAc), is derived from the hexosamine biosynthetic pathway, which utilizes glucose, glutamine, acetyl CoA, and uridine diphosphate (UDP) to synthesize UDP-GlcNAc, it is thought that O-GlcNAc cycling may regulate cellular and metabolic processes in response to nutritional status, integrating multiple signaling pathways simultaneously. As such, substrate availability may be directly responsive to nutrient levels and consequently modulate protein O-GlcNAcylation status to, in turn, fine-tune metabolic status (8, 11, 12). Furthermore, it is likely that the extensive cross-talk between the phosphorylation and O-GlcNAcylation of proteins' serine and threonine residues could facilitate the concurrent modulation of multiple pathways in a nutrient-dependent manner (1, 8, 9).
Although Oga was first identified as the meningioma expressed antigen 5 (Mgea5) (13, 14), it was subsequently shown to be an O-GlcNAc-selective hexosaminidase with a neutral pH optimum (6, 15). Mammalian Oga is a highly conserved gene that is present as a single genomic copy located on human chromosome 10 (cytological position 10q24.1). The mouse Mgea5 gene encoding Oga is located on chromosome 19 and contains 16 exons spanning ∼31.5 kb (Fig. 1A). Several Oga splice variants have been detected, and these isoforms are differentially targeted within the cell (14, 16, 17). Furthermore, the Oga gene has been identified as a diabetes susceptibility locus in humans due to the fact that multiple single nucleotide polymorphism (SNP) sites of Oga are associated with an increased incidence of late onset diabetes among Mexican Americans (18–20). In addition, “Goto kakizaki” (GK) rats, which have a deletion at exon 8 in the Oga gene residing in chromosome 1, exhibit spontaneous diabetes (21).
FIGURE 1.

A, schematic diagram of the mouse Oga gene. B, Cre-loxP insertion strategy targeting Oga deletion at exon 1. C, breeding strategy employed to generate the Oga KO mice. Male chimeric mice bearing a floxed Oga allele were crossed with female MMTV-Cre mice expressing Cre in the oocyte in a two-step breeding strategy to remove both neo and floxed sites. HET Oga animals with a floxed neo cassette were intercrossed with siblings, resulting in Oga KO animals with 3% perinatal survival. D, PCR data confirming the Oga deletion status in HET and KO animals.
Overall, it is known that perturbations in O-GlcNAc cycling impact chronic metabolic diseases such as diabetes, neurodegenerative disease, and cancer (3, 8, 11, 15, 22–25). These disease states may be a result of deregulated transcriptional machinery, as these perturbations in O-GlcNAc cycling likely alter the O-GlcNAcylation status of many proteins that are known to be modified, including transcription factors, histones, and RNA polymerase II (1, 3, 9, 12, 26, 27). Interestingly, mammalian Ogt is an X-linked, single copy gene that was shown to be essential for mouse embryonic stem cell viability (8, 28–32). Furthermore, studies using tissue-specific Ogt ablation in mice demonstrated the importance of the O-GlcNAc modification for normal tissue development and function (29).
Despite what has been shown previously, detailed analysis of the role of O-GlcNAcylation can be complicated due to the dynamic nature of the modification and the lack of a representative mammalian model system. However, several invertebrate models with altered O-GlcNAc cycling have been explored previously. Specifically in Caenorhabditis elegans, ogt-1- and oga-1-deficient mutants were found to be both viable and fertile but demonstrated alterations in longevity, dauer formation, macronutrient storage, and stress response (26, 33–39). In Drosophila, Ogt is known to be allelic to super sex combs (Sxc), the mutation of which results in a homeotic phenotype (40–42) and insulin signaling defects (25, 43). Although these models have provided valuable insights into the function of O-GlcNAc cycling in invertebrates, it remains unclear how well this is conserved in mammals.
The molecular roles of perturbations in O-GlcNAc cycling have been studied in vitro using several OGA inhibitors (44–47). This work has provided important information about the varied effects of altered O-GlcNAc cycling. However, these methods are limited by the differing specificity of the available OGA inhibitors. Inhibitor treatments in tissue culture experiments may not accurately reflect systemic homeostasis or the complex signaling pathways present in an entire organism. As such, it is important to establish a model system to genetically dissect the potential functions of O-GlcNAcylation in an intact organism. Recently, Yang et al. (48) examined a targeted mouse Oga hypomorphic allele generated by gene-trap technology. These authors reported both genomic instability and cell cycle-specific age-related effects of O-GlcNAc cycling perturbations using MEFs derived from these animals. They also noted that O-GlcNAcase heterozygosity suppressed intestinal tumorigenesis (49). Unfortunately, although informative, the gene-trap approach is limited in that it often produces hypomorphic rather than null alleles and also cannot produce conditional knock-out alleles; these facts encouraged us to adopt alternative approaches.
In this study, we employed a Cre-loxp-based conditional deletion strategy targeting the promoter and exon 1 of the Oga gene to create a conditional null allele (50, 51). Here, we describe methods to elucidate the metabolic effects of OGA deletion using our newly developed model system, both in MEF cells derived from HET and KO animals and in adult mice. In these studies, we find that Oga null pups exhibit a high incidence of neonatal lethality associated with low glycogen stores and hypoglycemia. We also observe that total GSK3β expression is altered in both KO MEFs and mouse tissue, although the GSK3β phosphorylation-dependent insulin response is altered in KO MEF cells alone. HET mice show elevated RER consistent with the preferential utilization of carbohydrate as opposed to fat as an energy source. Furthermore, metabolic analysis shows that HET females possess increased fat mass, reduction in insulin sensitivity, and other hallmarks of metabolic syndrome.
MATERIALS AND METHODS
Floxed Construct with OGA Gene Targeting
The floxed Oga construct was designed to delete exon 1 to produce Oga null mice devoid of all splice isoforms. The ∼10.5-kb region used to construct the targeting vector (pGKNeo cassette) was first subcloned from a positively identified B6 BAC clone using homologous recombination (inGeneious Targeted Laboratory Inc., Ronkonkoma, NY). The single loxP site and a unique restriction digestion site (EcoRI) were inserted upstream of exon 1, allowing diagnostic identification of the floxed allele. The loxP/FRT-flanked neo cassette (∼8.0 kb long) was inserted downstream of exon 1. The target region was ∼1.1 kb, including exon 1. The target vector was linearized by NotI digestion and then transfected into C57Bl/6 embryonic stem cells by electroporation. After G418 selection, surviving clones were expanded for PCR analysis to identify recombinant embryonic stem (ES) cell clones. HET mice bearing a floxed Oga gene were derived from these ES cells. Seven founder (F0) mice bearing this construct were identified by screening for the inserted DNA by PCR amplification and sequencing of a 2.7-kb fragment. HET Oga floxed mice (Ogafloxed/+) were housed at the animal facility at the National Institutes of Health, and experiments were conducted according to the National Institutes of Health guidelines for animal care and use protocols. They were fed ad libitum a normal chow diet and water. Pregnant and newborn pups were given access to a high energy (high lipid) soft diet. Ogafloxed/+ were cross-bred to generate KO floxed chimera mice (Ogafloxed/floxed). Pups were weaned after 3 weeks and genotyped using tail DNA (see below). Although more than 50 littermates from three breeding pairs were monitored and tested, no live births of KO Oga floxed pups were detected. For embryos with the Oga floxed KO gene, normal size was observed at embryonic day 12.5.
As an alternative breeding strategy, HET Oga floxed male mice (Ogafloxed/+) were cross-bred with the murine mammary tumor virus-Cre female mice to derive Oga HET mice. This female murine mammary tumor virus-LTR line A mouse expressing Cre recombinase in the oocytes was a kind gift from Dr. L. Hennighausen's laboratory (NIDDK, National Institutes of Health). Details of the Cre expression pattern in this (line A) mouse have been described previously (83). The resultant F1 generation littermates were genotyped using the PCR protocol developed to identify the deletion of Oga as described below. These crosses generated eight Oga HET pups, some of which also possessed deletions in the neo gene. Oga HET mice were selected and cross-bred to generate Oga KO mice lacking the neo cassette. The Cre allele was detected by the presence of a lighter coat color in the Cre-positive animals.
Cross-breeding of these Oga HET littermates did not produce any Oga KO offspring in the F2 generation. After monitoring several breeding pairs and screening more than 400 pups, we were unable to find any surviving Oga KO animals. We subsequently examined multiple embryonic stages and noted that despite their lack of post-embryonic survival, Oga KO embryos do in fact to appear to be viable until birth.
PCR Genotyping Protocols
DNA was extracted from the mouse tails as described by Miller et al. (84). The genotyping PCR primers used were as follows: (a) forward primer OGA-UTR1F 5′-ACC GCA CAC TCT CCA TCG CCA TAA-3′; (b) reverse primer 1 OGA-UTR4R 5′-CCC GCT TCC TGT TTA TCC GCA CTG-3′; and (c) reverse primer 2 OGAR7 5′-CAC CGC CTC CTC CTC CGA CAA ATC-3′. PCRs were performed in an Eppendorf master cycler using the hot start Taq polymerase (TaKaRa) enzyme. About 50 ng of DNA was used in 20-μl reactions with 80 pmol of dNTP mixture and 10 pmol of each primer. PCR amplification was performed after 1 min of 94 °C heat inactivation followed by cycle conditions of 94 °C denaturing for 30 s, 60 °C annealing for 30 s, and 72 °C extension for 3 min, repeating 35 cycles with a final extension reaction for 5 min at 72 °C. (This primer set was designed to yield a unique banding pattern for WT (750 bp), HET (550 and 750 bp), and KO (550 bp) Oga deletion.) Another PCR was performed to detect the presence of exon 1 using the primer pair OGAEX1F (5′-GCCCCCGCCGAGAGGAA-3′) and OGAEX2R (5′-CCACGACACCGCACAGGA-3′) located in the exon 1 region. The reaction conditions included an incubation at 94 °C for 20 s, 60 °C for 20 s, and 72 °C for 30 s, repeating 30 cycles and ending the reaction with a 5-min extension at 72 °C. The product of this PCR is a 300-bp product in WT and HET animals with no band detectable in KO animals. Using the reaction procedure described above, the presence of the neo cassette was identified by a PCR using the primer pair forward 5′ 5′-TGC TCC TGC CGA GAA AGT ATC CAT CAT GGC and reverse 5′-CGC CAA GCT CTT CAG CAA TAT CAC GGG TAG at 29 cycles. This PCR yields a 390-bp product in animals possessing the neo gene.
Embryonic Studies
Embryos at different developmental stages were collected at 13.5, 16, and 18 days. Tail DNA was used for genotyping. Both fetuses and placentas of 16- and 18-day-old fetuses were fixed in Bouin's reagent for histopathological examinations. Samples were processed and embedded in paraffin at the NCI core facility (Frederick, MD). Subsequent sagittal sections of these fetuses and placenta were stained with hematoxylin/eosin and examined at the same facility.
MEF Isolation
MEFs were collected at embryonic days 12.5–13 following the protocol from Fred Hutchinson Cancer Center. Cells were cultured in DMEM supplied with 10% FBS, 100 units/ml penicillin, and 100 μg/ml streptomycin. Cells were frozen under liquid nitrogen at passage 1–3 in 7% DMSO and 20% FBS for future use. Cells were analyzed to confirm Oga mRNA and protein expression patterns as described below.
mRNA and Protein Analysis
To evaluate the whole body expression in Oga KO mice, tissue and MEF cells were examined for mRNA expression by semi-quantitative RT-PCR. The total RNA was isolated from the tissue using TRIzol reagent (Invitrogen). DNase digestion was performed (Qiagen), and the products were purified using the RNeasy mini kit according to the manufacturer's instructions. cDNA was synthesized from 5 μg of total RNA using Superscriptase III (Invitrogen) in a 20-ml reaction volume according to the enzyme supplier's instructions. The final reaction was diluted to 100 μl, and semi-quantitative PCR was performed in a 20-μl reaction mixture containing 2 μl of cDNA, using HS TaqDNA polymerase (TaKaRa). The following primer pairs were used for amplifying mouse OGA: long isoform (a) sense 5′-TGTGCAGTGGTTAGGGTGTC-3′ and (b) antisense 5′-GAAGGGAAGTTGGCAAGGAAAGTT-3′, and for the short isoform (a) sense 5′-GGCAAATTTCCATGTTCTTCAG-3′ and (b) antisense 5′-ACCCCGTTGCAGTCTTTGTG-3′. 18 S rRNA was used as a control and was amplified using the following primers: (a) forward 5′-CCCGGGGAGGTAGTGACGAAAAAT-3′ and (b) reverse 5′-CGCCCGCTCCCAAGATCCAACTAC-3′. The reaction mixture was denatured at 94 °C for 1 min and amplified using 30 cycles for the OGA isoforms and 24 cycles for the 18 S rRNA fragment. The cycling conditions for all reactions consisted of a 30-s 94 °C denaturing step, a 30-s 56 °C annealing step, and a 30-s 72 °C polymerization step, followed by a single 5-min extension at 72 °C.
O-GlcNAcylated protein levels in each group were examined by Western blotting using two anti-O-GlcNAc antibodies (RL2 (MA1-072: Affinity Bio Reagents, CO) and CTD110.6 (Covance, CA)). Liver samples were excised from euthanized mice and immediately frozen in liquid nitrogen and stored at −80 °C. Tissue samples were processed using glass homogenizers and the addition of 1:5 (w/v) of T-PER lysis buffer (Pierce) with cOmplete EDTA-free protease inhibitor mixture and phos-STOP (both from Roche Applied Science) added per the manufacturers' recommendations. Lysates were clarified by centrifugation at 5,000 × g for 10 min at 4 °C. The lysate was further homogenized by 20 passages through a 25-gauge syringe, and the resultant material was pelleted at 14,000 × g for 10 min. Protein concentration was determined using a BCA assay (Pierce). Equal amounts (50 μg) of protein were boiled with sample buffer (LDS, Invitrogen) for 10 min and resolved using precast NUPAGE BisTris mini gels (10% and 1.5 mm thickness) using MOPS buffer. Gels were transferred to a nitrocellulose membrane and blocked with Odyssey blocking buffer (LI-COR Biosciences). The blots were first probed with either anti-OGA (ProteinTech Group Inc., catalog no.14711-1-AP) or anti-OGT (Santa Cruz Biotechnology, catalog no.sc32921) primary antibodies and then fluorescent secondary antibodies (LI-COR Biosciences IRDye800-CS donkey anti-rabbit IgG catalog no. 926-32213 or IRD680-LT goat anti-mouse IgG catalog no. 926-32220) and were finally imaged using an Odyssey Infrared Imaging System (LI-COR Biosciences). For both OGA and OGT, actin levels were used as the loading control (anti-actin antibody Sigma, catalog no. A5441). Protein expression levels and the phosphorylation patterns of WT, HET, and KO MEFs were evaluated under basal and insulin-stimulated conditions (100 nm) using Western blot analysis. Total GSK3β and phospho-GSK3β Ser-9 antibodies were from Cell Signaling Technology (GSK, catalog no. 9332 and GSKβ3 Ser-9 catalog no. 9336S).
Microarray
Global gene expression profiles of WT and KO MEFs were investigated by microarray using Affymetrix array chips in triplicate. RNA was extracted as described above, and quality was tested in a BioAnalyzer (Agilent Technologies) using RNA6000 nano chips. High quality RNA extracted from female embryos from each genotype (WT, HET, and KO) was used to perform the microarray analysis. Affymetrix Mouse Genome 430 2.0 chips were used in technical triplicates for each genotype. cDNA prepared using Affymetrix kits according to the manufacturer's instruction was hybridized to the chips for 16–18 h at 45 °C. Chips were washed, stained, and scanned using the Affymetrix 3000 scanner. Data were normalized using a MAS5 algorithm and analyzed using Partek software. These data are deposited as Geo dataset GSE52721.
Metabolic Studies
Mice were reared three/four per cage on a 12-h light-dark cycle (lights on from 0600 to 1800) and fed water and NIH-07 diet (11% kcal fat, Zeigler Brothers, Inc., Gardners, PA) ad libitum. Mice were transferred to a D12492 HFD (60% kcal fat, Research Diets Inc., New Brunswick, NJ) at 17 weeks and were maintained on this diet for 10 weeks. Body weight and body composition were measured every other week. Energy expenditure, RER, food intake, and activity were measured by indirect calorimetry at 22 °C using a 12-chamber CLAMS system (Columbus Instruments, Columbus, OH) as described previously (66). Mice were acclimated for 2 days in the metabolic chamber before measurements were taken. After the 2-day acclimation, data were collected for 24 h. Day (light cycle) was from 0600 to 1800 h and night (dark cycle) was from 1800 to 0600 h.
Biochemical Assays to Determine Body Composition Analysis
Body composition was measured in nonanesthetized mice using the Echo3-in-1 NMR analyzer (Echo Medical Systems, Houston, TX). Blood was obtained from the tail veins of animals in the nonfasted state. Blood glucose levels were measured using Glucometer Contour (Bayer, Elkhart, IN). Serum or plasma insulin, leptin, and adiponectin were assayed using radioimmunoassay (Millipore/Linco Research, St. Charles, MO). Serum triglycerides and cholesterol and free fatty acid levels were measured according to the manufacturer's procedures (Thermo DMA, Louisville, CO, and Roche Applied Science).
Glucose and Insulin Tolerance Tests
Mice fasted overnight were used in the glucose tolerance assay. Glucose was injected intraperitoneally at 2 g/kg body weight in mice fed normal chow or 1 g/kg body weight in mice fed a HFD. Blood glucose levels were measured at 0, 15, 30, 60, and 120 min after injection. Additionally, 20 μl of blood samples were collected from these mice at 0, 15, and 120 min to evaluate plasma insulin concentration. For insulin tolerance tests, nonfasted mice were injected intraperitoneally with human insulin (Humulin R; Lilly) at 0.75 IU/kg body weight. Blood glucose levels were measured at 0, 15, 30, 45, 60, 90, and 120 min after injection.
Liver Glycogen Analysis
Liver glycogen was detected in liver sections embedded into paraffin by American Histolabs (Gaithersburg, MD). Kidney histology was examined after periodic acid-Schiff (PAS) staining.
O-GlcNAcase Activity Assay
WT, HET, and KO MEFs were lysed in T-PER (Pierce) with cOmplete EDTA-free protease inhibitor mixture (Roche Applied Science) added fresh by rocking gently at 4 °C for 10 min and clarifying by centrifugation. 30 μg of clarified lysate was added to a mixture of 200 μm fluorescein di(N-acetyl-β-d-glucosaminide) (FDGlcNAc) and 50 mm N-acetylgalactosamine (GalNAc), in 50 mm citrate/phosphate buffer, pH 6.5. To control for any background fluorescence of the FDGlcNAc substrate itself, T-PER was added to a mixture of FDGlcNAc and GalNAc in the citrate/phosphate buffer (“no lysate”). All reactions were incubated in the dark at 37 °C and shaken at 100 rpm for 30 min. The reactions were quenched by adding Na2CO3 to a final concentration of 400 mm. Fluorescence was measured in 1-s intervals at the excitation wavelength of 485 nm and at the emission wavelength of 535 nm on a Wallac 1420 fluorometer (PerkinElmer Life Sciences). All assays were performed in triplicate. For data analysis, the signal detected in the no lysate reactions was averaged, and this value was subtracted from each of the lysate measurements. Data are presented as the mean ± S.E.
Statistical Analysis
The experiments represented in Figs. 9–11 were performed using groups of 12 or more mice. One-way ANOVA tests were performed to determine significance and the mean ± S.E. Data are considered significant at p ≤ 0.05 level as denoted by a single asterisk and p ≤ 0.01 by a double asterisk.
FIGURE 9.

Growth curves (A and B), fat (C and D), and lean mass composition (E and F) were determined in males (left) and in females (right) from 8 to 26 weeks of age. Fat and lean mass were measured using an Echo MRI Bioanalyzer. Data are shown as mean ± S.E. using WT (females n = 12 males; n = 15) and HET (females n = 29 males n = 18). One-way ANOVA tests were used to determine statistical significance as follows: *, p < 0.05; **, p < 0.01. The gray boxes indicate the start of the 8-week HFD feeding period.
FIGURE 10.

Glucose tolerance test (A and B) and insulin levels (C and D) of WT and HET mice fed a normal diet at 8 weeks of age (WT (males n = 15; females n = 12) and HET mice (males n = 18; females n = 29)). Data are presented as mean ± S.E., and statistical significance was calculated by one-way ANOVA test and is denoted by the asterisk (p < 0.05). Glucose tolerance tests were performed as described under “Materials and Methods.”
FIGURE 11.

Glucose tolerance test (A and B) and insulin levels (C and D) of WT and HET mice that had been fed a HFD for the previous 4 weeks at 24 weeks of age (WT (males n = 15; females n = 12) and HET mice (males n = 18; females n = 29)). Data are presented as mean ± S.E., and statistical significance was calculated by one-way ANOVA test and is denoted by asterisks (p < 0.05). For glucose tolerance tests, animals were injected with 1 mg/g of body weight, and blood glucose was measured at the indicated time intervals.
RESULTS
Oga KO Mice Exhibit a Highly Penetrant Perinatal Lethal Phenotype
Oga exon 1 and its promoter were chosen for conditional deletion using a Cre-loxP strategy (Fig. 1, B and C). Initial breeding attempts to propagate chimeric mice bearing a homozygous Oga floxed allele were unsuccessful due to the retention of the neo cassette, as reported previously for other knock-out mouse studies (50, 51). To circumvent this problem, the null Oga allele was generated by crossing male chimeric mice bearing an Oga floxed allele with female mice expressing Cre in the oocyte (Fig. 1C). Genotypes were confirmed by PCR (Fig. 1D). We noted that mating of the HET animals produced only 3% KO pups at weaning. Genotypes obtained at embryonic stages and at birth confirmed that although KO embryos were present at the expected Mendelian inheritance ratio, they died soon after birth with relatively few surviving to 3 weeks (Fig. 2A). Although the KO pups had significantly lower weight at birth (Fig. 2B), we did not find any obvious developmental defects or gross structural defects associated with the KO allele by histopathological analysis of whole mount embryonic sections at day E18.5 (Fig. 2C). Furthermore, no structural defects were detected at any stage of development examined (E13.5, E16.5, or E18.5) or in either HET or KO mutant animals. Other than the documented lower body weight, the KO pups were difficult to distinguish from WT or HET littermates (Fig. 2D).
FIGURE 2.

Deletion of Oga is perinatal lethal. A, survival of Oga KO animals compared with their HET and WT littermates at indicated time points. Numbers of each genotype are indicated on the graph. B, weight distribution (in grams) of pups of each genotype at birth (WT n = 31, HET n = 52, and KO n = 16). P0 Oga KO animals are significantly smaller than their WT or HET littermates. C, histological examination of hematoxylin and eosin-stained sagittal sections from WT and KO embryos at E18.5 did not reveal any gross developmental defects. D, live pups at P0 (birth). Genotypes are shown below each pup. Note that the Oga KO pup shows normal color and no sign of respiratory distress compared with its WT and KO littermates.
Conditional Oga Deletion Leads to Loss of Oga mRNA, Protein, and Activity
The floxed Oga locus was expected to produce a null allele lacking all known Oga isoforms due to the fact that both the first coding exon and promoter elements were targeted for deletion (Fig. 1A). To confirm this, RNA isolated from livers of animals harboring the WT, HET, and KO deletions was analyzed by PCR (Fig. 3A). The two major Oga transcripts were absent in KO animals, and only intermediate levels were present in HET animals. Anti-OGA antibody was used to probe immunoblots of adult liver tissue, and this analysis confirmed the absence of OGA in KO tissues and its reduction in HET tissues (Fig. 3B). As a result of the Oga deletion, the global levels of protein O-GlcNAcylation were substantially increased in KO tissues (adult liver and neonatal kidney) as evidenced by Western blots probed with anti-O-GlcNAc antibody (Fig. 3C). We also examined OGT levels using Western blot analysis in WT, HET, and KO tissues. Interestingly, in both adult liver and neonate kidney tissues in HET and KO animals, OGT levels were observed to increase relative to that observed in WT animals (Fig. 3D).
FIGURE 3.

OGA and OGT expression in transgenic tissues. A, mRNA levels of the long and short isoforms of Oga in adult liver tissues from all genotypes. No mRNA transcript is produced in Oga null mice. Ribosomal 18 S rRNA (lower panel) was used as a control. B, Western blots probed with anti-OGA antibody demonstrate the loss of an immunoreactive band at 130 kDa, the expected size of the OGA protein, in KO tissue. This band is observed at intermediate levels in HET tissues. C, Oga deletion exhibited greatly increased O-GlcNAcylated protein levels as detected by anti-O-GlcNAc antibody (CTD110.6 antibody, green channel) in adult liver tissues (left) and newborn kidney (right, RL2 antibody green channel). HET tissues exhibit a slight increase in O-GlcNAcylation as compared with WT. Actin bands (red channel) show similar amounts of protein for all three genotypes. D, Western blot analysis of tissue derived from both adult liver and neonate kidney of HET and KO mice shows increased OGT levels as compared with that observed in tissue from WT mice. Standards on the left apply to both blots because they were derived from a single Western blot.
Oga KO Perinatal Lethality Was Associated with Hypoglycemia
Although a few of the KO pups had milk spots, demonstrating their ability to feed, very few animals survived past 24–48 h after birth (Fig. 2, A and D). Notably, perinatal death of mutant mice has been linked to impaired physiological processes, including glucose homeostasis (52). To determine whether glucose homeostasis was impaired in Oga KO pups, we measured blood glucose levels of newborns at birth and after an 8-h fast. Interestingly, we found a higher incidence of hypoglycemia in KO neonates that was significantly different from their WT and HET littermates (Fig. 4A). Although WT and HET mice were able to maintain normal levels of circulating glucose during this time, the circulating glucose concentration in KO animals dropped to near undetectable levels (Fig. 4A). The impaired glucose homeostasis under fasting conditions in KO pups suggested either an inability to mobilize glycogen or depleted glycogen stores. To test this hypothesis, neonatal liver sections from WT and KO mice were stained by PAS to identify liver glycogen accumulation (Fig. 4B). Quantitation of PAS staining demonstrated a dramatic reduction in hepatic glycogen deposition in KO animals compared with WT animals (Fig. 4C). This reduction in liver glycogen pools in KO newborns suggests that the hypoglycemia may be linked to neonatal glucose homeostasis. Taken together, these findings suggest that KO animals are compromised in their ability to maintain insulin-glucose homeostasis, resulting in hypoglycemia and perinatal lethality.
FIGURE 4.

Glucose homeostasis is impaired in Oga KO animals. A, glucose levels from whole blood was measured for each genotype at birth (0 h) and after an 8-h fast. Data are presented as the mean ± S.E. The glucometer used had a detection limit of 10 mg/dl (dashed line). B, histological analysis of liver sections from P0 Oga WT and KO littermates. Sections were stained with hematoxylin/eosin, and glycogen content (noted with white arrows) was determined by PAS staining. C, graphed are the results of the imaging analysis. Glycogen content of KO livers was found to be significantly reduced compared with WT (p < 0.05). Bars represent the mean ± S.E. A total of four fields were measured for each liver (for each WT and KO n = 5).
Total O-GlcNAcylation of Proteins Increased in Oga KO MEF Cells
Employing a more defined in situ system, we prepared MEFs from gender-matched WT, HET, and KO siblings (12.5 days postcoitus). Each cell line was tested for Oga mRNA expression, OGA protein levels, and OGA enzymatic activity. As expected, transcripts encoding the two major Oga isoforms were absent in KO MEFs, although an intermediate level of expression was detected in HET MEFs (Fig. 5A). The loss of Oga transcript correlated with a proportional reduction in enzymatic activity as measured using the fluorescent OGA substrate FDGlcNAc (Fig. 5B) (53). Similarly, the total amount of protein O-GlcNAcylation in these cells was inversely correlated with the level of OGA as detected by anti-O-GlcNAc antibody (Fig. 5, C and D). Taken together, these findings suggest that the conditional Oga allele described herein is in fact a null allele that exhibits haploinsufficiency when paired with a WT allele (i.e. in HET animals).
FIGURE 5.

Effects of Oga deletion in MEFs. A, semi-quantitative RT-PCRs followed by gel electrophoresis show transcripts levels of long and short Oga isoforms were reduced in HET and absent in KO cells relative to WT. 18 S rRNA gene expression was used as a control. B, O-GlcNAcase activity was measured using the fluorogenic OGA substrate FDGlcNAc in MEF cells. HET cells exhibited intermediate OGA activity using this assay, and very little activity was observed in KO cells. Data are the mean ± S.E. C, representative Western blot showing increased O-GlcNAcylation in Oga KO MEF cells. Blots are probed with CTD110.6 antibody (green channel) and actin (red channel). The immunoblot is representative of what was observed in three independent experiments. D, graph of the quantification of the representative blot in C done over 5 logs on images taken on an Odyssey Infrared Imaging System (LI-COR Biosciences) shows notable increases in O-GlcNAc band intensity in KO cells (normalized to actin levels). Error bars represent ± S.E.
Insulin-response Signaling through GSK3β Is Dramatically Altered in Oga KO Animals
Because we found that Oga deletion had a profound effect on glycogen mobilization in KO neonatal mice, we elected to examine which signaling pathways may be involved. Previous studies from our laboratory (54) and others (55) have linked O-GlcNAc cycling to insulin resistance. To examine the insulin response associated with Oga deletion, we evaluated MEF cells under basal and insulin-stimulated conditions. We examined a panel of key regulatory proteins in insulin signaling using Western blot analysis, including IRS1, AKT, PDK1, and AMPKα. One key protein that consistently emerged from this extensive analysis was GSK3β, which showed both increased expression and phosphorylation in the KO MEFs. Increased phosphorylation at Ser-9 in GSK3β was detected in MEF cells under basal conditions (Fig. 6A, left). In the presence of insulin, GSK3β phosphorylation increased in WT animals but remained the same in HET MEFs and decreased in KO MEFs (Fig. 6, A and B). To verify these findings in vivo, we examined total GSK3β expression levels in adult and neonatal livers. For both adult and neonatal liver, greatly enhanced levels of GSK3β were detected in KO animals with an intermediate increase in GSK3β HET liver tissues (Fig. 6, C and D). Previous studies have shown that overexpression of GSK3β leads to inhibition of both basal and insulin-stimulated glycogen synthase activity (56–58). Our findings suggest that the perinatal lethality and paucity of glycogen stored in neonatal livers observed in the KO animals may be linked to elevated GSK3β levels. Given the pleiotropic role of GSK3β in modulating Wnt signaling, glycogen metabolism, innate immunity, and insulin signaling (59), we then used whole genome transcriptional profiling to determine whether other pathways may have become deregulated.
FIGURE 6.

A, Western blots from MEF cells probed with GSK3β Ser(P)-9 (Ser9-P) or total GSK3β (green) and actin (red) antibodies show basal and insulin-mediated GSK3β Ser-9 phosphorylation increased in Oga KO MEF cells compared with WT cells (WT MEFs were from a female and both HET and KO MEFs from a male). B, graph showing both increased basal GSK3β phosphorylation in KO MEFs compared with WT MEFs and the notable insulin (Ins)-dependent reduction in phosphorylation levels observed specifically in KO MEFs. Densitometry data from two independent experiments are represented. Each of the GSK3β species was normalized first to actin alone, and then the ratio of GSK3β Ser(P)-9 to total GSK3β was determined. The WT ratio under basal conditions was set at 100%, and the other ratios are plotted as a percentage of this to evaluate both the GSK3β phosphorylation levels in the mutant lines and to determine phosphorylation changes upon insulin stimulation. Values are means ± S.E. C and D, Western blots showing total GSK3β expression in adults (all females) and newborn livers (WT and KO were each from a male and HET was from a female) corroborated MEF data. GSK3β expression increased in HET and KO mice tissues compared with WT.
Oga KO and HET MEFs Exhibit Changes in Metabolic Pathway Genes
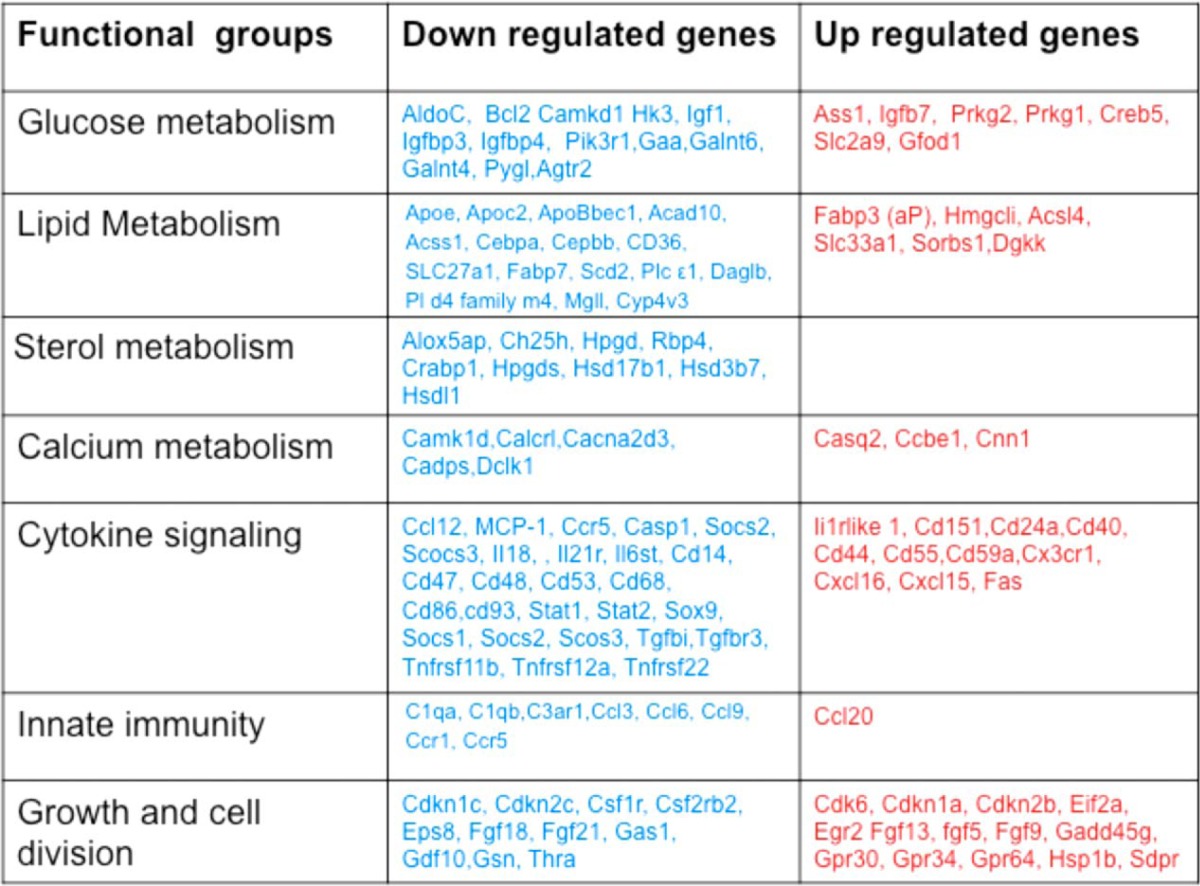
RNA obtained from female Oga MEF cells derived from animals of all three genotypes was analyzed by microarray to identify global gene expression patterns associated with Oga deletion. Principal component analysis revealed distinctly separate gene expression in WT, HET, and KO groups (Fig. 7A). Differentially expressed genes were calculated by ANOVA (p < 0.05) using Partek software. Genes that changed by at least 2-fold, up or down, were identified using a 0.01 false discovery ratio. Although KO MEFs had 838 transcripts that changed 2-fold or over compared with WT, comprising 619 unique transcripts with 36 unmapped transcripts, 111 transcripts were differentially expressed in the HET group with 82 unique transcripts and 22 unmapped transcripts. Hierarchical clustering of the 838 transcripts (KO compared with WT) cluster into two distinct groups, although gene expression in HET was more similar to WT with few clusters shared with the KO group (Fig. 7B). Distribution of the differentially expressed genes in each comparison group is summarized in the Venn diagram in Fig. 7C. The 10 common transcripts present in all comparisons were Oga, Scd2, Lumican, Gdf10, Rho GTPase-activating protein 20 (Arhgap20), pleckstrin, Cd36, interferon-induced protein (Ifit1), Scavenger receptor class a member 5 (Scara5), and Npl. These microarray results confirmed the Oga deletion and showed that KO cells had a 4–19-fold reduction in Oga transcript levels as measured by five distinct sequence tags. Gene enrichment analysis was performed using the Gene Ontology database to examine the global transcriptional impact of the Oga loss of function. The 838 transcripts that differed in the KO versus WT animals showed the highest enrichment in genes associated with metabolism (Fig. 7D). Specifically, genes associated with glucose metabolism, lipid metabolism, sterol synthesis, cytokine signaling, innate immunity, and growth were most dramatically altered (Table 1). Although most of the genes known to be in these pathways were transcriptionally down-regulated, approximately one-third were determined to be up-regulated. Notably, using the Genomatix bioinformatics analysis tools, we found that the genes deregulated in HET MEFs have been associated with the development of sarcoma, obesity, neoplasms, and hypothyroidism. In particular, a module of genes linked to glucocorticoid-dependent regulation (Ncr3c1) of fat metabolism and obesity was over-represented in the genes differentially regulated in HET MEFs. This module regulates the hypothalamic pituitary adrenal axis.
FIGURE 7.

A, microarray data quality assessment using principal component analysis (PCA) shows replicate samples clustering in each genotype. B, hierarchical clustering of 838 genes that were found to be differentially expressed by 2-fold in WT versus KO MEFs. Each row represents a single sample in triplicate per genotype, and each column is a gene. C, overlap of statistically significant genes from each comparison are shown in the Venn diagram. The diagram shows the distribution of genes that are differentially expressed by 2-fold in all three groups (p < 0.05% and false discovery ratio of 0.01). D, Gene Ontology enrichment analysis of differentially expressed genes from the KO versus WT shows the high enrichment levels in genes associated with growth and metabolism.
TABLE 1.
The genes that are observed to be differentially expressed, up or down, in microarray analysis studies were associated with metabolism and immunity
Selected transcripts from each group that were found to change more than 1.5-fold in Oga KO MEFs versus WT and their associated functional group are shown here.
Oga HET Animals Exhibit an Elevated Respiratory Exchange Ratio
To examine whether OGA deficiency causes changes in metabolism, we analyzed 13-week-old WT and HET female mice using the Comprehensive Lab Animal Monitoring System (CLAMS). These WT and HET mice exhibited similar body weight, food intake, energy expenditure, and physical activity (Table 2). To further characterize changes in metabolism, RER profiles in WT and HET mice were generated by taking measurements of O2 consumption and CO2 production (VCO2/VO2 ratios) in both light and dark cycles (to take into account any change in the activity of the animals due to the circadian clock). Measurement of RER in several light/dark cycles was performed after acclimatization as shown in Fig. 8A. Complete profiling was performed on these animals in three separate experiments as outlined under “Materials and Methods.” The HET animals showed consistently higher RER values in both light and dark. Total RER measured over 24 h (Fig. 8B) showed a statistically significant increase from about 0.89 to 0.94. This increase was observed both in male and female HETs in three separate experiments after proper acclimatization to the metabolic chamber. An RER of 0.70 is indicative of oxidation of lipids as the predominant fuel source, whereas a value of 1.00 or above indicates that carbohydrates are being used as the main fuel source. Thus, the significantly increased RER observed in Oga HET animals suggests the preferential utilization of carbohydrates as opposed to lipids as the main source of fuel. This shift in RER to higher values suggests a global change in metabolism in the HET animals compared with their WT littermates.
TABLE 2.
Metabolic parameters observed in 13-week-old WT and HET female mice maintained on a normal chow diet
Data were collected at 22 °C for 24 h after 2 days of adaptation to metabolic changers and are expressed at the mean ± S.E.
| Parameter measured | WT (n = 4) | HET (n = 5) |
|---|---|---|
| Body weight (g) | 24.3 ± 0.8 | 22.2 ± 2.9 |
| TEE (kcal/mouse/day) | 11.1 ± 0.3 | 9.8 ± 0.7 |
| Food intake (kCa/mouse/h) | 11.8 ± 0.6 | 12.8 ± 1.4 |
| RER (VCO2/VO2) | 0.89 ± 0.01 | 0.96 ± 0.02a |
| Total activity (beam brakes/min) | 527 ± 55 | 352 ± 60 |
a p < 0.05.
FIGURE 8.
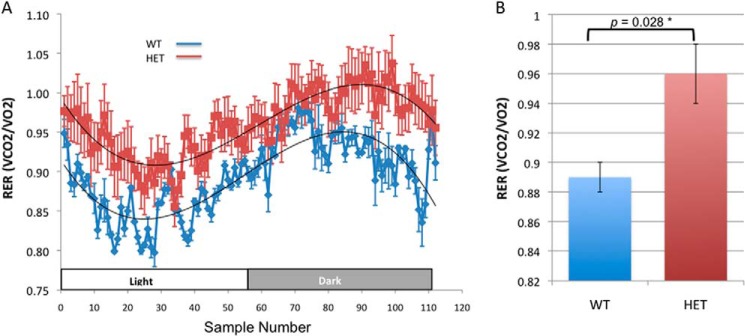
Increases in RER values suggest a global change in metabolism in the HET animals compared with their WT littermates. A, measurement of the VCO2/VO2 ratio in several light/dark cycles was performed after acclimatization (WT n = 4 and HET n = 5 animals). Data are represented as curve fit to the mean. B, HET animals showed consistently higher RER values in both light and dark cycles that reached statistical significance. Increases in total RER measured over 24 h were observed both in male and female HET mice.
Increased Body Weight Is Observed in Oga HET Females Fed a HFD
Growth and metabolic parameters were compared using age- and sex-matched mice from all genotypes. Metabolic parameters were measured at 8 weeks of age with mice on a regular diet, and at the 18th week all mice were switched to a HFD and evaluated up to the 26th week. HET male mice showed no changes in overall body weight, fat accumulation, or lean mass under normal or high fat diets (Fig. 9, A, C, and E, left panels). In contrast, HET females showed significantly increased weight gain compared with WT littermates (Fig. 9B, right panel). This weight gain was due both to significant elevated body fat accumulation (Fig. 9D, right panel) and lean mass accumulation in HET female mice relative to WT (Fig. 9F, right panel).
Serum Composition Changed in Oga HETs after HFD Feeding
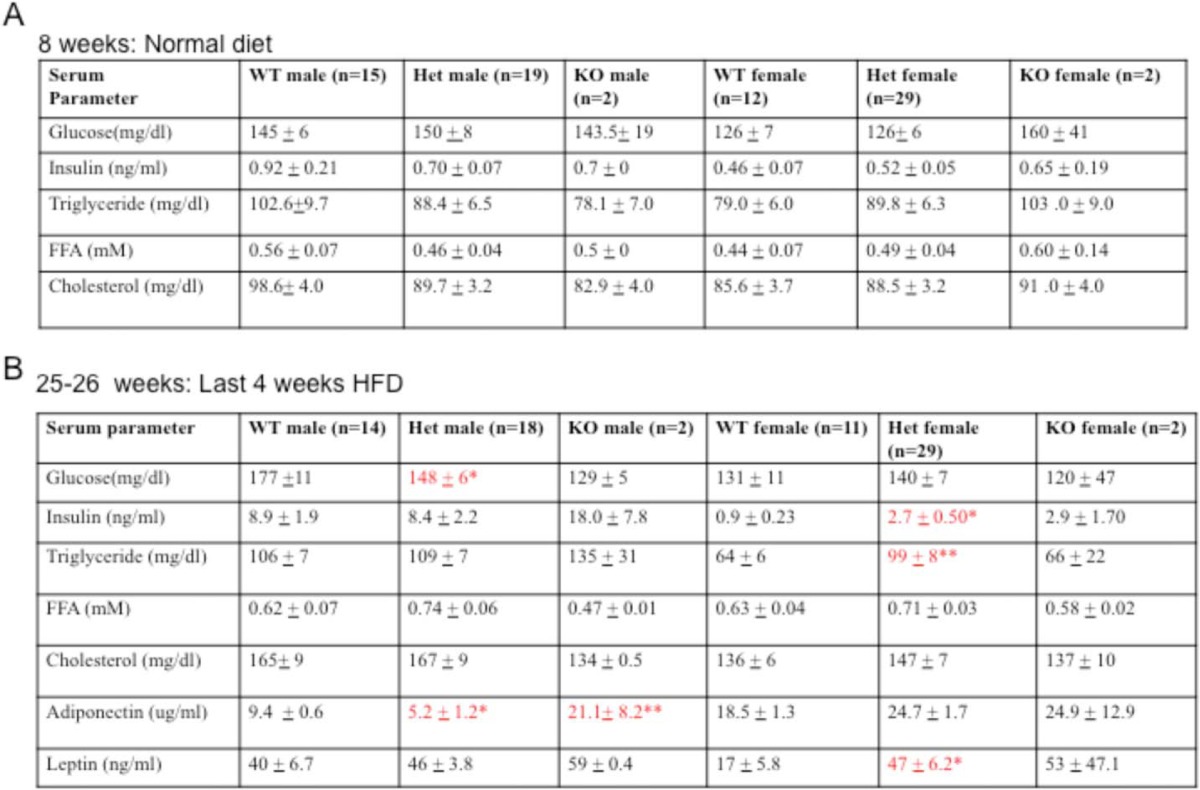
There were no significant effects on serum parameters (i.e. glucose, insulin, triglyceride, or free fatty acid) in male or female mice under the normal chow diet (Table 3, part A). However, after 4 weeks of HFD feeding, HET and KO mice had detectable changes in key serum parameters. HET males showed significantly reduced blood glucose and circulating adiponectin levels compared with WT males (Table 3, part B). Interestingly, KO males also had lower blood glucose and significantly increased adiponectin levels together with elevated triglyceride, insulin, and serum leptin levels. HET females, however, demonstrated significantly increased circulating triglyceride, insulin, and leptin levels (Table 3, part B). In fact, both HET and KO females doubled their circulating insulin levels after being switched to the high fat diet but maintained blood glucose levels comparable with that of their WT littermates, suggesting the development of insulin resistance specifically in females. Markedly, increased serum leptin levels were observed, consistent with the extensive body fat accumulation in HET and KO females. In addition, elevated adiponectin levels were recorded for both HET and KO females, although HET males had significantly lower adiponectin levels than WT. Thus, the adiponectin, triglyceride, and insulin levels in HET mice exhibit a gender-biased difference consistent with increased adiposity in female HET animals.
TABLE 3.
Serum parameters measured in 8-week-old mice fed a normal diet (part A) and at 25–26 weeks of age after 4 weeks on a HFD (part B)
Female Oga HET mice (n = 29) had significantly higher insulin, triglycerides, and leptin levels compared with their WT (n = 12) littermates. Oga HET males (n = 18) had significantly reduced adiponectin levels compared with WT males (n = 14). In KO mice, both males and females (n = 2) show increased insulin and leptin levels. Data are presented as the mean ± S.E.; asterisks indicate significant differences relative to WT animals. A single asterisk represents p < 0.05 and a double asterisk represents p < 0.01, as determined by one-way ANOVA test. These are highlighted in red text.
Female HETs Achieve Glucose Tolerance by Increasing Insulin Secretion
No difference in glucose tolerance was observed in either male or female WT or HET mice when fed a normal diet (Fig. 10, A–D). Upon HFD feeding, HET males had improved glucose tolerance compared with WT males (Fig. 11A) with a notable increase in circulating insulin levels for both groups after being fed the HFD (Fig. 11C). In contrast, HET females had reduced glucose clearance with significantly elevated serum insulin (Fig. 11, B and D). HET female mice exhibited diminished glucose clearance capacity under HFD conditions compared with a normal diet, despite having elevated insulin levels. Gender difference is again apparent in insulin secretion and glucose control in HET animals as compared with their respective WT littermates, possibly correlated with adiposity. However, no differences in insulin tolerance were observed in HET male or female mice under normal or HFD conditions as compared with their WT littermates.
DISCUSSION
A previous study (48) examined Oga loss of function by gene-trap technology, and perinatal death of Oga KO pups within 24 h and genomic instability were reported. A follow-up study using these animals showed that Oga heterozygosity suppressed intestinal tumorigenesis in an established cancer model (49). Our studies using a conditional allele of Oga greatly extend these previous findings. Early expression of Cre recombinase in the murine zygote yielded HET and KO loss of function alleles of Oga. The resultant knock-out mice exhibit increased O-GlcNAcylation in both isolated MEF cells and tissues. Using a direct biochemical measurement of OGA activity in MEF cells, we noted a dramatic reduction in OGA activity in KO MEFs and a modest decrease in OGA activity in HET MEFs as compared with WT MEF levels. Unlike Ogt knock-out mice, which exhibit early embryonic lethality, the majority of Oga KO animals die within the perinatal period. About 89% of Oga KO pups were dead within 24–48 h after birth, suggesting a critical role of OGA function in the transition from birth to postpartum life. Hypoglycemia due to lowered glycogen storage has been previously linked to perinatal lethality (52), prompting us to examine postnatal glucose mobilization in these animals. We show here that the KO neonates have greatly reduced blood glucose that drops below the limit of detection after an 8-h starvation period. We also show that the neonatal liver in KO animals has greatly diminished glycogen stores. Thus, the perinatal lethality observed is likely due to defects in insulin-regulated glycogen accumulation and mobilization. Consistent with this, we observed dramatic increases in GSK3β Ser-9 phosphorylation in KO animals, consistent with a blunting of glycogen synthetase activity and the observed decreases in glycogen stores.
To examine other signaling pathways that may be altered, the MEFs derived from HET and KO lines were analyzed using whole genome microarray analysis. These data show dramatically altered expression of genes linked to cell metabolism and proliferation. Mice with a single functional Oga allele show alterations in pathways linked to increased fat mass and adipokine release, altered glucose tolerance, and increased insulin resistance. These HET animals also show significant elevation in total RER evident in both light and dark cycles of activity and respiratory monitoring. Metabolic phenotyping of this HET strain revealed a sexually dimorphic increase in fat mass upon exposure to a high fat diet. These metabolic phenotypes are more exaggerated in KO animals. We have significantly extended these finding by examining altered gene expression and metabolic signaling. Metabolic phenotyping of surviving KO mice revealed changes in insulin-glucose homeostasis and liver glycogen storage that may account for this perinatal lethal phenotype.
Oga Loss of Function Results in Deregulation of Genes Linked to Cell Proliferation and Metabolism
Whole genome analysis of expression revealed significant effects of the Oga deletion, lending notable insight into the roles of O-GlcNAc-dependent signaling. Gene ontogeny and pathway analysis revealed enrichment of differentially expressed genes linked to cell growth and metabolism. In HET animals, the deregulated transcription profiles were suggestive of metabolic disease, and alterations in genes associated with obesity were noted. Of particular note was deregulation of the gene Nr3c1 known to play a role in intrauterine programming of the hypothalamic pituitary adrenal axis. Nadler et al. (60) reported that obese mice show reduced expression of several adipogenic genes and some of these (e.g. scd2, pcx, and Rbp4) were reduced in KO cell lines. In these KO animals, deregulated transcripts were enriched in genes associated with immunity and signaling. Inflammatory cytokine genes were also altered significantly in KO animals, suggesting possible changes in their immune function. Macrophage function has been recently identified as a prerequisite of early signals to adipose proliferation (61).
Perinatal Lethality and Metabolic Deregulation in Oga KO and HET Animals
Perinatal lethality can occur due to the malfunction of vital organs or the poor homeostasis of critical physiological functions. The 24–48-h post-partum window is a crucial time during which pups acclimate metabolically and physiologically following the removal of placental nutrition and oxygen supply. The KO pups in this study often died during this 24–48-h window without any growth or respiratory defect. O-GlcNAc cycling is known to modulate gene expression by associating with the transcriptome complex. In KO MEFs, the deregulation of O-GlcNAc cycling significantly reduced the expression of several genes, including Scd2 (which was reduced by 10.96-fold) and Cebpa (which was reduced by 1.5-fold) The knock-out of either of these genes in mice results in neonatal lethality due to deficiencies in glucose homeostasis (52). We observe that the KO neonates are hypoglycemic compared with their WT or HET littermates and also have greatly reduced levels of liver glycogen. These findings suggest that the absence of O-GlcNAc cycling due to Oga loss of function may render the KO animals particularly susceptible to deficiencies in metabolic recovery after birth.
Altered Signaling Leads to Disruption in Insulin-Glucose Homeostasis
A number of molecular mechanisms have been proposed to explain why increased O-GlcNAc modification could exert negative effects on insulin signaling. These include phosphatidylinositol 3-kinase inhibition (62), altered insulin secretion (63), and the reduction of AKT activity (64). The results of this study suggest that GSK3β may play a key role in lipid and glucose metabolism. Under basal conditions, GSK3β inhibits glycogen synthesis. Upon insulin stimulation, GSK3β is inhibited via phosphorylation at Ser-9. Notably, downstream of GSK3β is a cascade of metabolically relevant signaling pathways; these include pathways involved in insulin-mediated synthesis of both glycogen and fatty acids. The physiological effects of the elevated phosphorylation of GSK3β observed in the KO MEFs under basal conditions could mimic a condition of chronic insulin stimulation. Furthermore, the increased adiposity observed in KO mice could be a consequence of the deregulation of insulin-dependent macronutrient storage. Wang et al. (65) reported a complex downstream signaling effect upon O-GlcNAc-associated GSK3β inhibition in a cell-based model. HET female mice also demonstrated increased adiposity that gradually resulted in insulin resistance upon HFD feeding. It also appears that in response to increased adiposity, circulating leptin levels increased in these HET females. These findings are consistent with our previous report suggesting that OGT overexpression in muscle and fat under the GLUT4 promoter induced hyperleptinemia and insulin resistance in a sexually dimorphic fashion (54). Elevation of UDP-GlcNAc by glutamine fructose-6-phosphate amidotransferase overexpression induced a similar phenotype in mice (67–70) These findings and other studies suggest that adipokine changes associated with elevated O-GlcNAcylation in adipose tissues could be enough to trigger insulin resistance in other organs (71, 72).
Loss of Oga activity may also have direct effects on lipid storage in adipocytes. We have recently shown that Oga is an essential regulator of lipid droplet maintenance in adipocytes (17). By locally regulating the proteasome activity, the short isoform of OGA allows remodeling of the lipid droplet surface. Loss of Oga activity would be expected to interfere with lipid-droplet surface remodeling and may contribute to the observed obesity phenotype seen in KO animals.
Indirect Calorimetry Suggests Increased Carbohydrate Utilization of Carbohydrate Versus Lipid as Fuel
Our RER analysis suggests the Oga HET animals preferentially utilize carbohydrates rather than lipids as fuel. The biochemical basis for this finding remains unclear. The observed changes in insulin-triggered glycogen metabolism we have documented in these HET animals are consistent with this observation. RER is a sensitive measure of metabolic rate and has been reported to be altered as the result of a number of loss of function mutations in the mouse (73–75). An increased basal metabolic rate and RER were observed in fat-specific insulin receptor knock-out mice (76). In an Akt1 knock-out model, mice exhibited elevated energy expenditure without an obvious increase in RER (75). Also, an adipose triacylglycerol lipase deletion was found to lead to an increase in the RER (74). In our Oga HET animals, the elevated RER is consistent with a global deregulation in both lipid and carbohydrate metabolism.
Sexual Dimorphism and Oga Loss of Function
Unlike Oga HET females, HET males did not develop obesity and were protected from diet-induced obesity. In this study, HET females had higher adiponectin levels compared with males. This supports the hypothesis that females tend to expand adipose tissue mass to alleviate insulin resistance. Adiponectin is known to promote insulin sensitivity through increased lipolysis (77) and altered signaling to store triglyceride in adipocytes to reduce triglyceride levels in liver and muscle (78). Interestingly, transgenic mice overexpressing glutamine fructose-6-phosphate amidotransferase in adipose tissue also exhibited gender-related differences in metabolic response. Specifically, females had lower glucose disposal rate, lower 2-deoxy-d-glucose uptake, and higher adiponectin levels than males (22).
Metabolic Homeostasis in a Genetically Controlled Developmental Model
There has been considerable controversy surrounding the role of O-GlcNAc cycling in the regulation of insulin-glucose homeostasis and metabolism. Genetic studies in C. elegans using null alleles of ogt-1 and oga-1 provided clear genetic evidence for a role of O-GlcNAc cycling in insulin signaling and insulin resistance (26, 33, 34, 38, 39, 79). Similar findings were obtained in Drosophila (43). In mammals, overexpression of OGT in muscle and fat was found to induce both insulin resistance and hyperleptinemia (54). Studies carried out in L1–3T3 cells showed that inhibition of OGA could render cells insulin-resistant (55). In addition, the insulin resistance of glycogen synthase was found to be mediated by the O-GlcNAc modification (80). Recently, studies in which adult mice or L1–3T3 cells were treated with cell-permeable OGA-selective inhibitors showed that this treatment did not induce insulin resistance (47, 81, 82). The work presented here suggests that in a developmental context, loss of OGA leads to many of the hallmarks of metabolic disease and a deregulation of glucose homeostasis in the intrauterine environment. This is quite distinct from acute inhibition of the enzyme in adult animals. Taken together, our findings suggest that OGA is required during development to maintain the essential aspects of metabolic homeostasis.
Summary
We have targeted the mouse Oga (MGEA5) locus for conditional disruption. The absence of the correlating mRNA, protein, and enzyme activity was observed in both MEFs and tissue from these animals. Whole genome gene expression analysis in MEFs showed notable deregulation of genes involved in immunity, cell proliferation, and metabolism. We observe constitutive activation of GSK3β and altered insulin responsiveness in both fetal and adult liver from Oga KO mice. Our metabolic results indicate increased adiposity associated with the development of insulin resistance in Oga HET females and KO mice in both genders. Increased dietary fat triggered adipose-mediated hyperleptinemia and hyperinsulinemia in Oga HET animals. Furthermore, Oga loss of function produces perinatal lethality associated with loss of glycogen accumulation in the fetal liver. Overall, the findings presented here suggest that although not essential, the OGA locus in the mouse is critical for the proper maintenance of insulin-glucose homeostasis, particularly in the intrauterine environment and the first few hours of life.
Acknowledgments
We are grateful to Dr. L. Hennighausen and Dr. G. Robinson at Laboratory of Genetics and Physiology, NIDDK, National Institutes of Health, for providing us with Cre transgenic mice. We acknowledge George Poy and Dr. Weiping Chen at NIDDK, National Institutes of Health, for microarray analysis and William Jou and Tatyana Chanturiya (NIDDK Mouse Metabolism Core Laboratory) for technical assistance with metabolic studies.
This work was supported, in whole or in part, by a National Institutes of Health Intramural Grant.
- OGT
- O-GlcNAc transferase
- OGA
- O-GlcNAcase
- HET
- heterozygous
- MEF
- mouse embryonic fibroblast
- HFD
- high fat diet
- RER
- respiratory exchange ratio
- HBP
- hexosamine biosynthetic pathway
- FDGlcNAc
- fluorescein di(N-acetyl-β-d-glucosaminide)
- BisTris
- 2-[bis(2-hydroxyethyl)amino]-2-(hydroxymethyl)propane-1,3-diol
- ANOVA
- analysis of variance
- PAS
- periodic acid-Schiff
- T-PER
- tissue protein extraction reagent.
REFERENCES
- 1. Butkinaree C., Park K., Hart G. W. (2010) O-Linked β-N-acetylglucosamine (O-GlcNAc): Extensive crosstalk with phosphorylation to regulate signaling and transcription in response to nutrients and stress. Biochim. Biophys. Acta 1800, 96–106 [DOI] [PMC free article] [PubMed] [Google Scholar]
- 2. Ma J., Hart G. W. (2014) O-GlcNAc profiling: from proteins to proteomes. Clin. Proteomics 11, 8. [DOI] [PMC free article] [PubMed] [Google Scholar]
- 3. Bond M. R., Hanover J. A. (2013) O-GlcNAc cycling: a link between metabolism and chronic disease. Annu. Rev. Nutr. 33, 205–229 [DOI] [PMC free article] [PubMed] [Google Scholar]
- 4. Harwood K. R., Hanover J. A. (2014) Nutrient-driven O-GlcNAc cycling–think globally but act locally. J. Cell Sci. 127, 1857–1867 [DOI] [PMC free article] [PubMed] [Google Scholar]
- 5. Lubas W. A., Frank D. W., Krause M., Hanover J. A. (1997) O-Linked GlcNAc transferase is a conserved nucleocytoplasmic protein containing tetratricopeptide repeats. J. Biol. Chem. 272, 9316–9324 [DOI] [PubMed] [Google Scholar]
- 6. Gao Y., Wells L., Comer F. I., Parker G. J., Hart G. W. (2001) Dynamic O-glycosylation of nuclear and cytosolic proteins: cloning and characterization of a neutral, cytosolic β-N-acetylglucosaminidase from human brain. J. Biol. Chem. 276, 9838–9845 [DOI] [PubMed] [Google Scholar]
- 7. Hanover J. A., Lai Z., Lee G., Lubas W. A., Sato S. M. (1999) Elevated O-linked N-acetylglucosamine metabolism in pancreatic β-cells. Arch. Biochem. Biophys. 362, 38–45 [DOI] [PubMed] [Google Scholar]
- 8. Hanover J. A. (2001) Glycan-dependent signaling: O-linked N-acetylglucosamine. FASEB J. 15, 1865–1876 [DOI] [PubMed] [Google Scholar]
- 9. Slawson C., Hart G. W. (2003) Dynamic interplay between O-GlcNAc and O-phosphate: the sweet side of protein regulation. Curr. Opin. Struct. Biol. 13, 631–636 [DOI] [PubMed] [Google Scholar]
- 10. Slawson C., Copeland R. J., Hart G. W. (2010) O-GlcNAc signaling: a metabolic link between diabetes and cancer? Trends Biochem. Sci. 35, 547–555 [DOI] [PMC free article] [PubMed] [Google Scholar]
- 11. Marshall S. (2006) Role of insulin, adipocyte hormones, and nutrient-sensing pathways in regulating fuel metabolism and energy homeostasis: a nutritional perspective of diabetes, obesity, and cancer. Sci. STKE 2006, re7. [DOI] [PubMed] [Google Scholar]
- 12. Love D. C., Hanover J. A. (2005) The hexosamine signaling pathway: deciphering the “O-GlcNAc code”. Sci. STKE 2005, re13. [DOI] [PubMed] [Google Scholar]
- 13. Heckel D., Comtesse N., Brass N., Blin N., Zang K. D., Meese E. (1998) Novel immunogenic antigen homologous to hyaluronidase in meningioma. Hum. Mol. Genet. 7, 1859–1872 [DOI] [PubMed] [Google Scholar]
- 14. Comtesse N., Maldener E., Meese E. (2001) Identification of a nuclear variant of MGEA5, a cytoplasmic hyaluronidase and a β-N-acetylglucosaminidase. Biochem. Biophys. Res. Commun. 283, 634–640 [DOI] [PubMed] [Google Scholar]
- 15. Zachara N. E., Hart G. W. (2004) O-GlcNAc a sensor of cellular state: the role of nucleocytoplasmic glycosylation in modulating cellular function in response to nutrition and stress. Biochim. Biophys. Acta 1673, 13–28 [DOI] [PubMed] [Google Scholar]
- 16. Schultz J., Pils B. (2002) Prediction of structure and functional residues for O-GlcNAcase, a divergent homologue of acetyltransferases. FEBS Lett. 529, 179–182 [DOI] [PubMed] [Google Scholar]
- 17. Keembiyehetty C. N., Krzeslak A., Love D. C., Hanover J. A. (2011) A lipid-droplet-targeted O-GlcNAcase isoform is a key regulator of the proteasome. J. Cell Sci. 124, 2851–2860 [DOI] [PMC free article] [PubMed] [Google Scholar]
- 18. Duggirala R., Blangero J., Almasy L., Dyer T. D., Williams K. L., Leach R. J., O'Connell P., Stern M. P. (1999) Linkage of type 2 diabetes mellitus and of age at onset to a genetic location on chromosome 10q in Mexican Americans. Am. J. Hum. Genet. 64, 1127–1140 [DOI] [PMC free article] [PubMed] [Google Scholar]
- 19. Farook V. S., Bogardus C., Prochazka M. (2002) Analysis of MGEA5 on 10q24.1-q24.3 encoding the β-O-linked N-acetylglucosaminidase as a candidate gene for type 2 diabetes mellitus in Pima Indians. Mol. Genet. Metab. 77, 189–193 [DOI] [PubMed] [Google Scholar]
- 20. Lehman D. M., Fu D. J., Freeman A. B., Hunt K. J., Leach R. J., Johnson-Pais T., Hamlington J., Dyer T. D., Arya R., Abboud H., Göring H. H., Duggirala R., Blangero J., Konrad R. J., Stern M. P. (2005) A single nucleotide polymorphism in MGEA5 encoding O-GlcNAc-selective N-acetyl-β-d-glucosaminidase is associated with type 2 diabetes in Mexican Americans. Diabetes 54, 1214–1221 [DOI] [PubMed] [Google Scholar]
- 21. Kudlow J. E. (2002) The O-GlcNAcase theory of diabetes: commentary on a candidate gene for diabetes. Mol. Genet. Metab. 77, 1–2 [DOI] [PubMed] [Google Scholar]
- 22. McClain D. A. (2002) Hexosamines as mediators of nutrient sensing and regulation in diabetes. J. Diabetes Complications 16, 72–80 [DOI] [PubMed] [Google Scholar]
- 23. Issad T., Kuo M. (2008) O-GlcNAc modification of transcription factors, glucose sensing and glucotoxicity. Trends Endocrinol. Metab. 19, 380–389 [DOI] [PubMed] [Google Scholar]
- 24. Hanover J. A., Krause M. W., Love D. C. (2010) The hexosamine signaling pathway: O-GlcNAc cycling in feast or famine. Biochim. Biophys. Acta 1800, 80–95 [DOI] [PMC free article] [PubMed] [Google Scholar]
- 25. Love D. C., Krause M. W., Hanover J. A. (2010) O-GlcNAc cycling: emerging roles in development and epigenetics. Semin. Cell Dev. Biol. 21, 646–654 [DOI] [PMC free article] [PubMed] [Google Scholar]
- 26. Love D. C., Ghosh S., Mondoux M. A., Fukushige T., Wang P., Wilson M. A., Iser W. B., Wolkow C. A., Krause M. W., Hanover J. A. (2010) Dynamic O-GlcNAc cycling at promoters of Caenorhabditis elegans genes regulating longevity, stress, and immunity. Proc. Natl. Acad. Sci. U.S.A. 107, 7413–7418 [DOI] [PMC free article] [PubMed] [Google Scholar]
- 27. Ranuncolo S. M., Ghosh S., Hanover J. A., Hart G. W., Lewis B. A. (2012) Evidence of the involvement of O-GlcNAc-modified human RNA polymerase II CTD in transcription in vitro and in vivo. J. Biol. Chem. 287, 23549–23561 [DOI] [PMC free article] [PubMed] [Google Scholar]
- 28. Shafi R., Iyer S. P., Ellies L. G., O'Donnell N., Marek K. W., Chui D., Hart G. W., Marth J. D. (2000) The O-GlcNAc transferase gene resides on the X chromosome and is essential for embryonic stem cell viability and mouse ontogeny. Proc. Natl. Acad. Sci. U.S.A. 97, 5735–5739 [DOI] [PMC free article] [PubMed] [Google Scholar]
- 29. O'Donnell N., Zachara N. E., Hart G. W., Marth J. D. (2004) Ogt-dependent X-chromosome-linked protein glycosylation is a requisite modification in somatic cell function and embryo viability. Mol. Cell. Biol. 24, 1680–1690 [DOI] [PMC free article] [PubMed] [Google Scholar]
- 30. Hanover J. A., Yu S., Lubas W. B., Shin S. H., Ragano-Caracciola M., Kochran J., Love D. C. (2003) Mitochondrial and nucleocytoplasmic isoforms of O-linked GlcNAc transferase encoded by a single mammalian gene. Arch. Biochem. Biophys. 409, 287–297 [DOI] [PubMed] [Google Scholar]
- 31. Abramowitz L. K., Olivier-Van Stichelen S., Hanover J. A. (2014) Chromosome imbalance as a driver of sex disparity in disease. J. Genomics 2, 77–88 [DOI] [PMC free article] [PubMed] [Google Scholar]
- 32. Olivier-Van Stichelen S., Abramowitz L. K., Hanover J. A. (2014) X marks the spot: Does it matter that O-GlcNAc Transferase is an X-linked gene? Biochem. Biophys. Res. Commun. 453, 201–207 [DOI] [PMC free article] [PubMed] [Google Scholar]
- 33. Forsythe M. E., Love D. C., Lazarus B. D., Kim E. J., Prinz W. A., Ashwell G., Krause M. W., Hanover J. A. (2006) Caenorhabditis elegans ortholog of a diabetes susceptibility locus: oga-1 (O-GlcNAcase) knockout impacts O-GlcNAc cycling, metabolism, and dauer. Proc. Natl. Acad. Sci. U.S.A. 103, 11952–11957 [DOI] [PMC free article] [PubMed] [Google Scholar]
- 34. Hanover J. A., Forsythe M. E., Hennessey P. T., Brodigan T. M., Love D. C., Ashwell G., Krause M. (2005) A Caenorhabditis elegans model of insulin resistance: altered macronutrient storage and dauer formation in an OGT-1 knockout. Proc. Natl. Acad. Sci. U.S.A. 102, 11266–11271 [DOI] [PMC free article] [PubMed] [Google Scholar]
- 35. Hanover J. A., Wang P. (2013) O-GlcNAc cycling shows neuroprotective potential in C. elegans models of neurodegenerative disease. Worm 2, e27043. [DOI] [PMC free article] [PubMed] [Google Scholar]
- 36. Mondoux M. A., Love D. C., Ghosh S. K., Fukushige T., Bond M., Weerasinghe G. R., Hanover J. A., Krause M. W. (2011) O-Linked-N-acetylglucosamine cycling and insulin signaling are required for the glucose stress response in Caenorhabditis elegans. Genetics 188, 369–382 [DOI] [PMC free article] [PubMed] [Google Scholar]
- 37. Radermacher P. T., Myachina F., Bosshardt F., Pandey R., Mariappa D., Müller H. A., Lehner C. F. (2014) O-GlcNAc reports ambient temperature and confers heat resistance on ectotherm development. Proc. Natl. Acad. Sci. U.S.A. 111, 5592–5597 [DOI] [PMC free article] [PubMed] [Google Scholar]
- 38. Wang P., Lazarus B. D., Forsythe M. E., Love D. C., Krause M. W., Hanover J. A. (2012) O-GlcNAc cycling mutants modulate proteotoxicity in Caenorhabditis elegans models of human neurodegenerative diseases. Proc. Natl. Acad. Sci. U.S.A. 109, 17669–17674 [DOI] [PMC free article] [PubMed] [Google Scholar]
- 39. Wang P., Hanover J. A. (2013) Nutrient-driven O-GlcNAc cycling influences autophagic flux and neurodegenerative proteotoxicity. Autophagy 9, 604–606 [DOI] [PMC free article] [PubMed] [Google Scholar]
- 40. Gambetta M. C., Oktaba K., Müller J. (2009) Essential role of the glycosyltransferase sxc/Ogt in polycomb repression. Science 325, 93–96 [DOI] [PubMed] [Google Scholar]
- 41. Ingham P. W. (1984) A gene that regulates the bithorax complex differentially in larval and adult cells of Drosophila. Cell 37, 815–823 [DOI] [PubMed] [Google Scholar]
- 42. Sinclair D. A., Syrzycka M., Macauley M. S., Rastgardani T., Komljenovic I., Vocadlo D. J., Brock H. W., Honda B. M. (2009) Drosophila O-GlcNAc transferase (OGT) is encoded by the Polycomb group (PcG) gene, super sex combs (sxc). Proc. Natl. Acad. Sci. U.S.A. 106, 13427–13432 [DOI] [PMC free article] [PubMed] [Google Scholar]
- 43. Sekine O., Love D. C., Rubenstein D. S., Hanover J. A. (2010) Blocking O-linked GlcNAc cycling in Drosophila insulin-producing cells perturbs glucose-insulin homeostasis. J. Biol. Chem. 285, 38684–38691 [DOI] [PMC free article] [PubMed] [Google Scholar]
- 44. Kim E. J., Perreira M., Thomas C. J., Hanover J. A. (2006) An O-GlcNAcase-specific inhibitor and substrate engineered by the extension of the N-acetyl moiety. J. Am. Chem. Soc. 128, 4234–4235 [DOI] [PubMed] [Google Scholar]
- 45. Kim E. J., Amorelli B., Abdo M., Thomas C. J., Love D. C., Knapp S., Hanover J. A. (2007) Distinctive inhibition of O-GlcNAcase isoforms by an α-GlcNAc thiolsulfonate. J. Am. Chem. Soc. 129, 14854–14855 [DOI] [PubMed] [Google Scholar]
- 46. Kim E. J., Bond M. R., Love D. C., Hanover J. A. (2014) Chemical tools to explore nutrient-driven O-GlcNAc cycling. Crit. Rev. Biochem. Mol. Biol. 49, 327–342 [DOI] [PMC free article] [PubMed] [Google Scholar]
- 47. Macauley M. S., Bubb A. K., Martinez-Fleites C., Davies G. J., Vocadlo D. J. (2008) Elevation of global O-GlcNAc levels in 3T3-L1 adipocytes by selective inhibition of O-GlcNAcase does not induce insulin resistance. J. Biol. Chem. 283, 34687–34695 [DOI] [PMC free article] [PubMed] [Google Scholar]
- 48. Yang Y. R., Song M., Lee H., Jeon Y., Choi E. J., Jang H. J., Moon H. Y., Byun H. Y., Kim E. K., Kim D. H., Lee M. N., Koh A., Ghim J., Choi J. H., Lee-Kwon W., et al. (2012) O-GlcNAcase is essential for embryonic development and maintenance of genomic stability. Aging Cell 11, 439–448 [DOI] [PubMed] [Google Scholar]
- 49. Yang Y. R., Jang H. J., Yoon S., Lee Y. H., Nam D., Kim I. S., Lee H., Kim H., Choi J. H., Kang B. H., Ryu S. H., Suh P. G. (2014) OGA heterozygosity suppresses intestinal tumorigenesis in Apc(min/+) mice. Oncogenesis 3, e109. [DOI] [PMC free article] [PubMed] [Google Scholar]
- 50. Nagy A. (2000) Cre recombinase: the universal reagent for genome tailoring. Genesis 26, 99–109 [PubMed] [Google Scholar]
- 51. Babinet C., Cohen-Tannoudji M. (2001) Genome engineering via homologous recombination in mouse embryonic stem (ES) cells: an amazingly versatile tool for the study of mammalian biology. An. Acad. Bras. Cienc. 73, 365–383 [DOI] [PubMed] [Google Scholar]
- 52. Turgeon B., Meloche S. (2009) Interpreting neonatal lethal phenotypes in mouse mutants: insights into gene function and human diseases. Physiol. Rev. 89, 1–26 [DOI] [PubMed] [Google Scholar]
- 53. Kim E. J., Kang D. O., Love D. C., Hanover J. A. (2006) Enzymatic characterization of O-GlcNAcase isoforms using a fluorogenic GlcNAc substrate. Carbohydr. Res. 341, 971–982 [DOI] [PMC free article] [PubMed] [Google Scholar]
- 54. McClain D. A., Lubas W. A., Cooksey R. C., Hazel M., Parker G. J., Love D. C., Hanover J. A. (2002) Altered glycan-dependent signaling induces insulin resistance and hyperleptinemia. Proc. Natl. Acad. Sci. U.S.A. 99, 10695–10699 [DOI] [PMC free article] [PubMed] [Google Scholar]
- 55. Vosseller K., Wells L., Lane M. D., Hart G. W. (2002) Elevated nucleocytoplasmic glycosylation by O-GlcNAc results in insulin resistance associated with defects in Akt activation in 3T3-L1 adipocytes. Proc. Natl. Acad. Sci. U.S.A. 99, 5313–5318 [DOI] [PMC free article] [PubMed] [Google Scholar]
- 56. Eldar-Finkelman H., Schreyer S. A., Shinohara M. M., LeBoeuf R. C., Krebs E. G. (1999) Increased glycogen synthase kinase-3 activity in diabetes- and obesity-prone C57BL/6J mice. Diabetes 48, 1662–1666 [DOI] [PubMed] [Google Scholar]
- 57. Summers S. A., Kao A. W., Kohn A. D., Backus G. S., Roth R. A., Pessin J. E., Birnbaum M. J. (1999) The role of glycogen synthase kinase 3β in insulin-stimulated glucose metabolism. J. Biol. Chem. 274, 17934–17940 [DOI] [PubMed] [Google Scholar]
- 58. Oreña S. J., Torchia A. J., Garofalo R. S. (2000) Inhibition of glycogen-synthase kinase 3 stimulates glycogen synthase and glucose transport by distinct mechanisms in 3T3-L1 adipocytes. J. Biol. Chem. 275, 15765–15772 [DOI] [PubMed] [Google Scholar]
- 59. Doble B. W., Woodgett J. R. (2003) GSK-3: tricks of the trade for a multi-tasking kinase. J. Cell Sci. 116, 1175–1186 [DOI] [PMC free article] [PubMed] [Google Scholar]
- 60. Nadler S. T., Stoehr J. P., Schueler K. L., Tanimoto G., Yandell B. S., Attie A. D. (2000) The expression of adipogenic genes is decreased in obesity and diabetes mellitus. Proc. Natl. Acad. Sci. U.S.A. 97, 11371–11376 [DOI] [PMC free article] [PubMed] [Google Scholar]
- 61. Fuentes L., Roszer T., Ricote M. (2010) Inflammatory mediators and insulin resistance in obesity: role of nuclear receptor signaling in macrophages. Mediators Inflamm. 2010, 219583. [DOI] [PMC free article] [PubMed] [Google Scholar]
- 62. Yang X., Ongusaha P. P., Miles P. D., Havstad J. C., Zhang F., So W. V., Kudlow J. E., Michell R. H., Olefsky J. M., Field S. J., Evans R. M. (2008) Phosphoinositide signalling links O-GlcNAc transferase to insulin resistance. Nature 451, 964–969 [DOI] [PubMed] [Google Scholar]
- 63. Akimoto Y., Hart G. W., Wells L., Vosseller K., Yamamoto K., Munetomo E., Ohara-Imaizumi M., Nishiwaki C., Nagamatsu S., Hirano H., Kawakami H. (2007) Elevation of the post-translational modification of proteins by O-linked N-acetylglucosamine leads to deterioration of the glucose-stimulated insulin secretion in the pancreas of diabetic Goto-Kakizaki rats. Glycobiology 17, 127–140 [DOI] [PubMed] [Google Scholar]
- 64. Soesanto Y. A., Luo B., Jones D., Taylor R., Gabrielsen J. S., Parker G., McClain D. A. (2008) Regulation of Akt signaling by O-GlcNAc in euglycemia. Am. J. Physiol. Endocrinol. Metab. 295, E974–E980 [DOI] [PMC free article] [PubMed] [Google Scholar]
- 65. Wang Z., Pandey A., Hart G. W. (2007) Dynamic interplay between O-linked N-acetylglucosaminylation and glycogen synthase kinase-3-dependent phosphorylation. Mol. Cell. Proteomics 6, 1365–1379 [DOI] [PubMed] [Google Scholar]
- 66. Chen M., Berger A., Kablan A., Zhang J., Gavrilova O., Weinstein L. S. (2012) Gsα deficiency in the paraventricular nucleus of the hypothalamus partially contributes to obesity associated with Gsα mutations. Endocrinology 153, 4256–4265 [DOI] [PMC free article] [PubMed] [Google Scholar]
- 67. Cooksey R. C., McClain D. A. (2002) Transgenic mice overexpressing the rate-limiting enzyme for hexosamine synthesis in skeletal muscle or adipose tissue exhibit total body insulin resistance. Ann. N.Y. Acad. Sci. 967, 102–111 [DOI] [PubMed] [Google Scholar]
- 68. McClain D. A., Alexander T., Cooksey R. C. (2000) Hexosamines stimulate leptin production in transgenic mice. Endocrinology 141, 1999–2002 [DOI] [PubMed] [Google Scholar]
- 69. McClain D. A., Hazel M., Parker G. (2005) Adipocytes with increased hexosamine flux exhibit insulin resistance, increased glucose uptake, and increased synthesis and storage of lipid. Am. J. Physiol. Endocrinol. Metab. 288, E973–E979 [DOI] [PubMed] [Google Scholar]
- 70. Hazel M., Cooksey R. C., Jones D., Parker G., Neidigh J. L., Witherbee B., Gulve E. A., McClain D. A. (2004) Activation of the hexosamine signaling pathway in adipose tissue results in decreased serum adiponectin and skeletal muscle insulin resistance. Endocrinology 145, 2118–2128 [DOI] [PubMed] [Google Scholar]
- 71. Müller G., Ertl J., Gerl M., Preibisch G. (1997) Leptin impairs metabolic actions of insulin in isolated rat adipocytes. J. Biol. Chem. 272, 10585–10593 [DOI] [PubMed] [Google Scholar]
- 72. Teo C. F., Wollaston-Hayden E. E., Wells L. (2010) Hexosamine flux, the O-GlcNAc modification, and the development of insulin resistance in adipocytes. Mol. Cell. Endocrinol. 318, 44–53 [DOI] [PMC free article] [PubMed] [Google Scholar]
- 73. Benz V., Bloch M., Wardat S., Böhm C., Maurer L., Mahmoodzadeh S., Wiedmer P., Spranger J., Foryst-Ludwig A., Kintscher U. (2012) Sexual dimorphic regulation of body weight dynamics and adipose tissue lipolysis. PLoS One 7, e37794. [DOI] [PMC free article] [PubMed] [Google Scholar]
- 74. Huijsman E., van de Par C., Economou C., van der Poel C., Lynch G. S., Schoiswohl G., Haemmerle G., Zechner R., Watt M. J. (2009) Adipose triacylglycerol lipase deletion alters whole body energy metabolism and impairs exercise performance in mice. Am. J. Physiol. Endocrinol. Metab. 297, E505–E513 [DOI] [PubMed] [Google Scholar]
- 75. Wan M., Easton R. M., Gleason C. E., Monks B. R., Ueki K., Kahn C. R., Birnbaum M. J. (2012) Loss of Akt1 in mice increases energy expenditure and protects against diet-induced obesity. Mol. Cell. Biol. 32, 96–106 [DOI] [PMC free article] [PubMed] [Google Scholar]
- 76. Katic M., Kennedy A. R., Leykin I., Norris A., McGettrick A., Gesta S., Russell S. J., Bluher M., Maratos-Flier E., Kahn C. R. (2007) Mitochondrial gene expression and increased oxidative metabolism: role in increased lifespan of fat-specific insulin receptor knock-out mice. Aging Cell 6, 827–839 [DOI] [PMC free article] [PubMed] [Google Scholar]
- 77. Qiao L., Kinney B., Schaack J., Shao J. (2011) Adiponectin inhibits lipolysis in mouse adipocytes. Diabetes 60, 1519–1527 [DOI] [PMC free article] [PubMed] [Google Scholar]
- 78. Kim J. Y., van de Wall E., Laplante M., Azzara A., Trujillo M. E., Hofmann S. M., Schraw T., Durand J. L., Li H., Li G., Jelicks L. A., Mehler M. F., Hui D. Y., Deshaies Y., Shulman G. I., Schwartz G. J., Scherer P. E. (2007) Obesity-associated improvements in metabolic profile through expansion of adipose tissue. J. Clin. Invest. 117, 2621–2637 [DOI] [PMC free article] [PubMed] [Google Scholar]
- 79. Rahman M. M., Stuchlick O., El-Karim E. G., Stuart R., Kipreos E. T., Wells L. (2010) Intracellular protein glycosylation modulates insulin mediated lifespan in C. elegans. Aging 2, 678–690 [DOI] [PMC free article] [PubMed] [Google Scholar]
- 80. Parker G. J., Lund K. C., Taylor R. P., McClain D. A. (2003) Insulin resistance of glycogen synthase mediated by O-linked N-acetylglucosamine. J. Biol. Chem. 278, 10022–10027 [DOI] [PubMed] [Google Scholar]
- 81. Macauley M. S., Shan X., Yuzwa S. A., Gloster T. M., Vocadlo D. J. (2010) Elevation of global O-GlcNAc in rodents using a selective O-GlcNAcase inhibitor does not cause insulin resistance or perturb glucohomeostasis. Chem. Biol. 17, 949–958 [DOI] [PMC free article] [PubMed] [Google Scholar]
- 82. Macauley M. S., He Y., Gloster T. M., Stubbs K. A., Davies G. J., Vocadlo D. J. (2010) Inhibition of O-GlcNAcase using a potent and cell-permeable inhibitor does not induce insulin resistance in 3T3-L1 adipocytes. Chem. Biol. 17, 937–948 [DOI] [PMC free article] [PubMed] [Google Scholar]
- 83. Wagner K. U., McAllister K., Ward T., Davis B., Wiseman R., Hennighausen L. (2001) Spatial and temporal expression of the Cre gene under the control of the MMTV-LTR in different lines of transgenic mice. Transgenic Res. 10, 545–553 [DOI] [PubMed] [Google Scholar]
- 84. Miller S. A., Dykes D. D., Polesky H. F. (1988) A simple salting out procedure for extracting DNA from human nucleated cells. Nucleic Acids Res. 16, 1215. [DOI] [PMC free article] [PubMed] [Google Scholar]