

Background: How autophagy, a cell survival mechanism, regulates intestinal epithelial tight junction barrier or paracellular permeability is unknown.
Results: Autophagy reduces the paracellular permeability of small solutes and ions via degradation of the pore-forming tight junction protein claudin-2.
Conclusion: Autophagy enhances tight junction barrier function by targeting claudin-2.
Significance: This is the first report showing autophagy regulation of the intestinal tight junction barrier.
Keywords: Autophagy, Epithelial Cell, Intestinal Epithelium, Protein Degradation, Tight Junction, Claudin-2
Abstract
Autophagy is an intracellular degradation pathway and is considered to be an essential cell survival mechanism. Defects in autophagy are implicated in many pathological processes, including inflammatory bowel disease. Among the innate defense mechanisms of intestinal mucosa, a defective tight junction (TJ) barrier has been postulated as a key pathogenic factor in the causation and progression of inflammatory bowel disease by allowing increased antigenic permeation. The cross-talk between autophagy and the TJ barrier has not yet been described. In this study, we present the novel finding that autophagy enhances TJ barrier function in Caco-2 intestinal epithelial cells. Nutrient starvation-induced autophagy significantly increased transepithelial electrical resistance and reduced the ratio of sodium/chloride paracellular permeability. Nutrient starvation reduced the paracellular permeability of small-sized urea but not larger molecules. The role of autophagy in the modulation of paracellular permeability was confirmed by pharmacological induction as well as pharmacological and genetic inhibition of autophagy. Consistent with the autophagy-induced reduction in paracellular permeability, a marked decrease in the level of the cation-selective, pore-forming TJ protein claudin-2 was observed after cell starvation. Starvation reduced the membrane presence of claudin-2 and increased its cytoplasmic, lysosomal localization. Therefore, our data show that autophagy selectively reduces epithelial TJ permeability of ions and small molecules by lysosomal degradation of the TJ protein claudin-2.
Introduction
The intestinal epithelium forms a crucial interface between the intestinal mucosa and the luminal environment. Besides forming a physical barrier, the intestinal epithelium regulates water, nutrient, and ion transport while providing a barrier against toxins and pathogenic organisms. The apical intercellular tight junctions (TJs)2 are responsible for the paracellular barrier function and regulate transepithelial flux of ions and solutes between adjacent cells. Increased intestinal permeability caused by defects in the intestinal epithelial TJ barrier is considered an important pathogenic factor for the development of intestinal inflammation (1–4). Defects in the intestinal TJ barrier allow increased antigenic penetration, resulting in an amplified inflammatory response in inflammatory bowel disease (IBD), celiac disease, necrotizing enterocolitis, and ischemia-reperfusion injury (1, 2). Conversely, the enhancement or retightening of the intestinal TJ barrier has been shown to accelerate the resolution of intestinal inflammation in both animal models of IBD and human IBD (3–5). The mechanisms of physiological regulation of the intestinal TJ barrier and its dysregulation under pathological conditions remain poorly understood.
Autophagy, an intracellular degradation pathway, is an essential cell survival mechanism and plays an important role in diverse processes such as metabolic stress, neurodegeneration, cancer, aging, immunity, and inflammatory diseases (6). Autophagy refers to the engulfment and processing of cellular proteins, including damaged organelles and long-lived and misfolded proteins. Autophagy has been shown to be active in the normal colonic intestinal mucosa, more so in the proliferative component of colonic crypts (7), and has been suggested to play a role in intestinal cell survival during physiological stress (8). Among intestinal diseases, autophagy was first linked to pathogenesis of Crohn disease when genome-wide association studies identified mutations in the autophagy-related genes ATG16L1 and IRGM as risk factors for Crohn disease (9–11). Recent studies have shown the role of autophagy in dendritic-epithelial cell interactions, adaptive immune response, NOD2-directed bacterial sensing, lysosomal destruction, and immune-mediated clearance to be important for the pathogenesis of IBD (12–15). Although clinical data show a direct link between a defective intestinal TJ barrier and persistent and prolonged intestinal inflammation in IBD patients (5, 16, 17), the role of autophagy in the regulation of the intestinal epithelial TJ barrier remains unknown.
The aim of this study was to examine the role of autophagy in the regulation of intestinal TJ barrier function using a commonly used in vitro intestinal epithelial model system consisting of filter-grown Caco-2 monolayers. Our data show that autophagy induces a significant enhancement in TJ barrier function of ions and small-sized solutes in Caco-2 cells by targeting the degradation of the TJ protein claudin-2.
EXPERIMENTAL PROCEDURES
Cell Culture and Reagents
Caco-2 cells obtained from the American Type Culture Collection were grown on 0.4 μm pore size, 12-mm diameter inserts maintained at 37 °C in DMEM supplemented with 10% fetal bovine serum. The transepithelial electrical resistance (TER) of the filter-grown cells was measured by an epithelial voltohmeter (World Precision Instruments, Sarasota, FL), and monolayers with a TER of 450–500 Ω/cm2 were used for experiments. Madin-Darby canine kidney (MDCK) I and II cells were obtained from Sigma (catalog nos. 00062106 and 00062107, respectively). Starvation was induced by incubation of filter-grown monolayers in Earle's balanced salt solution (Sigma, catalog no. E3024). Other reagents used were the autophagy inducer rapamycin (Invitrogen, catalog no. PHZ1235), PP242 (Santa Cruz Biotechnology, catalog no. sc-301606), the autophagy inhibitors bafilomycin A1 (Santa Cruz Biotechnology, catalog no. sc-201550), wortmannin (Sigma, catalog no. W1628), and chloroquine (Sigma, catalog no. C6628). Primary antibodies for occludin and claudin-1, 2, 3, and 8 were purchased from Life Technologies. Claudin-13 antibody was obtained from Novus Biologicals (catalog no. NBP1-80029). LC3B antibody was obtained from Sigma (catalog no. L7543), caspase-3 (catalog no. 9665) and caspase-7 (catalog no. 9492) antibodies were from Cell Signaling Technology, and LAMP2 antibodies were from Novus Biologicals (catalog nos. NBP1-95696 and NBP2-22217). Cytotoxicity was assessed by lactate dehydrogenase release according to the protocol of the manufacturer (Sigma, TOX7).
Determination of Caco-2 Paracellular Permeability and TJ Ion Selectivity
Beside the measurements of TER, Caco-2 and MDCK cell paracellular permeability was determined using the following paracellular markers of various sizes: dextran (−14C, Mr = 10,000), inulin (−14C, Mr = 5000), mannitol (−3H, Mr = 182), l-glucose (−3H, Mr = 180), and urea (−14C, Mr = 60). For the determination of apical-to-basal flux rates of the paracellular markers, known concentrations (1.5 μm) of these paracellular markers were added to the apical solution, and radioactivity was measured in basal solution using a scintillation counter, as described previously (18). TJ ion selectivity was determined by measuring the dilution potentials in the presence of an electrochemical gradient (80 and 145 mm NaCl on either the apical or basal side, osmotically balanced by addition of 130 mm mannitol on the opposite side). The ion permeability ratio (η) for Caco-2 monolayers was calculated from the dilution potential using the Goldman-Hodgkin-Katz equation: η = − (ϵ − ev) / (1 − ev), where η is the ratio of permeability of the monolayer to Na+ over the permeability to Cl− (η = PNa / PCl), ϵ is the dilution factor (ϵ = Cbasal / Capical), and v = eV / kT (where V is the dilution potential, k is the Boltzmann constant, e is the elementary charge, and T is the Kelvin temperature) (19, 20).
Cell Transfections
Caco-2 or MDCK II monolayers were transiently transfected with ATG7, ATG16L1, and CLDN2 siRNA (Thermo Scientific) using DharmaFect transfection reagent as described previously (18). In brief, confluent Caco-2 monolayers on 12-well Transwell plates were treated with 5 ng (0.5 nmol) of the siRNA and DharmaFect transfection reagent in Accell medium (Thermo Scientific). The efficiency of silencing was confirmed by Western blot analysis after 72 h of treatment. For ectopic overexpression of claudin-2, Caco-2 cells were transfected with a CLDN2 expression clone (EX-V1294-M02, vector pEZ-M02, GeneCopoeia) according to the instructions of the supplier.
Western Blot Analysis for Assessment of Protein Expression
To study protein expression, Caco-2 monolayers were rinsed with ice-cold PBS, and cells were lysed with lysis buffer (50 mm Tris·HCl (pH 7.5), 150 mm NaCl, 500 μm NaF, 2 mm EDTA, 100 μm vanadate, 100 μm phenylmethylsulfonyl fluoride, 1 μg/ml leupeptin, 1 μg/ml pepstatin A, 40 mm paranitrophenyl phosphate, 1 μg/ml aprotinin, and 1% Triton X-100). The cell lysates were clarified (2000 rpm, 2 min), centrifuged (10,000 rpm, 10 min), and the supernatant was saved. Protein analysis of extract aliquots was performed (BCA protein assay kit, Pierce), and Laemmli gel loading buffer was added to the lysate and boiled for 7 min. An equal amount of protein was loaded and separated on an SDS-PAGE gel. Proteins from the gel were transferred to a nitrocellulose membrane, and the membrane was incubated for 2 h in blocking solution (5% dry milk in TBS-Tween 20 buffer). The membrane was incubated with appropriate primary antibody in blocking solution. After being washed in TBS-1% Tween buffer, the membrane was incubated in the appropriate secondary antibody and developed using Santa Cruz Biotechnology Western blotting luminol reagent (Santa Cruz Biotechnology) on Kodak BioMax MS film (Fisher Scientific).
Confocal Immunostaining
Membrane localization of TJ proteins and staining of LC3 was assessed by immunofluorescence antibody labeling. Caco-2 monolayers were washed twice in cold PBS, fixed with 2% paraformaldehyde for 20 min, and permeabilized with 0.1% Triton X-100 in PBS at room temperature for 5 min. The cell monolayers were then blocked in normal serum and labeled with primary antibodies in blocking solution overnight at 4 °C. After being washed with PBS, the cells were incubated in FITC or Cy-3-conjugated secondary antibodies. ProLong Gold antifade reagent (Invitrogen) containing DAPI as a nuclear stain was used to mount the cell filters on glass slides. The slides were examined using a confocal fluorescence microscope (LSM 510, University of New Mexico Imaging Center) equipped with a Hamamatsu digital camera (Hamamatsu Photonics, Hamamatsu, Japan). Images were processed with LSM software (Zeiss, Germany).
Coimmunoprecipitation Analysis
Coimmunoprecipitation studies were performed using Dynabeads protein G according to the instructions of the manufacturer (Invitrogen). Dynabeads were incubated with LAMP2 antibody, washed, and then incubated with sample lysates. Immunoprecipitates were separated by SDS-PAGE and analyzed further by Western blotting.
Statistical Analysis
The values of experimental data were expressed as the mean ± S.E. and analyzed using Student's t test for unpaired data and analysis of variance whenever required (GraphPad Prism 5.00 for Windows, GraphPad Software, San Diego, CA). p < 0.05 was considered significant. Independents experiments were repeated at least three times to ensure reproducibility.
RESULTS
Nutrient Starvation Enhances Epithelial TJ Barrier Function of Intestinal Caco-2 Cells
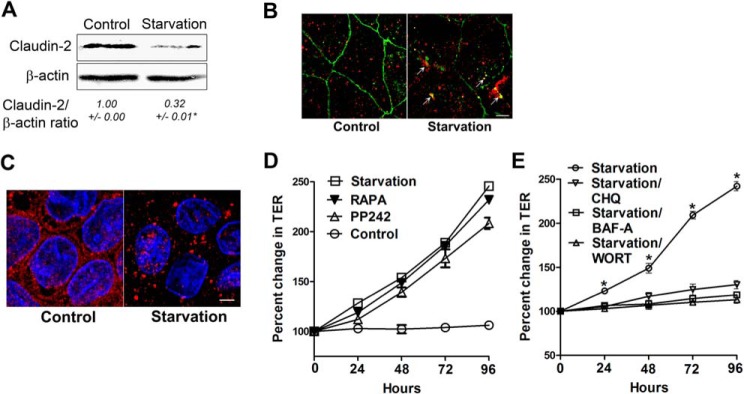
To study the effect of autophagy on epithelial barrier function, we used an established model of nutrient starvation-induced autophagy. Filter-grown Caco-2 cell monolayers were incubated with serum-free Earle's balanced salt solution, and the TER was measured to assess TJ barrier function. Starvation progressively increased TER up to 200% over a period of 96 h (Fig. 1A). The paracellular permeability was also measured by the apical-to-basal flux of the commonly used paracellular markers dextran and inulin. The paracellular flux of the macromolecules dextran (Mr = 10,000) and inulin (Mr = 5000) was not changed after starvation (Fig. 1, B and C). Therefore, starvation increased Caco-2 TER without affecting paracellular flux of the large paracellular markers. Next, because TER is a measurement of paracellular ionic conductance (in this particular case Na+ and Cl− conductance), we examined whether TJ ion selectivity and small solute permeability was altered because of starvation. To this end, using the dilution potential technique as detailed under “Experimental Procedures,” we found that starvation significantly reduced the dilution potential and the ratio of permeability of sodium (PNa) to chloride (PCl) of Caco-2 cells (Fig. 2, A and B). Starvation did not affect the flux of the medium-sized paracellular probes mannitol (Mr = 182; molecular radius, 4.1 Å) or l-glucose (Mr = 180; molecular radius, 4.3 Å) (Fig. 2, C and D) but caused a progressive reduction in the flux of small-sized solute urea (Mr = 60; molecular radius, 2.9 Å) (Fig. 2E). Therefore, starvation caused an increase in Caco-2 TER, decreased the paracellular permeability to small-sized solutes, and decreased the cation-to-anion permeability without affecting the flux of larger-sized solutes with a molecular radius of ≥4.1 Å.
FIGURE 1.

Starvation enhances the epithelial barrier function of filter-grown Caco-2 monolayers. A, filter-grown Caco-2 monolayers were incubated in starvation medium (Earle's balanced salt solution), and TER was measured over a 96-h experimental period. Starvation significantly increased TER over the normally fed control group (*, p < 0.01). B and C, starvation did not cause any change in the apical-to-basal flux of the paracellular macromolecular probes 10-kD dextran (molecular radius, 23 Å) and inulin (molecular radius, 15 Å) (flux measured after 96 h of starvation).
FIGURE 2.

Starvation reduces the TJ cation selectivity and small solute permeability of filter-grown Caco-2 monolayers. A, the NaCl dilution potential was measured after formation of an apical-to-basal electrochemical gradient, as detailed under “Experimental Procedures.” The change in dilution potential was reduced significantly after starvation (for 96 h) compared with the control group (*, p < 0.001). Similar results were obtained after the formation of a basal-to-apical electrochemical gradient (data not shown). B, starvation changed the TJ ion selectivity and reduced the ratio of the permeability of Na+ to Cl−, as calculated from the dilution potentials and the Goldman-Hodgkin-Katz equation, detailed under “Experimental Procedures” (*, p < 0.001 versus control). C—E, starvation did not affect the paracellular flux of mannitol (molecular radius, 4.1 Å) and l-glucose (molecular radius, 4.3 Å) but progressively reduced the flux of small solute urea (molecular radius, 2.9 Å) (*, p < 0.01 versus control).
Starvation Reduces Expression of the TJ Protein Claudin-2
The apical TJs are the junctional complexes responsible for regulating paracellular permeability. The apical TJs are known to have two pathways, a small-size, cation-selective, high-capacity “pore” pathway and a large-size, non-charge-selective “leak” pathway. Our findings of a starvation-induced reduction in ion permeability as reflected by increased TER, a reduction in TJ cation selectivity, and a reduction in small-size urea permeability suggested that starvation selectively targeted the pore pathway without affecting the leak pathway. The pore pathway is largely regulated by the TJ membrane proteins claudin, particularly claudin-2, which is a cation-selective, pore-forming protein (21, 22). Therefore, we next studied protein expression of selected claudins (claudin-1, 2, 3, 8, and 13) that are known to regulate the paracellular TJ barrier (23). The protein level of claudin-1, 3, 8, and 13 showed no change during starvation (Fig. 3A). However, the levels of the cation-selective, pore-forming TJ protein claudin-2 were found to be reduced markedly after starvation (Fig. 3, A and B). The starvation-induced reduction in claudin-2 protein expression correlated linearly with the increase in Caco-2 TER and the reduction in paracellular flux of urea (Fig. 3, C and D), with a correlation coefficient of 0.96 and 0.95, respectively.
FIGURE 3.

Starvation induced changes in claudins. A, Caco-2 cells were incubated in starvation medium for the indicated time and analyzed by Western blotting for claudins. β-actin is shown as a loading control. The protein levels of claudin-2, but not claudin-1, 3, 8, and 13, were reduced during starvation. B, the densitometry analysis was performed using ImageJ software to indicate the relative levels of claudin-2 after starvation. The band density in the control group was set to 1. The graph is representative of more than three independent experiments (*, p < 0.01 versus control). The starvation-induced reduction in claudin-2 protein expression correlated linearly with the increase in Caco-2 TER (C) and the reduction in paracellular flux of urea (D) (p < 0.001).
Nutrient Starvation Induces Autophagy in Caco-2 Cells
Starvation induces autophagy in a wide variety of cell culture models. During the induction of autophagy, microtubule-associated protein light chain (LC3) is lipidated and incorporated into the autophagosomal membrane and is widely used as a marker for autophagy (6). Immunoblotting for LC3 in starved Caco-2 cells showed a progressive increase in the ratio of LC3-II (lipidated form) to LC3-I protein during starvation (Fig. 4, A and B). We also measured the level of another autophagy substrate, p62 (SQSTM1). p62 is an adaptor protein that binds to LC3 and is degraded during starvation-mediated autophagy (24). We found that there was a progressive decrease in the p62 protein level during starvation (Fig. 4A). Furthermore, inhibition of autophagy with the lysosomal inhibitor bafilomycin A resulted in the accumulation of LC3-II in the presence of starvation media (Fig. 4C). The autophagic flux was evident by the difference in the amount of LC3-II in the absence or presence of bafilomycin A during starvation (Fig. 4D). Consistent with these findings, confocal immunofluorescence microscopy showed a punctate (autophagosomal) staining pattern of LC3 in starved cells (Fig. 4E). These data confirm that starvation induced autophagy in Caco-2 cells. Starvation did not produce cytotoxicity, as assessed by lactate dehydrogenase release assay (data not shown) and did not induce apoptosis, as assessed by capspase-3 and caspase-7 protein expression (Fig. 4F).
FIGURE 4.

Starvation induces autophagy in Caco-2 cell monolayers. A, Caco-2 cells were incubated in starvation medium for the indicated time and analyzed by Western blotting for LC3B and p62 protein. β-actin is shown as a loading control (Con). B, the ratio of LC3-II/LC3I density was calculated using ImageJ software. The LC3-II/LC3I ratio in the control (Cont) group was set to 1. The Western blot in A and the graph are representative of more than four independent experiments (*, p < 0.01 versus control). C, Caco-2 cells were incubated in starvation medium and bafilomycin A (20 nm) for the indicated time and analyzed by Western blotting for LC3B protein level. D, autophagic flux is represented by the accumulation of LC3II in the presence of bafilomycin A (Baf) (as shown in C) and not in the presence of bafilomycin A (as shown in A) during starvation (*, p < 0.01). E, confocal immunofluorescence for LC3 staining in starved cells showed cytoplasmic punctum formation. Scale bar = 10 μm. Shown is a representation of 48 h of starvation. F, starvation did not induce apoptosis in Caco-2 cells. Caspase-3 and caspase-7 protein expression did not change during starvation. Also, cleaved caspase-3 and -7 were not observed during starvation. Blots are representative of three independent experiments.
Autophagy Regulates Paracellular Permeability, and Pharmacologic Induction of Autophagy Enhances the Caco-2 TJ Barrier
To assess the direct role of autophagy and to rule out the possibility that other biological changes induced by starvation caused the increase in the Caco-2 TJ barrier, we next examined whether the pharmacological induction of autophagy in normally fed Caco-2 cells was also sufficient to cause an enhancement in the caco-2 TJ barrier. Mammalian target of rapamycin (mTOR) is a key suppressor of autophagy, and rapamycin, an inhibitor of mTOR, activates autophagy (25). In Caco-2 cells fed with media containing standard nutritional supplements, rapamycin caused a progressive increase in Caco-2 TER (Fig. 5A). The time course of the rapamycin-induced increase in Caco-2 TER and the level of increase were similar to that of starved cells. Rapamycin treatment caused an increase in the relative levels of LC3II to LC3I, confirming autophagy induction (Fig. 5B). Rapamycin also caused a decrease in urea flux (Fig. 5D). Another distinct pharmacologic mTOR inhibitor, PP242 (26), also induced a similar increase in TER (Fig. 5A). Therefore, autophagy induction was found to be sufficient to cause an enhancement in the Caco-2 TJ barrier. Furthermore, we examined the effect of autophagy inhibition on rapamycin-induced changes in TJ barrier function. We utilized pharmacologic inhibitors that affect different stages of autophagy and autophagosome formation. The concentrations of these inhibitor agents were derived from dose curve studies that determined the doses of each drug that did not cause cellular damage or affect the TER in normally fed Caco-2 cells (data not shown). Bafilomycin A is a known inhibitor of V-ATPase and, therefore, inhibits autolysosome formation and degradation (27, 28). Chloroquine inhibits autophagy via inhibition of the acidification of lysosomes (29), and wortmannin is a known inhibitor of class III PI3K, which is required to initiate autophagy (30). As shown in Fig. 5C, the simultaneous incubation of rapamycin-treated Caco-2 cells with bafilomycin A, chloroquine, or wortmannin inhibited a rapamycin-induced increase in TER. Bafilomycin A, chloroquine, and wortmannin also attenuated the rapamycin-induced reduction in urea flux (Fig. 5D). Therefore, autophagy inhibitors reversed the rapamycin-induced changes in TJ barrier function.
FIGURE 5.

Rapamycin-induced autophagy enhances TJ barrier function. A, incubation of Caco-2 cells in normal medium with the mTOR inhibitors rapamycin and PP242 (500 nm) increased TER compared with cells in starvation medium. B, Caco-2 cells were treated with rapamycin for the indicated time and analyzed by Western blotting for LC3B protein level. β-actin is shown as a loading control. The LC3 II/I densitometry ratio was found to be increased during rapamycin treatment. *, p < 0.01 versus time 0. C, the rapamycin (RAPA)-induced increase in TER was inhibited by the autophagy inhibitors bafilomycin A (BAF, 20 nm), chloroquine (CHQ, 20 μm), and wortmannin (WORT, 200 nm). *, p < 0.01 versus all other groups. D, rapamycin treatment reduced the paracellular flux of urea compared with control cells. The autophagy inhibitors bafilomycin A, chloroquine, and wortmannin attenuated the rapamycin-induced reduction in urea flux. The flux was measured after 96 h of rapamycin treatment. *, p < 0.01 versus control; #, p < 0.01 versus rapamycin. E, rapamycin treatment of Caco-2 cells in normal media led to a reduction in claudin-2 protein level. β-actin is shown as a loading control, and densitometry is represented as the claudin-2:β-actin ratio. *, p < 0.01 versus time 0.
Pharmacologic and Genetic Inhibition of Autophagy-related Proteins Inhibits Starvation-induced Enhancement in the Caco-2 TJ Barrier
In the following studies, we further examined the role of autophagy in the enhancement of the Caco-2 TJ barrier by pharmacological inhibition of autophagy during cell starvation. As shown in Fig. 6A, addition of bafilomycin A, chloroquine, or wortmannin to the starving Caco-2 cells significantly prevented a starvation-induced increase in TER. As shown in Fig. 4C, bafilomycin A treatment caused the accumulation of LC3II in starved cells.
FIGURE 6.

Autophagy inhibition attenuates the starvation-induced enhancement in the TJ barrier. A, incubation of Caco-2 cells in starvation medium with bafilomycin A (20 nm), chloroquine (CHQ, 20 μm), and wortmannin (200 nm) significantly inhibited the increase in TER caused by starvation. *, p < 0.01 versus all other groups. B, the respective siRNA transfection, but not NT siRNA transfection, produced a significant knockdown of ATG16L1 and ATG7 protein expression. C, inhibition of the autophagy-related proteins ATG16L1 and ATG7 with siRNA transfection, but not non-target siRNA transfection, significantly inhibited the increase in TER caused by starvation. * and #, p < 0.01 versus starvation. D, ATG 16L1 and ATG7 siRNA, but not non-target siRNA transfection, significantly attenuated the starvation-induced reduction in paracellular flux of urea (96 h of starvation). *, p < 0.01 versus all other groups. E and F, autophagy inhibition during starvation by bafilomycin A (BAF), chloroquine, and wortmannin (WORT) (E) and ATG16L1 and ATG7 siRNA (F) prevented a starvation-induced reduction in claudin-2 protein level. β-actin is shown as a loading control (con). The blots represent at least three independent experiments. The claudin-2:actin ratio represents the densitometry analysis. *, p < 0.01 versus all other groups.
To further validate the role of autophagy in the Caco-2 TJ barrier and to address the possible off-target effect of the pharmacological agents bafilomycin A, chloroquine, and wortmannin (31), knockdown of specific ATG genes by siRNA was used. Expression of two autophagy-related proteins, ATG16L1 and ATG7, both of which are known to be critical for the formation of isolation membranes of autophagosomes (32, 33), was knocked down by siRNA silencing in filter-grown Caco-2 monolayers. The respective siRNA transfection, but not non-target (NT) siRNA transfection, produced a near-complete knockdown of ATG16L1 and ATG7 protein expression (Fig. 6B). ATG16L1 and ATG7 siRNA, but not NT siRNA transfection, significantly prevented the increase in TER induced by starvation (Fig. 6C). The ATG16L1 and ATG7 siRNA transfections by itself did not affect Caco-2 TER in transfected cells (data not shown). ATG16L1 and ATG7 siRNA transfection also prevented the starvation-induced reduction in urea flux (Fig. 6D). Importantly, treatment of starving Caco-2 cells with various autophagy inhibitors (Fig. 6E) and transfection with ATG16 and ATG7 siRNA (Fig. 6F) prevented a starvation-induced reduction in the claudin-2 protein level. These findings provide unequivocal evidence that autophagy activation leads to an enhancement of Caco-2 TJ barrier function via claudin-2 degradation.
Overexpression of Claudin-2 Attenuates Starvation-induced Changes in TJ Barrier Function
To further confirm the role of claudin-2 in autophagy-mediated changes in TJ barrier function, claudin-2 was overexpressed in Caco-2 cells. Ectopic overexpression of claudin-2 in Caco-2 cells was achieved by transfection of human CLDN2 cDNA as detailed under “Experimental Procedures.” The starvation-induced increase in TER was inhibited significantly in claudin-2-overexpressing cells (Caco-2CLDN2, Fig. 7B). The claudin-2-overexpressing cells showed a modest (∼25%) reduction in urea flux compared with control empty vector-expressing cells (∼ 65%, Fig. 7C). These results indicate that starvation induced enhancement of the Caco-2 TJ barrier in a claudin-2 dependent manner.
FIGURE 7.

Overexpression of claudin-2 attenuates starvation-induced changes in TJ barrier function. A, overexpression of human CLDN2 cDNA into Caco-2 cells (Caco-2CLDN2), as detailed under “Experimental Procedures,” led to an increase in claudin-2 protein level, as assessed by Western blot analysis. *, p < 0.01 versus control empty vector-expressing cells (Caco-2pEZM02). B, the starvation-induced increase in TER was inhibited significantly in claudin-2 overexpressing cells (Caco-2CLDN2). *, p < 0.01. C, starvation caused a modest reduction in urea flux in Caco-2CLDN2 cells compared with Caco-2pEZM02 cells. *, p < 0.01.
Claudin-2 Is Targeted to Lysosomes during Starvation
In the studies above, claudin-2 protein levels were found to be down-regulated consistent with the changes in TER and urea flux during starvation. Autophagy is a degradation pathway that delivers cargo proteins to lysosomes. Therefore, in the following studies, we investigated claudin-2 delivery to the lysosome and its lysosomal degradation. In confocal immunofluorescence microscopy, claudin-2 was localized mostly to the junctional plasma membrane in control Caco-2 cells (Fig. 8A). Starvation resulted in a progressive decrease of claudin-2 localization at the junctional membrane and an increased presence in the cytoplasm. Furthermore, the claudin-2 protein present in the cytoplasm showed colocalization with the lysosomal marker LAMP2 (Fig. 8A), suggesting the presence of claudin-2 within the lysosomes. Immunostaining of another TJ protein, occludin, revealed the persistent presence of occludin on the plasma membrane during starvation with no colocalization with LAMP2 (Fig. 8B), indicating that the starvation-induced targeting of TJ protein to the lysosomes is specific to claudin-2. To further confirm the colocalization and association of claudin-2 with the lysosomes, we immunoprecipitated the lysosomal fraction using lysosomal marker LAMP2 antibody and probed the immunoprecipitate for the presence of claudin-2. As shown in Fig. 9, claudin-2 protein levels in LAMP2 immunoprecipitates were found to be increased during the early starvation period, indicating an increased association of claudin-2 with lysosomes during early starvation. Claudin-2 protein levels were reduced toward the late starvation period as the total claudin-2 protein levels went down (indicating claudin-2 degradation) during that period. Therefore, these morphological and biochemical observations suggest that induction of autophagy leads to lysosomal delivery and subsequent degradation of claudin-2.
FIGURE 8.
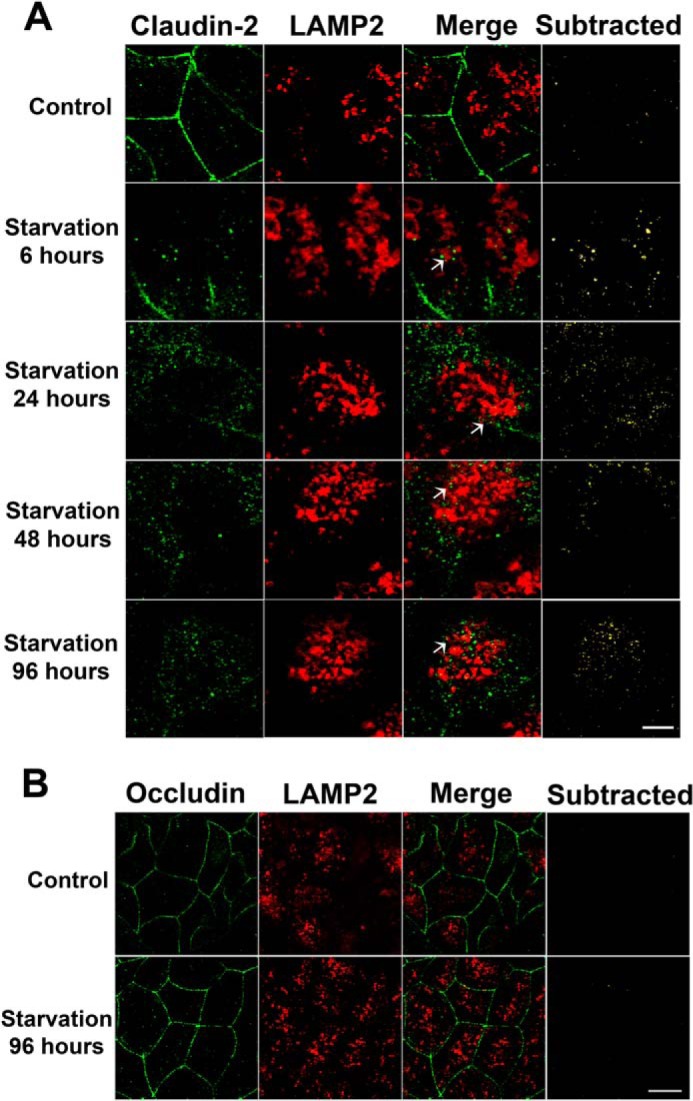
Claudin-2 is targeted to lysosomes during starvation. A, confocal immunofluorescence of claudin-2 shows loss of claudin-2 (green) staining from the membrane and colocalization with the lysosomal marker LAMP2 (red; yellow in Merge panels, arrows) during starvation. The subtracted panels show only the colocalization signal. Scale bar = 2.5 μm. B, occludin (green) showed a persistent presence on the membrane and no colocalization with LAMP2 (red) during starvation. Scale bar = 5 μm.
FIGURE 9.

Increased association of claudin-2 with lysosomes during starvation. Coimmunoprecipitation studies showed an increased presence of claudin-2 in lysosomal marker LAMP2 immunoprecipitates (IP) during early starvation. The negative control (-ve con) shows immunoprecipitation with control IgG. The densitometry analysis is shown as the ratio of claudin-2:LAMP2 expression. *, p < 0.01 versus control.
Starvation Enhances the TJ Barrier in a Claudin-2-dependent Manner in MDCK Cells
To examine whether autophagy-induced claudin-2 degradation and enhancement in the TJ barrier extend to other epithelial cell types and are not limited to Caco-2 cells, we conducted starvation experiments in MDCK cells. MDCK is a widely used model polar epithelium that has two distinct strains in part on the basis of claudin-2 expression. MDCK I cells do not have claudin-2 and, therefore, have very high TER, whereas MDCK II cells have high claudin-2 expression and have low TER (34, 35). Starvation markedly increased TER in claudin-2-expressing MDCK II cells, similar to Caco-2 cells (Fig. 10A). Starvation also significantly reduced the dilution potential (data not shown) and the ratio of permeability of sodium (PNa) to chloride (PCl) of MDCK II cells (Fig. 10B). Consistent with the starvation-induced reduction in small-sized solute permeability in Caco-2 cells, starvation decreased small-sized molecule urea flux but not large-sized solute inulin flux in MDCK II cells (Fig. 10, C and D). Starvation also significantly reduced claudin-2 protein levels in MDCK II cells (Fig. 11A), and claudin-2 was colocalized to the lysosomal marker LAMP-2 during starvation (Fig. 11B). We further examined the induction of autophagy by starvation and its effect on the TJ barrier in MDCK II cells. Confocal immunofluorescence microscopy detected a punctate (autophagosomal) staining pattern of LC3 in starved MDCK II cells (Fig. 11C). The mTOR inhibitors rapamycin and PP242 increased the TER of MDCK II cells to levels comparable with the increase caused by starvation (Fig. 11D), and the autophagy inhibitors bafilomycin A, chloroquine, and wortmannin inhibited the starvation-induced increase in TER of MDCK II cells (Fig. 11E). Starvation did not cause an increase in TER in claudin-2-deficient MDCK I cells. In fact, there was a reduction in TER after starvation. Also, the ratio of permeability of sodium (PNa) to chloride (PCl) of MDCK I cells showed a minimal reduction after starvation (data not shown). These data confirm that the starvation-induced autophagy enhancement of the TJ barrier also extends to other cell types and is dependent on claudin-2 degradation.
FIGURE 10.

Starvation enhances the epithelial barrier function of filter-grown MDCK II monolayers. A, filter-grown MDCK II monolayers, when incubated in starvation medium, show an increase in TER over the normally fed control group (*, p < 0.01). B, starvation changed TJ ion selectivity and reduced the ratio of the permeability of Na+ to Cl−, as calculated from the dilution potentials and the Goldman-Hodgkin-Katz equation, detailed under “Experimental Procedures” (*, p < 0.001 versus control). C and D, starvation reduced the flux of small solute urea (molecular radius, 2.9 Å) (C; *, p < 0.01 versus control) but did not affect the paracellular flux of inulin (molecular radius, 15 Å, D) (flux measured after 96 h of starvation).
FIGURE 11.
Starvation induces autophagy and enhances the TJ barrier in a claudin-2-dependent manner in MDCK II cells. A, in a Western blot analysis, starvation reduced the claudin-2 protein level (representation of three blots, 96 h of starvation) (*, p < 0.01 versus control). B, confocal immunofluorescence of claudin-2 shows loss of claudin-2 (green) staining from the membrane and colocalization with the lysosomal marker LAMP2 (red, arrows). Shown is a representation of 96 h of starvation. Scale bar = 5 μm. C, confocal immunofluorescence for LC3 staining in starved MDCK II cells showed cytoplasmic punctum formation. Scale bar = 5 μm. Shown is a representation of 48 h of starvation. D, incubation of MDCK II cells in normal medium with the mTOR inhibitors rapamycin (RAPA) and PP242 (500 nm) increased the TER, comparable with cells in starvation medium. E, incubation of MDCK II cells in starvation medium with the autophagy inhibitors bafilomycin A (BAF-A), chloroquine (CHQ), and wortmannin (WORT) significantly inhibited the increase in TER caused by starvation alone. *, p < 0.01 versus all other groups.
Claudin-2 Depletion Enhances TJ Barrier Function in Caco-2 and MDCK II Cells
As an alternative approach to confirm that claudin-2 degradation is a key determinant of changes in TJ barrier function during starvation, claudin-2 expression was knocked down using claudin-2 siRNA in Caco-2 and MDCK II cell monolayers. Claudin-2 siRNA-targeted Caco-2 and MDCK II cells showed an increase in TER (Fig. 12, B and E, respectively) and a reduction in urea flux (Fig. 12, C and F, respectively) compared with the respective control non-target siRNA-treated cells. Therefore, claudin-2 depletion alone, independent of starvation, was found to be sufficient for an increase in TER and a reduction in urea flux. These data further suggest that claudin-2 degradation is a key determinant for the enhancement of TJ barrier function during starvation.
FIGURE 12.

Claudin-2 depletion enhances TJ barrier function in Caco-2 and MDCK II cells. Claudin-2 siRNA transfection led to a significant decrease in claudin-2 protein expression in Caco-2 and MDCK II cells (A and D, respectively, Western blot). *, p < 0.01 versus NT siRNA cells. Claudin-2 siRNA transfection caused an increase in the TER of Caco-2 (B) and MDCK II (E) cells. *, p < 0.01 versus NT siRNA cells. Claudin-2 siRNA transfection also caused a reduction in urea flux in Caco-2 (C) and MDCK II cells (F). *, p < 0.01 versus NT siRNA cells. Shown are representations of 96 h post-transfection.
DISCUSSION
The intestinal epithelial TJ barrier plays an important role in maintaining intestinal homeostasis. Defects in the epithelial TJ barrier contribute to the development of intestinal inflammation by allowing host immune system access to luminal antigens and microbes (1–3). Emerging evidence shows autophagy to be a part of the complex pathogenesis of intestinal disorders. In particular, defective autophagy, leading to impaired immune responses, microbial sensing, destruction, and clearance, has been proposed to be a part of the pathogenesis of Crohn disease (12–15). However, nothing is known about how autophagy regulates intestinal epithelial barrier function that act as the first line of host defense against intestinal luminal antigens and is an important component of innate immunity. In this study, we investigated the role of autophagy in intestinal epithelial TJ barrier function by using an established model of starvation-induced autophagy. Our data show that starvation-induced autophagy leads to an enhancement in TJ barrier function with a reduction in paracellular permeability. Starvation-induced autophagy led to an increase in Caco-2 and MDCK II TER and a reduction in the paracellular flux of small-sized molecules. Inhibition of autophagy prevented starvation-induced enhancement in the Caco-2 and MDCK II TJ barrier.
We confirmed the induction of autophagy during starvation by detecting LC3 protein expression with or without the lysosomal V-ATPase inhibitor bafilomycin A. During autophagic flux, LC3-II present on the inner membrane of the autophagosome is degraded, whereas LC3-II present on the outer membrane of the autophagosome is recycled to the cytoplasm. During long-term starvation, this process leads to a decrease in total LC3 protein in addition to the increased LC3-II/I ratio. Furthermore, we demonstrated the accumulation of LC3-II in the presence of bafilomycin A in the starvation media. Our results are consistent with the induction of autophagy reported previously (36, 37). The starvation-induced enhancement in the Caco-2 TJ barrier was reproduced by induction of autophagy with rapamycin and PP242 in nutrient-fed cells. Conversely, genetic inhibition of autophagy by ATG16L1 and ATG7 siRNA transfection or pharmacological inhibition of autophagy with bafilomycin A, wortmannin, and chloroquine prevented the starvation-induced increase in the Caco-2 TJ barrier.
In our study, the autophagy-induced enhancement in the TJ barrier was limited to a paracellular marker having a small molecular size (urea; molecular radius, 2.9 Å) and ions. The transepithelial flux of large-sized paracellular probes, including mannitol (molecular radius, 4.1 Å), l-glucose (molecular radius, 4.3 Å), inulin (molecular radius, 15 Å), and 10-kD dextran (molecular radius, 23 Å) was not affected. The paracellular flux data are consistent with the decrease in claudin-2 protein expression and a reduced dilution potential and PNa/PCl ratio during starvation. The intestinal epithelial TJ barrier is cation-selective (38), and claudin-2 has been shown to be an integral component of the TJ pore pathway, which is responsible for the flux of cations and small solutes with a molecular radius of <4 Å (22, 39). In fact, exogenous expression of claudin-2 causes the epithelial monolayer to be leakier with increased Na+ conductivity (35, 40). In our studies, a starvation-induced enhancement in the TJ barrier was also evident in claudin-2-expressing MDCK II cells but not in claudin-2-lacking MDCK I cells. Also, genetic or pharmacological inhibition of autophagy during starvation was found to prevent a starvation-induced reduction in claudin-2 protein level. Taken together, these data indicate that autophagy targets the small-size, cation-selective pore pathway in the apical TJ complex by selective lysosomal degradation of claudin-2 protein. The contribution of the non-charge-selective, large-size leak pathway to autophagy-mediated changes in the TJ barrier appears to be minimal because autophagy induction did not affect the flux of paracellular markers having a molecular radius of >4 Å. The leak pathway allows the flux of macromolecules with only a minor bearing on TER (18). Autophagy was found to markedly increase TER and to not have any effect on macromolecular permeability in this study. The claudin-2 dependence of the autophagy-mediated enhancement of the TJ barrier was further supported by the findings that overexpression of claudin-2 attenuated a starvation-induced enhancement in epithelial TJ barrier function (Fig. 7). Moreover, claudin-2 depletion alone was found to be sufficient to enhance TJ barrier function in Caco-2 and MDCK II cells (Fig. 12).
We demonstrated that, during starvation, claudin-2 is lost from the membrane junctional location and is targeted to lysosomes. Consistent with our data showing autophagy-induced targeting of claudin-2 to the lysosomes, constitutive internalization and recycling of claudin-2 and sorting to the lysosomal pathway have been reported to be regulated in part by the phosphorylation status of claudin-2 and by small GTPase (41, 42). In this study, autophagy induction in Caco-2 cells did not reduce the claudin-2 mRNA level (data not shown), implicating lysosomal degradation as a key determinant for the autophagy-induced reduction in claudin-2 protein expression. The mechanism of autophagy-induced claudin-2 targeting to the lysosomal pathway will be the subject of future studies. Several studies have shown that the inflamed intestinal mucosa in patients with active IBD has increased claudin-2 expression. Moreover, inflammatory cytokines whose levels are increased markedly in IBD patients, including TNF-α, IL-13, IL-17, and IL-6, cause an increase in claudin-2 expression and a claudin-2-dependent increase in TJ permeability (43–47). Therefore, the role of claudin-2 in intestinal pathological processes has been attributed, in part, to increases in intestinal TJ permeability. In addition, the increase in claudin-2 expression has been implicated to play a role in IBD-associated dysplasia and colitis-associated carcinogenesis by promoting cell proliferation and tumorigenicity (48, 49). Therefore, our findings are very important in view of defects in autophagy reported in IBD and autophagy regulation of paracellular permeability via claudin-2.
In conclusion, our data demonstrate, for the first time, a direct and profound role of autophagy in the regulation of paracellular TJ permeability. Our data indicate that autophagy enhances the intestinal TJ barrier by targeting the lysosomal degradation of the pore-forming TJ protein claudin-2.
Acknowledgments
We thank Shuhong Guo, Rana Al-Sadi, Manmeet Rawat, and Meghali Nighot for technical help. We also thank the Fluorescence Microscopy Shared Resource, University of New Mexico, for technical support.
This work was supported, in whole or in part, by NIDDK/National Institutes of Health Grants R01-DK-64165-01 (to T. M.) and KO1DK100562-01 (to P. N.). This work was also supported by a Veterans Affairs merit review grant from the VA Research Service (to T. M.) and by the University of New Mexico School of Medicine Research Allocation Committee (to P.N.).
- TJ
- tight junction
- IBD
- inflammatory bowel disease
- TER
- transepithelial electrical resistance
- MDCK
- Madin-Darby canine kidney
- mTOR
- mammalian target of rapamycin
- NT
- non-target.
REFERENCES
- 1. Ma T. Y., Anderson J. M. (2006) in Textbook of Gastrointestinal Physiology (Johnson L. R., ed) pp. 1559–1594, Elsevier Health Sciences, Philadelphia [Google Scholar]
- 2. Turner J. R. (2009) Intestinal mucosal barrier function in health and disease. Nat. Rev. Immunol. 9, 799–809 [DOI] [PubMed] [Google Scholar]
- 3. Arrieta M. C., Madsen K., Doyle J., Meddings J. (2009) Reducing small intestinal permeability attenuates colitis in the IL10 gene-deficient mouse. Gut 58, 41–48 [DOI] [PMC free article] [PubMed] [Google Scholar]
- 4. Arnott I. D., Kingstone K., Ghosh S. (2000) Abnormal intestinal permeability predicts relapse in inactive Crohn disease. Scand. J. Gastroenterol. 35, 1163–1169 [DOI] [PubMed] [Google Scholar]
- 5. Wyatt J., Vogelsang H., Hübl W., Waldhöer T., Lochs H. (1993) Intestinal permeability and the prediction of relapse in Crohn's disease. Lancet 341, 1437–1439 [DOI] [PubMed] [Google Scholar]
- 6. Levine B., Kroemer G. (2008) Autophagy in the pathogenesis of disease. Cell 132, 27–42 [DOI] [PMC free article] [PubMed] [Google Scholar]
- 7. Groulx J. F., Khalfaoui T., Benoit Y. D., Bernatchez G., Carrier J. C., Basora N., Beaulieu J. F. (2012) Autophagy is active in normal colon mucosa. Autophagy 8, 893–902 [DOI] [PMC free article] [PubMed] [Google Scholar]
- 8. Sakiyama T., Musch M. W., Ropeleski M. J., Tsubouchi H., Chang E. B. (2009) Glutamine increases autophagy under Basal and stressed conditions in intestinal epithelial cells. Gastroenterology 136, 924–932 [DOI] [PMC free article] [PubMed] [Google Scholar]
- 9. Hampe J., Franke A., Rosenstiel P., Till A., Teuber M., Huse K., Albrecht M., Mayr G., De La Vega F. M., Briggs J., Günther S., Prescott N. J., Onnie C. M., Häsler R., Sipos B., Fölsch U. R., Lengauer T., Platzer M., Mathew C. G., Krawczak M., Schreiber S. (2007) A genome-wide association scan of nonsynonymous SNPs identifies a susceptibility variant for Crohn disease in ATG16L1. Nat. Genet. 39, 207–211 [DOI] [PubMed] [Google Scholar]
- 10. Rioux J. D., Xavier R. J., Taylor K. D., Silverberg M. S., Goyette P., Huett A., Green T., Kuballa P., Barmada M. M., Datta L. W., Shugart Y. Y., Griffiths A. M., Targan S. R., Ippoliti A. F., Bernard E. J., Mei L., Nicolae D. L., Regueiro M., Schumm L. P., Steinhart A. H., Rotter J. I., Duerr R. H., Cho J. H., Daly M. J., Brant S. R. (2007) Genome-wide association study identifies new susceptibility loci for Crohn disease and implicates autophagy in disease pathogenesis. Nat. Genet. 39, 596–604 [DOI] [PMC free article] [PubMed] [Google Scholar]
- 11. Parkes M., Barrett J. C., Prescott N. J., Tremelling M., Anderson C. A., Fisher S. A., Roberts R. G., Nimmo E. R., Cummings F. R., Soars D., Drummond H., Lees C. W., Khawaja S. A., Bagnall R., Burke D. A., Todhunter C. E., Ahmad T., Onnie C. M., McArdle W., Strachan D., Bethel G., Bryan C., Lewis C. M., Deloukas P., Forbes A., Sanderson J., Jewell D. P., Satsangi J., Mansfield J. C., Wellcome Trust Case Control Consortium, Cardon L., Mathew C. G. (2007) Sequence variants in the autophagy gene IRGM and multiple other replicating loci contribute to Crohn's disease susceptibility. Nat. Genet. 39, 830–832 [DOI] [PMC free article] [PubMed] [Google Scholar]
- 12. Saitoh T., Fujita N., Jang M. H., Uematsu S., Yang B. G., Satoh T., Omori H., Noda T., Yamamoto N., Komatsu M., Tanaka K., Kawai T., Tsujimura T., Takeuchi O., Yoshimori T., Akira S. (2008) Loss of the autophagy protein Atg16L1 enhances endotoxin-induced IL-1β production. Nature 456, 264–268 [DOI] [PubMed] [Google Scholar]
- 13. Strisciuglio C., Duijvestein M., Verhaar A. P., Vos A. C., den Brink G. R., Hommes D. W., Wildenberg M. E. (2012) Impaired autophagy leads to abnormal dendritic cell-epithelial cell interactions. J. Crohns Colitis 7, 534–541 [DOI] [PubMed] [Google Scholar]
- 14. Wildenberg M. E., Vos A. C., Wolfkamp S. C., Duijvestein M., Verhaar A. P., Te Velde A. A., van den Brink G. R., Hommes D. W. (2012) Autophagy attenuates the adaptive immune response by destabilizing the immunologic synapse. Gastroenterology 142, 1493–1503.e6 [DOI] [PubMed] [Google Scholar]
- 15. Cooney R., Baker J., Brain O., Danis B., Pichulik T., Allan P., Ferguson D. J., Campbell B. J., Jewell D., Simmons A. (2010) NOD2 stimulation induces autophagy in dendritic cells influencing bacterial handling and antigen presentation. Nat. Med. 16, 90–97 [DOI] [PubMed] [Google Scholar]
- 16. Hollander D., Vadheim C. M., Brettholz E., Petersen G. M., Delahunty T., Rotter J. I. (1986) Increased intestinal permeability in patients with Crohn's disease and their relatives: a possible etiologic factor. Ann. Intern. Med. 105, 883–885 [DOI] [PubMed] [Google Scholar]
- 17. Buhner S., Buning C., Genschel J., Kling K., Herrmann D., Dignass A., Kuechler I., Krueger S., Schmidt H. H., Lochs H. (2006) Genetic basis for increased intestinal permeability in families with Crohn's disease: role of CARD15 3020insC mutation? Gut 55, 342–347 [DOI] [PMC free article] [PubMed] [Google Scholar]
- 18. Al-Sadi R., Khatib K., Guo S., Ye D., Youssef M., Ma T. (2011) Occludin regulates macromolecule flux across the intestinal epithelial tight junction barrier. Am. J. Physiol. Gastrointest. Liver Physiol. 300, G1054–64 [DOI] [PMC free article] [PubMed] [Google Scholar]
- 19. Hou J., Paul D. L., Goodenough D. A. (2005) Paracellin-1 and the modulation of ion selectivity of tight junctions. J. Cell Sci. 118, 5109–5118 [DOI] [PubMed] [Google Scholar]
- 20. Madara J. L., Stafford J., Barenberg D., Carlson S. (1988) Functional coupling of tight junctions and microfilaments in T84 monolayers. Am. J. Physiol. 254, G416–23 [DOI] [PubMed] [Google Scholar]
- 21. Shen L., Weber C. R., Raleigh D. R., Yu D., Turner J. R. (2010) Tight junction pore and leak pathways: a dynamic duo. Annu. Rev. Physiol. 73, 283–309 [DOI] [PMC free article] [PubMed] [Google Scholar]
- 22. Van Itallie C. M., Holmes J., Bridges A., Gookin J. L., Coccaro M. R., Proctor W., Colegio O. R., Anderson J. M. (2008) The density of small tight junction pores varies among cell types and is increased by expression of claudin-2. J. Cell Sci. 121, 298–305 [DOI] [PubMed] [Google Scholar]
- 23. Van Itallie C. M., Mitic L. L., Anderson J. M. (2011) Claudin-2 forms homodimers and is a component of a high molecular weight protein complex. J. Biol. Chem. 286, 3442–3450 [DOI] [PMC free article] [PubMed] [Google Scholar]
- 24. Kuma A., Hatano M., Matsui M., Yamamoto A., Nakaya H., Yoshimori T., Ohsumi Y., Tokuhisa T., Mizushima N. (2004) The role of autophagy during the early neonatal starvation period. Nature 432, 1032–1036 [DOI] [PubMed] [Google Scholar]
- 25. Ravikumar B., Vacher C., Berger Z., Davies J. E., Luo S., Oroz L. G., Scaravilli F., Easton D. F., Duden R., O'Kane C. J., Rubinsztein D. C. (2004) Inhibition of mTOR induces autophagy and reduces toxicity of polyglutamine expansions in fly and mouse models of Huntington disease. Nat. Genet. 36, 585–595 [DOI] [PubMed] [Google Scholar]
- 26. Feldman M. E., Apsel B., Uotila A., Loewith R., Knight Z. A., Ruggero D., Shokat K. M. (2009) Active-site inhibitors of mTOR target rapamycin-resistant outputs of mTORC1 and mTORC2. PLoS Biol. 7, e38. [DOI] [PMC free article] [PubMed] [Google Scholar]
- 27. Yamamoto A., Tagawa Y., Yoshimori T., Moriyama Y., Masaki R., Tashiro Y. (1998) Bafilomycin A1 prevents maturation of autophagic vacuoles by inhibiting fusion between autophagosomes and lysosomes in rat hepatoma cell line, H-4-II-E cells. Cell Struct. Funct. 23, 33–42 [DOI] [PubMed] [Google Scholar]
- 28. Klionsky D. J., Elazar Z., Seglen P. O., Rubinsztein D. C. (2008) Does bafilomycin A1 block the fusion of autophagosomes with lysosomes? Autophagy 4, 849–950 [DOI] [PubMed] [Google Scholar]
- 29. Rubinsztein D. C., Gestwicki J. E., Murphy L. O., Klionsky D. J. (2007) Potential therapeutic applications of autophagy. Nat. Rev. Drug Discov. 6, 304–312 [DOI] [PubMed] [Google Scholar]
- 30. Blommaart E. F., Krause U., Schellens J. P., Vreeling-Sindelárová H., Meijer A. J. (1997) The phosphatidylinositol 3-kinase inhibitors wortmannin and LY294002 inhibit autophagy in isolated rat hepatocytes. Eur. J. Biochem. 243, 240–246 [DOI] [PubMed] [Google Scholar]
- 31. Mizushima N., Yoshimori T., Levine B. (2010) Methods in mammalian autophagy research. Cell 140, 313–326 [DOI] [PMC free article] [PubMed] [Google Scholar]
- 32. Komatsu M., Waguri S., Ueno T., Iwata J., Murata S., Tanida I., Ezaki J., Mizushima N., Ohsumi Y., Uchiyama Y., Kominami E., Tanaka K., Chiba T. (2005) Impairment of starvation-induced and constitutive autophagy in Atg7-deficient mice. J. Cell Biol. 169, 425–434 [DOI] [PMC free article] [PubMed] [Google Scholar]
- 33. Walczak M., Martens S. (2013) Dissecting the role of the Atg12-Atg5-Atg16 complex during autophagosome formation. Autophagy 9, 424–425 [DOI] [PMC free article] [PubMed] [Google Scholar]
- 34. Barker G., Simmons N. L. (1981) Identification of two strains of cultured canine renal epithelial cells (MDCK cells) which display entirely different physiological properties. Q. J. Exp. Physiol. 66, 61–72 [DOI] [PubMed] [Google Scholar]
- 35. Furuse M., Furuse K., Sasaki H., Tsukita S. (2001) Conversion of zonulae occludentes from tight to leaky strand type by introducing claudin-2 into Madin-Darby canine kidney I cells. J. Cell Biol. 153, 263–272 [DOI] [PMC free article] [PubMed] [Google Scholar]
- 36. Mizushima N., Yoshimori T. (2007) How to interpret LC3 immunoblotting. Autophagy 3, 542–545 [DOI] [PubMed] [Google Scholar]
- 37. Scherz-Shouval R., Weidberg H., Gonen C., Wilder S., Elazar Z., Oren M. (2010) p53-dependent regulation of autophagy protein LC3 supports cancer cell survival under prolonged starvation. Proc. Natl. Acad. Sci. U.S.A. 107, 18511–18516 [DOI] [PMC free article] [PubMed] [Google Scholar]
- 38. Anderson J. M., Van Itallie C. M. (2009) Physiology and function of the tight junction. Cold Spring Harb. Perspect. Biol. 1, a002584. [DOI] [PMC free article] [PubMed] [Google Scholar]
- 39. Van Itallie C. M., Holmes J., Bridges A., Anderson J. M. (2009) Claudin-2-dependent changes in noncharged solute flux are mediated by the extracellular domains and require attachment to the PDZ-scaffold. Ann. N.Y. Acad. Sci. 1165, 82–87 [DOI] [PMC free article] [PubMed] [Google Scholar]
- 40. Amasheh S., Meiri N., Gitter A. H., Schöneberg T., Mankertz J., Schulzke J. D., Fromm M. (2002) Claudin-2 expression induces cation-selective channels in tight junctions of epithelial cells. J. Cell Sci. 115, 4969–4976 [DOI] [PubMed] [Google Scholar]
- 41. Dukes J. D., Whitley P., Chalmers A. D. (2012) The PIKfyve inhibitor YM201636 blocks the continuous recycling of the tight junction proteins claudin-1 and claudin-2 in MDCK cells. PLoS ONE 7, e28659. [DOI] [PMC free article] [PubMed] [Google Scholar]
- 42. Lu R., Johnson D. L., Stewart L., Waite K., Elliott D., Wilson J. M. (2014) Rab14 regulation of claudin-2 trafficking modulates epithelial permeability and lumen morphogenesis. Mol. Biol. Cell 25, 1744–1754 [DOI] [PMC free article] [PubMed] [Google Scholar]
- 43. Al-Sadi R., Ye D., Boivin M., Guo S., Hashimi M., Ereifej L., Ma T. Y. (2014) Interleukin-6 modulation of intestinal epithelial tight junction permeability is mediated by JNK pathway activation of claudin-2 gene. PLoS ONE 9, e85345. [DOI] [PMC free article] [PubMed] [Google Scholar]
- 44. Suzuki T., Yoshinaga N., Tanabe S. (2011) Interleukin-6 (IL-6) regulates claudin-2 expression and tight junction permeability in intestinal epithelium. J. Biol. Chem. 286, 31263–31271 [DOI] [PMC free article] [PubMed] [Google Scholar]
- 45. Kinugasa T., Sakaguchi T., Gu X., Reinecker H. C. (2000) Claudins regulate the intestinal barrier in response to immune mediators. Gastroenterology 118, 1001–1011 [DOI] [PubMed] [Google Scholar]
- 46. Heller F., Florian P., Bojarski C., Richter J., Christ M., Hillenbrand B., Mankertz J., Gitter A. H., Bürgel N., Fromm M., Zeitz M., Fuss I., Strober W., Schulzke J. D. (2005) Interleukin-13 is the key effector Th2 cytokine in ulcerative colitis that affects epithelial tight junctions, apoptosis, and cell restitution. Gastroenterology 129, 550–564 [DOI] [PubMed] [Google Scholar]
- 47. Mankertz J., Amasheh M., Krug S. M., Fromm A., Amasheh S., Hillenbrand B., Tavalali S., Fromm M., Schulzke J. D. (2009) TNFα up-regulates claudin-2 expression in epithelial HT-29/B6 cells via phosphatidylinositol-3-kinase signaling. Cell Tissue Res. 336, 67–77 [DOI] [PubMed] [Google Scholar]
- 48. Weber C. R., Nalle S. C., Tretiakova M., Rubin D. T., Turner J. R. (2008) Claudin-1 and claudin-2 expression is elevated in inflammatory bowel disease and may contribute to early neoplastic transformation. Lab. Invest. 88, 1110–1120 [DOI] [PMC free article] [PubMed] [Google Scholar]
- 49. Dhawan P., Ahmad R., Chaturvedi R., Smith J. J., Midha R., Mittal M. K., Krishnan M., Chen X., Eschrich S., Yeatman T. J., Harris R. C., Washington M. K., Wilson K. T., Beauchamp R. D., Singh A. B. (2011) Claudin-2 expression increases tumorigenicity of colon cancer cells: role of epidermal growth factor receptor activation. Oncogene 30, 3234–3247 [DOI] [PMC free article] [PubMed] [Google Scholar]