

Background: Insulin is a model amyloidogenic protein.
Results: Limited proteolysis of bovine insulin dimers with pepsin releases highly fibrillation-prone two-chain fragments.
Conclusion: Dynamics of the disulfide-bonded N-terminal fragments of A- and B-chains may strongly contribute to insulin amyloidogenesis.
Significance: Highly aggregation-prone regions of protein molecules may be revealed by partial proteolysis of the native state.
Keywords: Amyloid, Disulfide, Insulin, Kinetics, Proteolysis, Pepsin
Abstract
Proteases play a well recognized role in the emergence of highly aggregation-prone protein fragments in vivo, whereas in vitro limited proteolysis is often employed to probe different phases of amyloidogenic pathways. Here, we show that addition of moderate amounts of pepsin to acidified bovine insulin at close to physiological temperature results in an abrupt self-assembly of amyloid-like fibrils from partially digested insulin fragments. Biochemical analysis of the pepsin-induced fibrils implicates peptide fragments (named H) consisting of the 13 or 15 N-terminal residues of the A-chain and 11 or 13 N-terminal residues of the B-chain linked by the disulfide bond between Cys-7A–Cys-7B as the main constituents. There are up to eight pepsin-cleavage sites remaining within the double chain peptide, which become protected upon fast fibrillation unless concentration of the enzyme is increased resulting in complete digestion of insulin. Controlled re-association of H-peptides leads to “explosive” fibrillation only under nonreducing conditions implying the key role of the disulfide bond in their amyloidogenicity. Such re-assembled amyloid is similar in terms of morphology and infrared features to typical bovine insulin fibrils, although it lacks the ability to seed the intact protein.
Introduction
The phenomenon of self-association of misfolded protein molecules and the formation of amyloid fibrils are extensively studied due to their biological implications (1, 2). So far, dozens of human disorders, including Alzheimer disease and diabetes mellitus type II, have been linked to in vivo amyloid deposits assembled from sequentially unrelated protein precursors. Meanwhile, there is the growing evidence that amyloid fibrils may be biologically functional, as well (3–5). Nowadays, it is widely accepted that amyloidogenesis is a generic property of proteins and polypeptides which arises from main chain interactions (6). From this perspective, the role of side chains, i.e. amino acid sequence, is important in defining amyloid structural details and determining the propensities to form fibrils by individual proteins. Therefore, amyloidogenic tendencies of whole protein molecules are often dramatically different from those of their fragments. For example, an unstructured hydrophobic peptide fragment is more likely to be aggregation-prone than its parent folded globular protein. This situation is the background for the intimate links often found between formation of amyloid fibrils in vivo and local activity of proteolytic enzymes necessary to excise a highly amyloidogenic fragment from the precursor protein that itself may be refractory to aggregation. According to such a scenario, amyloid β peptide, the main constituent of cerebral amyloid plaques characterizing Alzheimer's disease, is released by proteolytic cleavage of amyloid β precursor protein (7–9). While there are many examples of the protease involvement in the secretion of amyloidogenic peptides in vivo (e.g. (10, 11)), certain proteases appear to play the antagonistic role by digesting protein fragments susceptible to fibrillation (8, 12–14). Partial enzymatic degradation of α-lactalbumin in vitro has been shown to produce fragments self-assembling into amyloid-like nanotubes (15–17). Similar observations of pepsin-triggered release of peptides with the increased propensities to aggregate have been made for hen egg lysozyme (18) and horse heart apomyoglobin (19). Because it was found that amyloid fibrils are more resistant to enzymatic degradation than other conformational states of a protein (e.g. (20)), proteases have been frequently employed in amyloid research. Some of these applications include purification of fibrils by a selective degradation of protease-sensitive amorphous aggregates (21), discrimination between benign cellular prion protein and its pathogenic prion isoforms (22), and testing overall amyloid stability (23). The approach based on susceptibility to proteases proved particularly insightful in several in vitro studies probing different stages of protein fibrillation (24) or mapping core regions of mature amyloid structures (25–28).
In the acidic environment and in the presence of salt, insulin readily forms amyloid fibrils in vitro (29–31), although its fibrillation in vivo is rare and is not considered to be pathogenic per se (32). The hormone is a product of endopeptidase cleavage of proinsulin (33, 34), which is markedly less prone to aggregation than insulin (35). Several fascinating aspects of polymorphism of insulin fibrils (36–38), especially in the context of the structural peculiarities of the insulin monomer, have been attracting much attention. The initial aim of this work was to evaluate how partial enzymatic proteolysis of insulin would perturb its fibrillation pathway. Having considered the high activity of pepsin at low pH values where insulin aggregation typically takes place, we selected the enzyme for in situ digestion of insulin upon fibrillation. Unexpectedly, we observed that within a certain range of enzyme concentration fibrillation kinetics acquire “explosive” characteristics, thereby suggesting that mild digestion with pepsin releases fragments with amyloidogenic propensities much stronger than that of insulin itself.
EXPERIMENTAL PROCEDURES
Materials
Insulin from bovine (BI)3 pancreas, pepsin from porcine gastric mucosa (nominal activity >2500 units/mg), tris(2-carboxyethyl) phosphine hydrochloride (TCEP), thioflavin T (ThT), and bovine hemoglobin for pepsin activity assay were all from Sigma. D2O (“99.8 atom % D” grade) and DCl used for pD adjustment (35 weight % DCl solution in D2O, 99 atom % D) were from ARMAR Chemicals, Switzerland.
Sample Preparation
Fresh stock solutions of 4 mg/ml pepsin (concentration checked spectrophotometrically) in 0.1 m NaCl, pH 1.9 (adjusted with HCl), were prepared prior to experiments and kept on ice. Enzyme activity was determined as 3148 ± 58 units per mg of protein according to hemoglobin-based spectrophotometric assay described elsewhere (39). Insulin amyloid fibrils ([BI]) for seeding experiments were prepared from 1% w/v BI in 0.1 m NaCl, pH 1.9, and incubated for 48 h at 60 °C without agitation. Alternatively, solvent-exchanged insulin fibrils ([BI]D) were prepared through a similar procedure with D2O replacing H2O, and the acidification to pD 1.9 (uncorrected pH-meter readout) was carried out using DCl.
Kinetics of Spontaneous Fibrillation in the Presence of Pepsin
For the preliminary kinetic experiment reported in Fig. 1, freshly prepared samples containing 1% w/v BI in 0.1 m NaCl, 25 μm ThT, pH 1.9, and specified concentrations of pepsin (added directly before measurements in small portions of acidified 4 mg/ml enzyme solution in 0.1 m NaCl) were swiftly mixed and transferred to a 96-well black plate. Aggregation of insulin samples at 37 °C was monitored by measuring intensity of ThT fluorescence using Fluoroskan Ascent FL fluorometer (from Thermo) equipped with a pair of λex 440/λem 485-nm optical filters and a 96-well Microfluor 1 U-bottom plate (Thermo) and covered with dedicated transparent adhesive foil (40). Before each measurement, the plate was shaken at 300 rpm and 3 mm amplitude for 10 s. To assess reproducibility of aggregation kinetics, six microplate wells were filled with identical 150-μl portions of each sample for parallel measurements.
FIGURE 1.
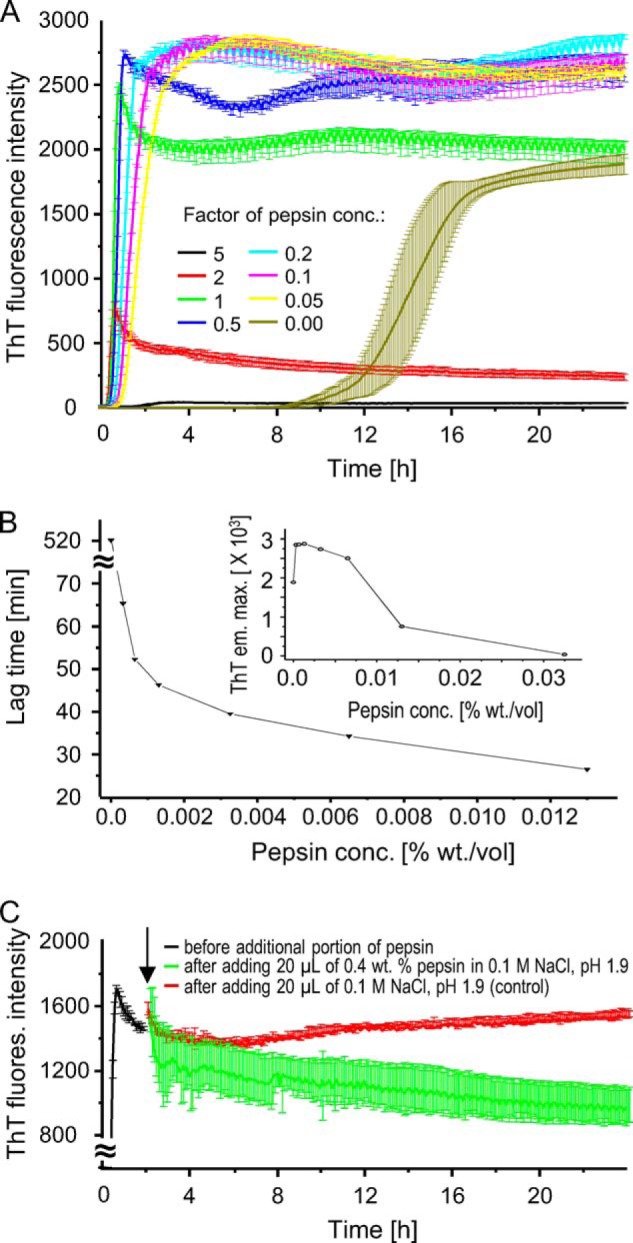
Kinetics of amyloid fibril formation (at 37 °C) in solutions containing 1% w/v BI in 0.1 m NaCl, pH 1.9, and varying concentrations of pepsin. A, kinetic traces corresponding to time evolution of ThT (25 μm) fluorescence intensity; different colors indicate several pepsin concentrations (the concentration of 0.0065 w/v % multiplied by the specified factor). The error bars correspond to standard deviations between six simultaneously probed wells. B, dependence of the lag time of fibrillation on pepsin concentration- based on data from A. The effect of the enzyme concentration on ThT fluorescence intensity maximum (reached at a certain point in time during the aggregation) is shown in the inset. C, addition of concentrated pepsin to fibrils already formed in the presence of smaller enzyme doses accelerates the decay of ThT fluorescence. After an initial 2 h of ThT (15 μm) fluorescence-monitored fibrillation induced in the presence of 0.0065% w/v pepsin (other conditions as in A), additional portions of concentrated pepsin in 0.1 m NaCl, pH 1.9, were added to the microplate wells to the final enzyme concentration of 0.047 w/v % before the measurement restarted (green). In a parallel control experiment, the same amounts of the acidified NaCl solution without pepsin were added (red).
Comparative Kinetics of Insulin Fibrillation in the Presence of Pepsin and Seeds
For kinetic experiments reported in Figs. 2A and 8E, fresh samples containing 1% w/v BI in 0.1 m NaCl, 30 μm ThT, pH 1.9, were prepared, to which sonicated amyloid seeds ([BI] or [H], as specified therein) were added prior to measurements at the final 100:1 native insulin/amyloid mass ratio. Samples were mixed, pipetted in triplicate on a 96-well Microfluor 1 U-bottom plate (Thermo), and kinetic measurements at 40 °C and 300 rpm on Ascent 2.6 microplate fluorescence reader (Thermo) followed.
FIGURE 2.
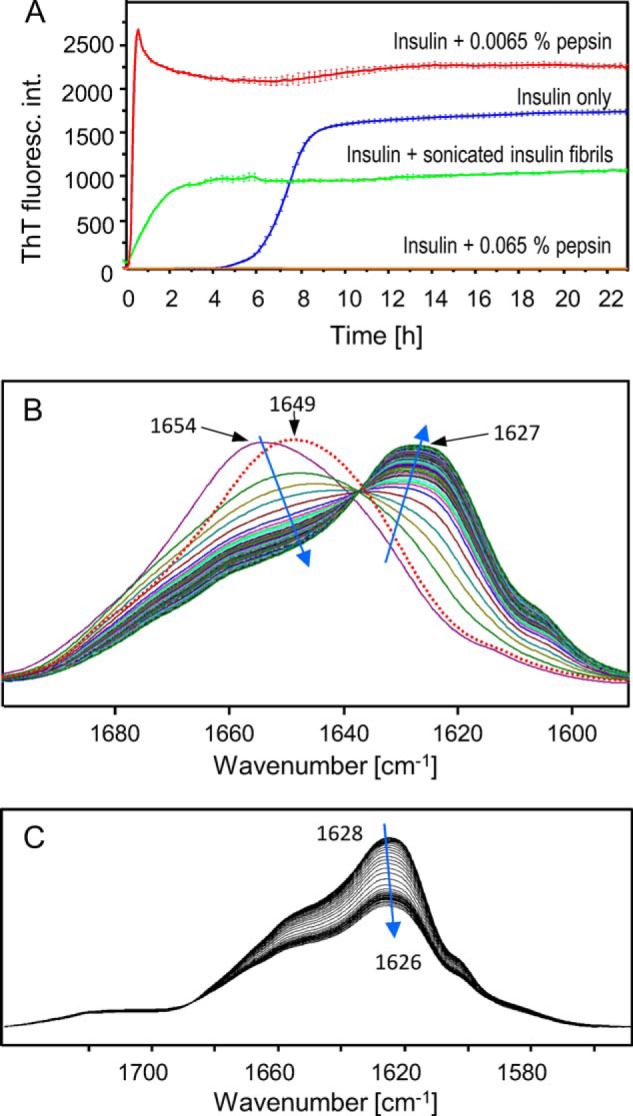
A, comparison of fibrillation kinetics of 1% w/v BI in the presence of 0.0065% w/v pepsin (red) or 0.065% w/v pepsin (orange), spontaneous de novo BI aggregation in the absence of pepsin and seeds (blue), and fibrillation induced by preformed and sonicated [BI] seeds at 1:100 mass ratio (green). In each case, BI was dissolved in 0.1 m NaCl, pH 1.9, and aggregation was monitored by ThT fluorescence at 40 °C. B, time-lapse FTIR spectra (amide I′ band region) of 1% w/v BI dissolved in 0.1 m NaCl, D2O, pD 1.9 in the presence of 0.0065% w/v pepsin. The shown spectra were collected at 40 °C every 23 min for the period of 24 h. Directions of spectral changes are indicated with blue arrows; the overlaid red dotted line corresponds to the spectrum of dissolved native BI of nearly the same sample composition but in the absence of pepsin after a 24-h-long incubation at 40 °C. C, time-lapse FTIR spectra collected over a 24-h period of ex situ pepsin-induced fibrils (2.5-h incubation of 1 w/v % BI in 0.0065% w/v pepsin, 0.1 m NaCl, D2O, pD 1.9) undergoing gradual proteolysis after being subsequently subjected to 10 times higher (0.065% w/v) enzyme concentration.
FIGURE 8.

Characteristics of fibrils from re-associated H-fragments of BI. A, ThT-monitored kinetics of re-association of H-peptides (1% w/v) in 0.1 m NaCl, pH 1.9, 40 °C in the absence (black line) or in the presence of reducing agent, 20 mm TCEP (red line). B, time-lapse ATR-FTIR spectra (amide I band region) of [H] amyloid being re-associated for different periods of time at pH 1.9 from fully dissolved H monomers (at 1 w/v % concentration) formed earlier at pH 10.5. C, amplitude of AFM image of re-associated H-fibrils with overlaid cross-sections according to the height image. D, ATR-FTIR spectra (amide I band region) of H-fibrils before (formed from BI in situ in the presence of pepsin) and after reassociation and in each case before and after sonication. Overlaid are spectra of insulin fibrils formed in H2O ([BI]) and D2O ([BI]D). E, effects of different preparations of H-fibrils used as seeds on the kinetics of ThT-probed insulin fibrillation at 40 °C (seeds added at 1:100 mass ratio to native BI dissolved at 1% w/v in 0.1 m NaCl, pH 1.9). F, ATR-FTIR spectra of daughter fibrils obtained through seeding of BI with as-grown H-fibrils ([BI]H) and reassociated H-fibrils ([BI]reasocH).
Kinetic FTIR Measurements
Freshly prepared and mixed sample of 1% w/v BI in 0.1 m NaCl in D2O, containing 0.0065% w/v of pepsin, pD 1.9 (uncorrected pH-meter readout), was swiftly transferred to a CaF2 transmission cell equipped with a 0.05-mm Teflon spacer. During measurements, the temperature in the cell (40 °C) was controlled through a dedicated Peltier system. All time-lapse FTIR spectra were collected on a Nicolet iS50 FTIR spectrometer. Typically, for a single spectrum 16 interferograms of 2 cm−1 resolution were co-added. During measurements, the sample chamber was continuously purged with CO2-free dry air. From each sample's spectrum the corresponding buffer and water vapor spectra were subtracted. Baseline correction was performed with GRAMS software (Thermo). All further experimental details were the same as specified earlier (40).
Circular Dichroism Measurements
A 3-mg portion of pepsin-induced [H] fibrils (subsequently centrifuged and washed with excess of water) was suspended in 3 ml of acidified (to pH 1.9) H2O and briefly sonicated. A 75-μl volume of this suspension was diluted with additional 3 ml of H2O, pH 1.9, before being placed in a 1-cm quartz cuvette for initial far-UV CD measurement. Subsequently, the pH of the sample was raised to 10.5 by a gradual addition of diluted NaOH to the intensively agitated sample. Once the desired pH was reached and stabilized, the sample was left for 10 min before the ensuing CD measurement. Additional spectra were collected after gradual re-acidification of the sample with diluted HCl first to pH 7.0 and then 1.9. All far UV-CD measurements were carried out at 40 °C by accumulation of five independent spectra on Jasco J-815 S spectropolarimeter (Jasco, Japan) as specified in our previous work (40).
Chromatographic Separations
The procedure described in this section was employed for RP-HPLC separations reported in Fig. 4 and Table 1. 10-μl portions of each insulin solution, as well as of samples formed in the course of aggregation in the presence of different pepsin concentrations, were collected from the wells immediately after the ThT fluorescence, and measurements were completed. The aggregates were solubilized by adding 90 μl of 6.7 m guanidine hydrochloride (GdnHCl) in 0.1 m sodium citrate, pH 1.9, which also immediately quenched the remaining pepsin activity. Clear samples were subsequently centrifuged for 5 min at 13,000 × g and injected onto the column. To analyze insoluble fractions formed in the presence of 0.0065% w/v pepsin, aggregate suspensions were collected after a 20-h-long incubation and subsequently centrifuged at 13,000 × g for 10 min followed by washing with an excess of 0.1 m NaCl, pH 1.9. This procedure was repeated twice. Subsequently, 10-μl portions of aggregates were solubilized by adding 90 μl of 6.7 m GdnHCl in 0.1 m sodium citrate, pH 1.9, and centrifuged for 5 min at 13,000 × g. The obtained clear solution was then injected on the column. All RP-HPLC separations were performed on the Ultimate 3000 system (Thermo) using a Supelco Sil LC-18-DB 4.6 × 250 mm column (Sigma). Two buffers were applied as follows: A, 0.1% TFA; B, 0.07% TFA, 80% acetonitrile (all v/v), and two linear gradient steps were programmed as follows: 0.0–5.0 min at 0% B and 5.0–20.0 min 0–60% B; the flow rate was maintained at 1 ml/min, and the spectrophotometric detection was carried out at 220 and 280 nm.
FIGURE 4.
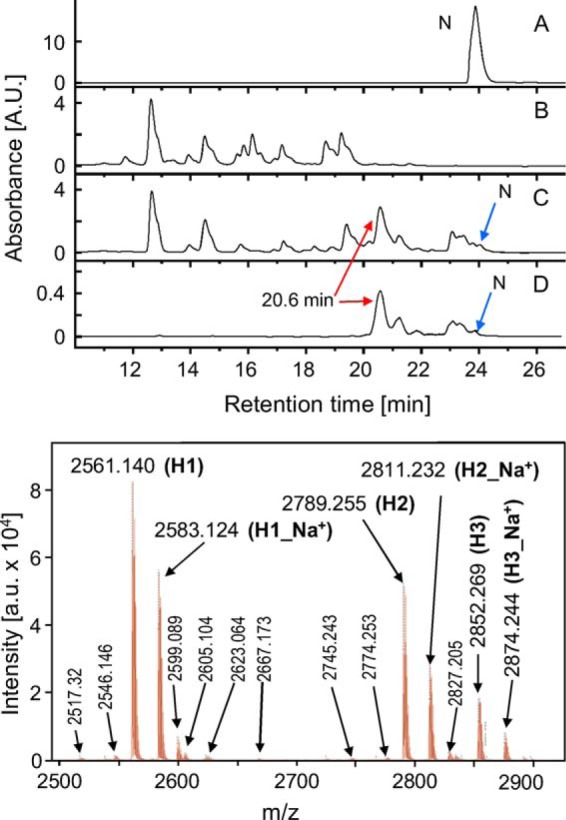
Top panel, A, RP-HPLCs of GdnHCl-dissolved native BI; B, 1% w/v BI subjected to 24 h/40 °C incubation in 0.1 m NaCl and extensively digesting 0.065% w/v pepsin; C, product of 24 h/40 °C aggregation of 1% w/v BI in 0.1 m NaCl and 0.0065% w/v pepsin; and D, centrifuged fibrils formed under the same conditions. The fraction subsequently characterized by MS and Edman degradation is marked with a red arrow. Bottom panel, MALDI-TOF spectrum corresponding to the RP-HPLC fraction of the main component of fibrils formed in the presence of 0.0065% w/v pepsin (peak marked in D with a red arrow), retention time is 20.6 min. A.U., arbitrary units.
TABLE 1.
Assignment of MS peaks to three main components of H-fibrils
Calculated masses of peptide fragments include reduced Cys residues; hence, for mass calculation of H-peptides with the two disulfide bridges intact, the mass of four hydrogen atoms is subtracted. In Edman analysis results, X denotes cysteine residues that cannot be detected in unalkylated form.
| Peak label | MS peak | Relative intensity | A-chain fragment |
B-chain fragment |
||
|---|---|---|---|---|---|---|
| Sequence | Calculated mass | Sequence | Calculated mass | |||
| Da | ||||||
| H1 | 2561.140 | +++ | GIVEQCCASVCSL | 1311.55- (3 × H) | FVNQHLCGSHL | 1254.43- (1 × H ) |
| H2 | 2789.255 | ++ | GIVEQCCASVCSL | 1311.55- (3 × H) | FVNQHLCGSHLVE | 1482.68- (1 × H) |
| H3 | 2852.269 | + | GIVEQCCASVCSLYQ | 1602.86- (3 × H) | FVNQHLCGSHL | 1254.43- (1 × H ) |
| Edman analysis | GIVEQXXASVXSLYQ | FVNQHLXGSHLVE | ||||
Chromatographic Analysis of Kinetics of Insulin Digestion
The procedure described in this section was employed for the kinetic RP-HPLC experiments reported in Fig. 7 and Table 2. Freshly prepared sample of 1 w/v % BI in 0.1 m NaCl, pH 1.9, was swiftly mixed with 0.4 weight % acidified pepsin solution to the final enzyme concentration of 0.0065 w/v %. The resulting solution was divided into 16 identical 70-μl volume portions and incubated in test tubes at 40 °C (time elapsed between the addition of pepsin and the start of incubation was 8 min). After the specified periods of time, the enzymatic digestion was irreversibly quenched by addition of 70 μl of 0.2 m glycine buffer, pH 8.7. Thus, the obtained samples were kept at 4 °C for 40 min before the pH was lowered to 2. Each acidified sample was subsequently divided into two portions, one of which (20 μl) was immediately solubilized in 90 μl of 6.7 m GdnHCl, 0.1 m sodium citrate, pH 1.9, prior to RP-HPLC separations (analysis of whole samples in Fig. 7). The other portion was centrifuged and washed three times with excess H2O before the remaining pellet was solubilized in GdnHCl/citrate solution, pH 1.9, and subjected to RP-HPLC analysis (pellets in Fig. 7) by employing two linear gradient steps as follows: 0.0–5.8 min at 0% B and 5.8–20.8 min at 0–60% B.
FIGURE 7.

HPLC-probed kinetics of pepsin-induced partial degradation of BI and release of highly amyloidogenic peptidic fragments (1% w/v BI in 0.0065 w/v % pepsin, 0.1 m NaCl, pH 1.9, 40 °C). After quenching the enzyme activity in glycine buffer, pH 8.7, followed by re-acidification at pH 2, whole samples (A) or centrifuged insoluble fractions only (B) were solubilized in GdnHCl and analyzed using RP-HPLC, MS, and Edman degradation. For the sake of clarity, only selected chromatograms are shown in A and B. Assignments of fractions F1 and F8 are shown in Table 2. C, dependences of intensities (absorption at 220 nm) of chromatographic peaks assigned to different peptide fragments on the duration of proteolysis with pepsin for whole samples (black) and centrifuged pellets (red). A.U., arbitrary units.
TABLE 2.
MS and Edman analysis-based assignment of main chromatographic peaks obtained in the course of separation of bulk and centrifuged products of gradual pepsin-induced fibrillation of insulin shown in Fig. 7
| Peak label | Proteolysis time/fraction | Retention time | A-chain fragment (sequence) | B-chain fragment (sequence) |
|---|---|---|---|---|
| F1 | 30–35 min/bulk | 13.10–13.50 min | B26–B30 (YTPKA) | |
| F2 | 30–35 min/bulk | 14.90–15.40 min | B14–B16 (ALY) | |
| F3 | 30–35 min/bulk | 16.22–16.65 min | B12–B16 (VEALY)a and B25–B30 (FYTPKA) | |
| F4 | 10–15 min/bulk | 24.16–24.52 min | A1–A21 (GIVEQCCASVCSLYQLENYCN) | B1–B15 (FVNQHLCGSHLVEAL)b and B16–B25 (YLVCGERGFF) |
| F5 | 25 min/pellet | 24.06–24.30 min | A1–A21 (GIVEQCCASVCSLYQLENYCN) | B1–B13 (FVNQHLCGSHLVE)b and (B16–B25 (YLVCGERGFF) or B17–B26 (LVCGERGFFY)) |
| F6 | 25 min/pellet | 23.60–23.84 min | A1–A21 (GIVEQCCASVCSLYQLENYCN) | B1–B13 (FVNQHLCGSHLVE)b and B17–B25 (LVCGERGFF) |
| F7 | 25 min/pellet | 23.86–24.00 min | A1–A21 (GIVEQCCASVCSLYQLENYCN) | B1–B11 (FVNQHLCGSHL) and B17–B25 (LVCGERGFF) |
| F8 | 3 h/pellet | 21.78–22.12 min | A1–A17 (GIVEQCCASVCSLYQLE) | B1–B13 (FVNQHLCGSHLVE)b and B1–B11 (FVNQHLCGSHL) |
a Both peptide fragments are present as separate entities.
b Both peptide fragments are linked to the A-chain by disulfide bonds.
Protein Chemistry Techniques
Determination of the N-terminal sequence of peptides was carried out using Edman degradation on Procise 491 automatic protein sequencer (Applied Biosystems). Before sequencing, liquid samples were absorbed onto glass fiber discs coated by Polybrene (Sigma). Determination of the molecular weight of peptides was performed on an ultrafleXtremeTM MALDI TOF instrument (Bruker, Germany). Selected samples (Fig. 7) were also analyzed using microTOF-QII mass spectrometer equipped with Apollo ESI nano-sprayer (Bruker, Germany).
Formation of Fibrils from Re-associated H Fragments
Freshly prepared 1% w/v BI in 0.1 m NaCl containing 0.0065% w/v pepsin, pH 1.9, was incubated for 20 h at 40 °C. Precipitated fibrils were centrifuged and washed three times with an excess of deionized water before being dissolved by raising the pH to 10.5 by stepwise addition of diluted NaOH. To the clear solution of NaOH-dissolved fibrils, NaCl was added to the final concentration of 0.1 m, and the pH was then lowered to 3 by addition of diluted HCl. For kinetic measurements in the presence of 30 μm ThT, the solution was divided into two portions as follows. The first portion was directly acidified to pH 1.9, and TCEP was added to the second portion to a final concentration of 20 mm before the sample was acidified to pH 1.9 as well. Kinetic measurements at 40 °C followed immediately (Fig. 8A). The time elapsed between the dissolution of fibrils at pH 10.5 and the beginning of fluorescence measurements was ∼13 min.
Atomic Force Microscopy (AFM)
Collected samples of aggregates were diluted 60 times with deionized water. A small droplet (8 μl) of the fibril suspension was swiftly deposited onto freshly cleaved mica and left to dry overnight. AFM tapping-mode measurements were carried out using Nanoscope III atomic force microscope (Veeco) and TAP300-Al sensors, resonance frequency 300 kHz (BudgetSensors, Bulgaria).
ATR-FTIR Measurements
H2O-based fibril suspensions were transferred onto the surface of the single-reflection diamond attenuated total reflectance (ATR) accessory of Nicolet iS50 FTIR spectrometer. The liquid suspensions were gently dried up in situ and infrared spectra of the thus obtained films were collected. Typically, for a single spectrum 32 interferograms of 2 cm−1 resolution were co-added. Because of ambiguity in determining the real values of refractive indexes of insulin amyloid films, uncorrected ATR-FTIR data are shown.
RESULTS
Pepsin-induced Fibrillation
Plate reader measurements of ThT fluorescence were employed as high throughput means of initial analysis of influence of pepsin on kinetics of spontaneous insulin fibrillation. In Fig. 1A, averaged trajectories of ThT fluorescence emission are plotted for insulin undergoing fibrillation in the presence of increasing concentrations of pepsin. In the absence of the enzyme, the time trace of the ThT signal has a well known sigmoidal shape with the long lag time reflecting slow formation of insulin amyloid nuclei typically observed under these experimental conditions. Surprisingly, upon addition of even very low concentrations of pepsin (3.25 × 10⁻⁴ % w/v corresponding to the factor of pepsin concentration = 0.05), the kinetics of fibrillation undergo dramatic changes; the lag time is shortened ∼8 times (Fig. 1B), with the following fast elongation phase ending in fluorescence plateau placed considerably higher than the one observed in the absence of pepsin. The abrupt kinetics of fibrillation become further accelerated with the increasing pepsin concentrations. However, at the enzyme concentration of 3.25 × 10⁻³ % w/v and higher, characteristic spikes begin to mark the end of the elongation phase. This is followed by a gradual decrease in fluorescence intensity. Given the fact that ThT is a stable and photobleaching-resistant fluorophore, the slow decay of fluorescence detected at high pepsin concentrations is likely to arise either from ongoing enzymatic digestion of whole fibrils (or monomers being in equilibrium with the amyloid) or as a consequence of heterogeneity of ThT-specific amyloid moieties (in terms of ThT-binding energies and quantum yields of ThT fluorescence). Auxiliary experiments showing that addition of pepsin to fibrils already formed in the presence of smaller enzyme doses accelerates the decay (Fig. 1C) supports the former scenario, i.e. ongoing enzymatic degradation of fibrils.
In the presence of 1.3 × 10⁻² % w/v pepsin, fluorescence maximum reaches only one-fourth of the level found for 10 times the diluted enzyme (the inset in Fig. 1B), and at the highest enzyme concentration, the ThT fluorescence emission intensity remains very low throughout the measurements. The very high rate of insulin fibrillation in the presence of 0.0065% w/v pepsin exceeds the rate of fibrillation induced by addition of sonicated preformed insulin fibrils at 1:100 mass ratio to native protein, which is typically sufficient to eliminate the lag time (Fig. 2A).
Although ThT is widely considered to be an amyloid-specific probe, there are known cases of its interactions (41) and fluorescence (42) with nonamyloidal proteins. Hypothetically, such nonfibrillar ThT fluorescence-enhancing peptide fragments could be released upon limited digestion of BI with pepsin. Thus, we intended to carry out a complementary kinetic experiment in which formation of amyloid fibrils in the insulin/pepsin system could be tracked. Although circular dichroism (CD) spectroscopy can conveniently capture the conformational α/β transition accompanying conversion of native insulin into amyloid fibrils, its application to this presented case proved problematic due to the following: (i) strong light scattering on aggregates precipitating during the proteolysis, and (ii) the necessity to use unusually short optical pathways for the relatively concentrated protein solution. Instead, the evolving structure and aggregation of 1% w/v BI dissolved in 0.1 m NaCl, D2O, pD 1.9, in the presence of 0.0065% w/v pepsin was monitored in the conformation-sensitive amide I′ band region using FTIR spectroscopy. The infrared spectra collected over the period of 24 h (Fig. 2B) show the amide I′ band shifting from the 1654-cm−1 position assigned to α-helices, the main secondary component of native insulin, to the ∼1627-cm−1 wave number in the range characteristic for parallel β-sheet building insulin amyloid fibrils (43, 44). The transition has a single fixed isosbestic point suggesting that no accumulation of stable intermediate forms is taking place. Importantly, the spectral contour of “mature” aggregate formed after the 24-h-long experiment is similar to that of typical bovine insulin fibrils (40), i.e. without overlapping, with broad spectral components around 1645 cm−1 stemming from short unstructured peptide fragments released during the proteolysis. Therefore, it seems plausible that either a large fragment of insulin forms the aggregated β-sheet structure or that several shorter fragments form β-aggregates independently but on a similar time scale. The red dotted line in Fig. 2B corresponds to a control insulin spectrum collected after a 24-h-long incubation under nearly identical conditions but in the absence of pepsin. The minor red shift of the amide I band to 1649 cm−1 reflects H/D exchange within the insulin backbone otherwise remaining in the native conformation. This confirms the crucial role of pepsin in triggering the α/β transition of insulin under these conditions. Interestingly, the persistent native structure contrasts with the complete conversion of insulin into fibrils noted for H2O-dissolved protein in the absence of pepsin (Fig. 2A). The mild aggregation-enhancing agitation used during ThT fluorescence measurements and the aggregation-decelerating effects of substitution of H2O with D2O (45) required for time-lapse FTIR measurements of aqueous protein samples are the two factors likely to underlie this discrepancy. The successful application of time-lapse FTIR spectroscopy to the pepsin-triggered fibrillation allowed us to employ this technique to revisit the slow degradation of pepsin-induced fibrils in the presence of even higher enzyme concentrations shown in Fig. 1C. A similar experiment in which ex situ pepsin-induced fibrils were subjected afterward to FTIR spectroscopy-monitored treatment with higher pepsin doses is summarized in Fig. 2C. The slow decrease of the amide I′ band intensity accompanied by the slight spectral shift supports the previous suggestion that the pepsin-induced fibrils remain vulnerable to further enzymatic degradation.
The amplitude AFM images of the pepsin-induced aggregates of insulin fragments are shown in Fig. 3, A–C. The results confirm the presence of amyloid-like forms distinct from typical insulin amyloid fibrils formed in the absence of pepsin (included, for comparison, in Fig. 3D). In contrast to regular insulin amyloid, the enzyme-induced aggregates collected at the end of the kinetic experiment tend to form straight but mostly very short fibrils (100–300 nm in length). According to height analysis, these fibrils are 5–7 nm in diameter, which is comparable to insulin amyloid.
FIGURE 3.
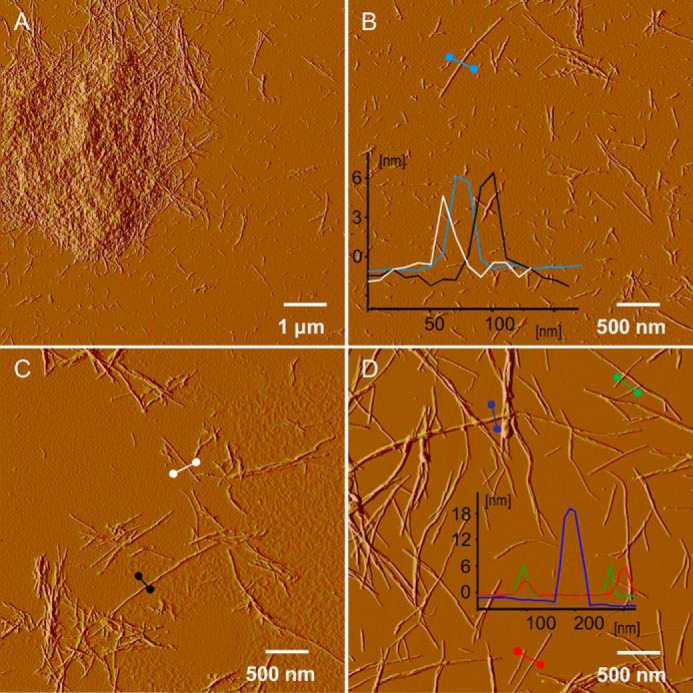
A–C, amplitude AFM images of insoluble fibrillar aggregates precipitating from the solution of 1% w/v BI in 0.1 m NaCl and 0.0065% w/v pepsin, pH 1.9, incubated at 40 °C during the ThT fluorescence-monitored kinetic experiment and collected from microplate afterward. D, reference amplitude AFM image of typical insulin amyloid fibrils formed in the absence of pepsin (1 w/v % BI in 0.1 m NaCl, pH 1.9, incubated without agitation at 60 °C for 48 h). Insets show cross-sections of selected representative specimen (according to height images).
“H-Peptides” as the Highly Amyloidogenic Pepsin-induced Insulin Fragments
Identification of building blocks of the pepsin-induced fibrils required establishing experimental conditions of controlled disassembly of these aggregates that would also instantly quench residual activity of the protease. This was achieved using either concentrated GdnHCl solution or diluted NaOH (see “Experimental Procedures”). The top panel of Fig. 4 presents RP-HPLCs of GdnHCl-dissolved native insulin (A), insulin completely digested by the presence of concentrated pepsin (B), and fractions of fibrils induced by mildly concentrated enzyme (C and D). The enzymatic degradation in 0.065% w/v pepsin is manifested by the appearance of several peaks corresponding to peptide fragments and the absence of the peak assigned to intact protein at ∼24 min (Fig. 4B). For insulin subjected to the fast fibrillation-inducing 0.0065% w/v pepsin treatment, chromatograms of the whole sample (including the soluble peptide fragments) and of insoluble pellet are marked (Fig. 4, C and D), respectively. The striking difference between chromatograms (Fig. 4, B and C) is the presence of a prominent peak at the retention time of 20.6 min. This is accompanied by a cluster of small signals just below the retention time of native insulin and the disappearance of certain peaks in the range of nonfibrillating fragments released upon complete digestion of insulin (e.g. at 16.1 and 19.1 min). Chromatogram (Fig. 4D) corresponding to the GdnHCl-dissolved pepsin-induced fibrils lacks any signals at retention times shorter than 20 min. Its strongest peak is at the retention time of 20.6 min implicating the corresponding peptide fraction as the main building blocks of fibrils. The collected fraction was subjected to Edman degradation and MS analyses, the results of which are shown in Table 1 and in the bottom panel of Fig. 4. According to Edman analysis, the 20.6 min RP-HPLC fraction contained N-terminal insulin fragments of both the A-chain (GIVEQXXASVXSLYQ) and B-chain (FVNQHLXGSHLVE); X denotes cysteine residues that cannot be detected in unalkylated form through Edman degradation. More detailed information is provided by mass spectrometry. The MALDI-TOF spectrum reveals the presence of three main components, each consisting of differently clipped disulfide-linked N-terminal fragments of A- and B-chains which, in the order of decreasing abundance, are as follows: H1, GIVEQCCASVCSL and FVNQHLCGSHL; H2, GIVEQCCASVCSL and FVNQHLCGSHLVE; H3, GIVEQCCASVCSLYQ and FVNQHLCGSHL (Table 1). The MS data are in excellent agreement with calculated masses of these fragments with intact disulfide bridges between Cys-6A–Cys-11A of the A-chain and Cys-7A–Cys-7B of chains A and B, respectively. Fig. 5A shows the primary structure of the BI monomer and pepsin-specific cleavage sites with the overlaid total sequence range of fragments H1, H2, and H3. We have named these fragments H-peptides because of the similarity of their covalent structures to this letter. The fact that in the presence of high pepsin concentration (e.g. 0.065% w/v) no fibrillation is observed (Fig. 2A) was an early indication that building blocks of the fast growing fibrils do contain additional cleavage sites for the enzyme. Indeed, each of the three peptide fragments conceals several such sites as follows: six for H1, seven for H2, and eight for H3 (Fig. 5A). In the acidified aqueous environment used in this study, insulin remains in mostly a dimeric native-like form (46). The spatial arrangement of H-fragments within a BI dimer is shown in Fig. 5B, where parts of the crystallographically resolved three-dimensional structure of BI corresponding to H-peptides were highlighted.
FIGURE 5.
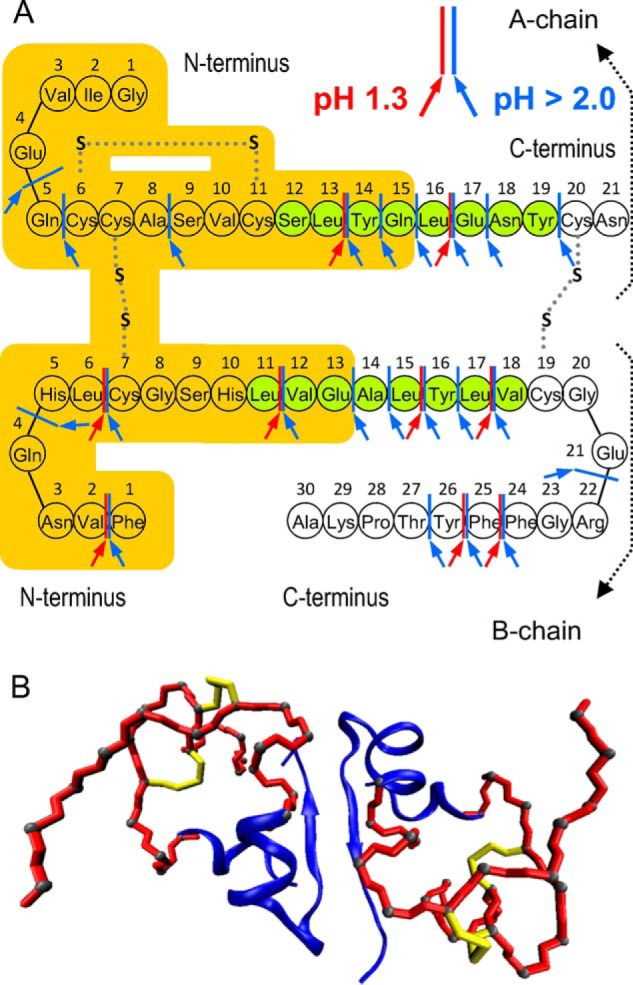
A, schematic structure and amino acid sequence of the BI monomer. The orange-colored area marks the pepsin-cleaved amyloid-building H-fragments of BI. Red and blue arrows correspond to pepsin cleavage sites at pH 1.3 and above pH 2, respectively. Two amyloidogenic sequences identified earlier (43) are marked in green. B, spatial arrangement of the H-fragments (red tubes mark fragments A1–15 and B1–13) within the native structure of BI dimer (Protein Data Bank entry 2A3G).
We have also conducted an analysis of the conformational state of monomeric H-peptides using CD spectroscopy. The data shown in Fig. 6A corresponds to far-UV CD spectra of strongly diluted [H] amyloid before and after dissociation at alkalic pH. The single spectral minimum at ∼218 nm falls well within the wavelength range expected for amyloidal β-sheets. As the alkali treatment causes complete disaggregation of [H] (see under “Experimental Procedures”), the released monomers of H-fragments are apparently unstructured, which is reflected by the corresponding flat and featureless CD spectra. Interestingly, subsequent re-adjustment of pH to neutral and acidic environments has no tangible impact on the secondary structure of the H-peptide (at the low concentration used for the CD measurements and in the absence of NaCl, no fast [H] re-assembly is expected). It should be stressed that its unique disulfide-constrained topology makes H-peptide a rather challenging object for standard bioinformatics tools aimed at prediction of amyloidogenic tendencies of protein fragments. We have used the TANGO algorithm developed by Serrano et al. (47–49) to compute β-sheet-forming and amyloidogenic tendencies of individual (i.e. not linked by the disulfide bonds) fragments of A- and B-chains present in the covalent structure of H-peptide. However, the results obtained using this method (data shown in Fig. 6B) do not indicate that clipping the C-terminal residues of either chain would increase amyloidogenic tendencies. On the contrary, the overall amyloidogenic scores for separate whole A- and B-chains (1200 and 8285, respectively) were significantly higher than for their shorter fragments constituting the H molecule (both scoring below 1, data not shown).
FIGURE 6.
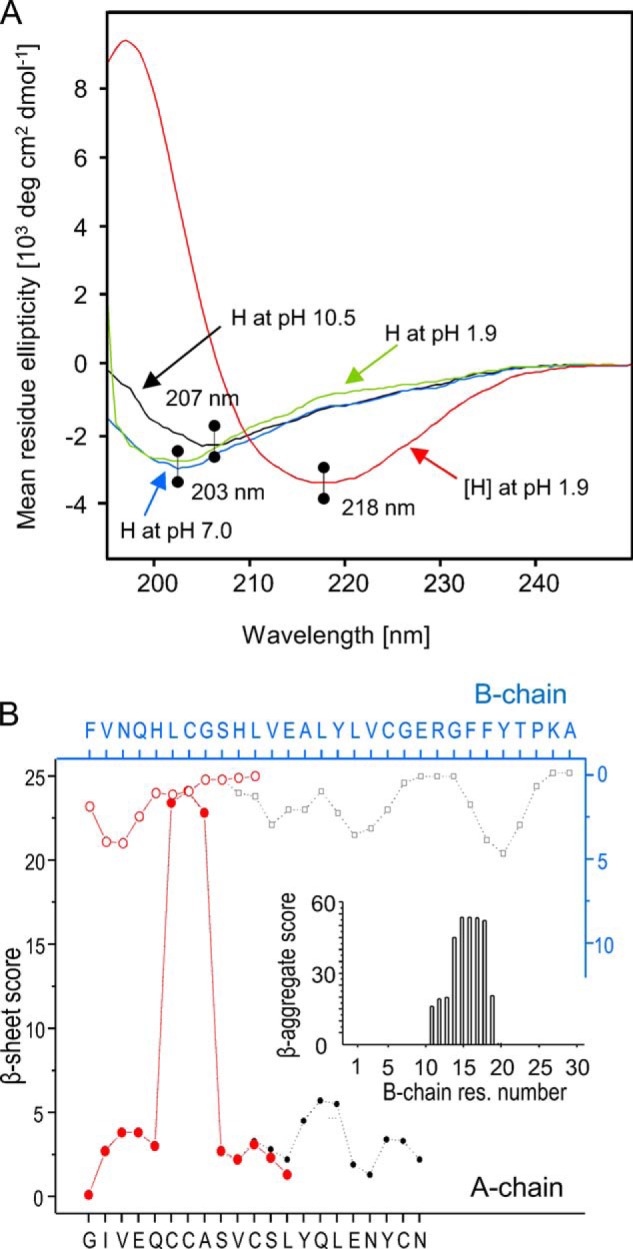
A, far-UV CD spectra of freshly sonicated [H] fibrils in aqueous suspension at pH 1.9 (red), subsequently dissolved at pH 10.5 (black), and then gradually acidified to pH 7.0 (blue) and 1.9 (green). All spectra were acquired 10 min after pH adjustment using a 1-cm quartz cuvette. B, TANGO-based assessment (47–49) of residue-specific β-sheet propensities of individual A-chains (filled black dots) and B-chains (black empty squares) of BI compared with those of the fragments of both chains forming H1 peptide (filled red dots for A-fragment and empty red circles for B-fragment). Inset shows TANGO-computed score for formation of β-aggregates of the whole B-chain, and scores for the other peptides were negligible. The computations were carried out for pH 1.9, ionic strength 0.1, temperature of 313.15 K.
The mechanisms underlying the emergence of H-peptides as main building blocks of the pepsin-induced fibrils must involve complex dynamic interactions between the enzyme and its gradually digested (and increasingly disordered) substrates with diffusion-dependent capacity to convert into protease-resistant aggregates. To elucidate these processes, we have carried out kinetic experiments paralleling those described in Fig. 2A in which the partly digested insulin fractions were subjected to RP-HPLC separation (Fig. 7), followed by MS and Edman degradation-based identification of key transient proteolysis products (Table 2). The time-resolved chromatograms obtained for the whole reacting solution (Fig. 7A) reveal a very steep decline of the concentration of intact insulin coinciding with the emergence of soluble fractions labeled as F1, F2, and F3 assigned to short C-terminal (F1 and F3) or middle sections (F2 and F3) of the B-chain (Table 2). The F1 peak appears first and on the time scales to which no aggregate is detected yet (Fig. 7B) implying that removal of the B26-B30 fragment may be insufficient to produce any highly aggregation-prone entities. Interestingly, chromatograms corresponding to the earliest insoluble aggregates (“15-min chromatogram” of the pellet, Fig. 7B) reveal several intensive peaks (F4, F5, F6, F7, and F8), none of which corresponds to the H-fraction. The H-peptide is, however, already present in the sample in soluble form (comparison of 15-min chromatograms in Fig. 7, A and B, as well as the H plot in C). According to the data in Table 2, there are several common traits of most of the fast-precipitating F4, F5, F6, and F7 insulin fragments as follows: (i) intact A-chain; (ii) N-terminal fragment of B-chain (of various lengths); and (iii) another B-chain fragment encompassing the Cys-19B residue. It therefore appears that the fastest precipitating intermediate products of digestion of BI with pepsin are those with all three disulfide bridges intact but with the main topological loop of insulin cut open. The following chromatograms of pellet fractions forming at longer digestion times indicate a rapid decrease of concentration of F4 fragments along with more moderate declines of F5, F6, and F7 and a simultaneous increase in concentrations of H and F8.
The picture emerging from these results might suggest that the H-peptide is simply a product of continuing degradation of already insoluble fibrillary aggregates of F4, F5, etc. (e.g. protected in the fibril “core”). However, the relatively high concentration of soluble H during the first 90 min of proteolysis (Fig. 7, plot in C) suggests that formation of [H] amyloid occurs also through de novo association of H monomers in solution.
In light of the data shown in Fig. 7, the actual amyloidogenic properties of H-peptides become unclear. To clarify this point, additional experiments were carried out. As the insoluble fraction formed upon the pepsin-induced fibrillation proved already rather homogeneous (Fig. 4), this has become a starting point for the preparation of larger portions of H-peptides sufficient for controlled re-association in the absence of pepsin. We have used another effective protocol of dissociation and re-association of the [H] amyloid by raising the pH to 10.5 followed by stepwise re-acidification to 1.9 (see “Experimental Procedures”). Moreover, the re-association experiment was carried out in the absence or presence of TCEP known to effectively reduce disulfide bonds even at a low pH value of insulin aggregation (50). Comparison of the re-association behavior of H-peptides under these two different sets of conditions would shed light on the possible role of disulfide bonds in their amyloidogenic propensity. According to the data in Fig. 8A, the re-association of H-fragments under nonreducing conditions is very fast, the process is completed within the first 30 min of the kinetic scan with no detectable lag time preceding its onset (with the experimental limitations to fast detection of this process specified under “Experimental Procedures”). The fluorescence intensity spike observed here in the absence of pepsin suggests that the aforementioned possible mechanisms related to heterogeneity of ThT-binding sites could be involved. The overlaid flat time-trace corresponding to ThT fluorescence of H-peptides in the presence of TCEP (red line in Fig. 8A) reflects the dramatic impact of reduction of disulfide bonds on their amyloidogenic potential (control experiments have shown that TCEP does not quench ThT fluorescence). Reduction of the Cys-6A–Cys-11A and Cys-7A–Cys-7B bonds and release of the free fragments of the A- and B-chains did however result in formation of insoluble amorphous precipitates over time (data not shown). Fig. 8B shows the re-association behavior of H probed by ATR-FTIR spectroscopy. The experiment paralleling the ThT scan in Fig. 8A shows conversion of presumably disordered H monomers (amide I band at ∼1641 cm−1) into parallel β-sheet structure (1631 cm−1) of the aggregate.
According to AFM data, the reassembled amyloid consists of polydispersed fibrils of 3, 8, and 13 nm in diameter as well as single protofilaments ∼1 nm thick. The most striking morphological difference between the reassembled H-fibrils and aggregates formed in situ upon insulin digestion with pepsin is the significantly higher degree of fragmentation in the latter case (Fig. 8C versus Fig. 3).
We have also carried out conformational analysis of the in situ pepsin-induced H-fibrils with reassembled aggregates and insulin amyloid using ATR-FTIR spectroscopy. All of the amide I bands of dry amyloid films overlaid in Fig. 8D share the characteristics of parallel β-sheet structure. Because the samples were prepared from nondeuterated compounds, the absorption maxima are slightly shifted to higher wave numbers compared with D2O-grown fibrils ([BI]D and Fig. 2B). The spectra display a high degree of similarity, although, for fibrils composed of whole insulin molecules, the band becomes broadened. This is in contrast to re-association and sonication, which have virtually no impact on the band's features. Infrared absorption in the amide I′ band region has often been shown to capture even tiny structural variations of fibrils, including insulin amyloid polymorphs (36, 40). Whereas the spectral fingerprint similarity of [BI], [H], and re-associated [H] amyloid could suggest the lack of significant differences in stacking patterns of individual β-strands, we have carried out additional experiments to see whether fibrils composed of the H-fragments are capable of inducing daughter fibrils (through elongation) upon cross-seeding to BI in the absence of pepsin. Kinetic trajectories in Fig. 8E again show the pronounced lag time of BI fibrillation in the absence of seeds and the lack thereof once the seeds of preformed insulin amyloid are added. The lag time appears to be significantly shorter upon addition of freshly formed (i.e. upon addition of pepsin to insulin) [H] amyloid; however, this effect is no longer observed when re-associated fibrils are used instead, implying that the catalytic effect may have more to do with residual pepsin activity transferred along with [H] seeds. From the FTIR spectra of daughter fibrils collected at the end of aggregation, it is clear that no conformational imprinting effect of the mother [H] fibrils takes place; spectra of all fibrils built of whole BI molecules are broadened relative to [H] (Fig. 8F).
DISCUSSION
Despite our initial expectations that pepsin-induced perturbation of insulin fibrillation would slow down the process, e.g. by preferential digestion of partly unfolded aggregation-prone intermediate states (24), the kinetic data shown in Figs. 1 and 2 provide strong evidence that limited proteolysis of native BI dimers (which is the predominant oligomeric form of the peptide in the acidic environment (46)) by pepsin releases highly amyloidogenic fragments with a significant tendency to form ThT-positive aggregates of parallel β-sheets (see the infrared data in Figs. 2B and 8D). The fact that at excessively high pepsin concentrations no such aggregates were formed suggested that the aggregate-building fragments contain additional cleavage sites, which become protected upon rapid self-association. This was confirmed by following biochemical analysis (Figs. 4 and 7 and Tables 1 and 2). Therefore, the observed effect is an outcome of complex dynamics involving sequential cleavage, unfolding, and fragmentation of insulin, followed by diffusion of highly aggregation-prone fragments and their self-assembly into amyloid nuclei. One particularly fascinating aspect of the pepsin-triggered fibrillation is its explosive character. Arguably, given the sequence specificity of amyloidogenic self-assembly (51), the observed fast kinetics of pepsin-triggered fibrillation already indicated high chemical uniformity of the pool of building blocks (i.e. pepsin-released peptide fragments).
The AFM analysis limited to the pepsin-induced aggregates of insulin fragments (Fig. 3) was ambiguous in terms of relationship between the fast fibrillation kinetics and the highly fragmented morphologies reminiscent of sonicated amyloid. Specifically, the mechanisms of fragmentation could be manifold. For example, fibrils built of enzyme-cleaved insulin fragments could be inherently very brittle. Mechanical instability would result in multiplication of amyloid tips further enhancing the elongation rate. However, random inclusions of foreign structurally incompatible peptide fragments could cause local defects within growing fibrils, making them more prone to cracks. Moreover, the scattered appearance of fibrils in Fig. 3A could also reflect very frequent nucleation events leading to a rapid decrease of monomer concentration and, eventually, arrested growth of amyloid. Comparison with the AFM image of fibrils built of H-fragments re-associated in the absence of other peptidic by-products of insulin digestion (Fig. 8C) implicates random inclusions of such peptides as the leading cause of the fragmentation phenomenon. The fact that the high rate of re-association of fibrils does not have to be accompanied by extensive multiplication of tips suggests that the explosive kinetics of fibrillation reflect strong propensities to both nucleate and elongate, rather than secondary nucleation scenarios enhancing fibrillation rate.
No obvious steric protection of H-fragments from the enzymatic attack can be inferred from the three-dimensional projection shown in Fig. 5B. The order in which pepsin digests native BI dimers, enabling effective release of highly amyloidogenic but vulnerable to further degradation fragments, is determined by the interplay of preferential interactions between enzyme and exposed cleavage sites of insulin as well as complex dynamics of partly digested protein. Outcome of these entangled processes is trivial and predictable only in the case of excessive enzyme concentration leading to complete insulin proteolysis. Otherwise, transient release of intermediately digested and highly aggregation-prone peptide fragments may open an amyloidogenic “escape route” and limit the degradation. Hence, the pepsin-trigger fibrillation of insulin fragments provides a rare snapshot of these intricate and intertwined phenomena.
Our results point to a significant amyloidogenic potential of insulin molecule being “unleashed” upon cutting open its central topological loop. The propensity to form amyloid fibrils appears to be “localized” in the disulfide-linked N-terminal part of the insulin molecule. Based on the studies on fibrillation of B-chain C-terminal truncated insulins (52), it has been known that this distal fragment does not contribute significantly to insulin aggregation. However, the extensive studies by Ivanova et al. (43, 44) aimed at mapping the core amyloidogenic regions of insulin implicated fragments SLYQLENY of A-chain and LVEALYLV of B-chain (Fig. 5A). The overlap between these sequence fragments and H-fragments is only partial. Hypothetically, in the case of F4, F5, F6, F7, F8, and H-fragments, the presence of the disulfide bridges may, by restricting the conformational landscape, direct associating monomers to follow a limited set of amyloidogenic self-assembly patterns facilitating the fibrillation. Hence, the results presented here demonstrate the importance of disulfide bonds and restriction of conformational freedom in maintaining the amyloidogenic character of peptide fragments.
The lack of catalytic effect of [H] amyloid on insulin fibrillation suggests that the two types of fibrils, despite similarities in the infrared characteristics, are structurally incompatible, at least in terms of docking interactions between amyloid tips and incoming protein molecules.
In conclusion, our study has demonstrated that limited proteolysis of bovine insulin with pepsin releases previously unreported two-chain peptides that appear to acquire highly amyloidogenic character when the central topological loop of insulin is cut open, whereas the intrachain Cys-6A–Cys-11A and interchain Cys-7A–Cys-7B disulfide bridges remain intact. These features are strongly correlated with the explosive character of fibrillation of these fragments. Whereas the initial proteolysis with pepsin produces several larger and highly aggregation-prone fragments (whose bona fide amyloidogenic character has yet to be confirmed), the main constituents of fibrils precipitating upon prolonged exposure of bovine insulin to pepsin are H-peptides consisting of the N-terminal fragments of A- and B-chains linked by preserved disulfide bonds. The H-fragments form fibrils with morphological and infrared characteristics very similar to those of insulin fibrils. More effort will be needed to clarify the role of primary structure and conformational flexibility of H-fragments in their explosive amyloidogenic tendencies and the exact chronology of proteolytic events leading to self-assembly of H-fibrils. The same holds true for understanding the contribution of the H-fragment's dynamics to the amyloidogenic tendencies of the whole insulin molecule.
This work was supported by National Science Centre of Poland Grant DEC-2012/07/B/NZ1/02642 (to W. D.). Biochemical analysis of products of insulin degradation products was partially carried out using equipment obtained with the support of European Union structural funds (grants POIG.02.01.00-12-064/08 and POIG.02.01.00-12-167/08).
This article was selected as a Paper of the Week.
- BI
- bovine insulin
- H
- pepsin-induced two-chain bovine insulin fragments
- TCEP
- tris(2-carboxyethyl) phosphine hydrochloride
- ThT
- thioflavin T
- [X]
- mother fibrils of protein X formed spontaneously
- [X]D
- fibrils of protein X formed in deuterated environment
- GdnHCl
- guanidine hydrochloride
- RP-HPLC
- reversed phase high pressure liquid chromatography
- AFM
- atomic force microscopy
- ATR-FTIR
- attenuated total reflectance Fourier transform infrared.
REFERENCES
- 1. Chiti F., Dobson C. M. (2006) Protein misfolding, functional amyloid, and human disease. Annu. Rev. Biochem. 75, 333–366 [DOI] [PubMed] [Google Scholar]
- 2. Uversky V. N., Fink A. L. (2004) Conformational constraints for amyloid fibrillation: the importance of being unfolded. Biochim. Biophys. Acta 1698, 131–153 [DOI] [PubMed] [Google Scholar]
- 3. Fowler D. M., Koulov A. V., Balch W. E., Kelly J. W. (2007) Functional amyloid- from bacteria to humans. Trends Biochem. Sci. 32, 217–224 [DOI] [PubMed] [Google Scholar]
- 4. King C.-Y., Diaz-Avalos R. (2004) Protein-only transmission of three yeast prion strains. Nature 428, 319–323 [DOI] [PubMed] [Google Scholar]
- 5. Hartman K., Brender J. R., Monde K., Ono A., Evans M. L., Popovych N., Chapman M. R., Ramamoorthy A. (2013) Bacterial curli protein promotes the conversion of PAP248–286 into the amyloid SEVI: cross-seeding of dissimilar amyloid sequences. PeerJ 1, e5. [DOI] [PMC free article] [PubMed] [Google Scholar]
- 6. Fändrich M., Dobson C. M. (2002) The behaviour of polyamino acids reveals an inverse side chain effect in amyloid structure formation. EMBO J. 21, 5682–5690 [DOI] [PMC free article] [PubMed] [Google Scholar]
- 7. Wolfe M. S., Guénette S. Y. (2007) APP at a glance. J. Cell Sci. 120, 3157–3161 [DOI] [PubMed] [Google Scholar]
- 8. Weksler M. E., Gouras G., Relkin N. R., Szabo P. (2005) The immune system, amyloid-β peptide, and Alzheimer's disease. Immunol. Rev. 205, 244–256 [DOI] [PubMed] [Google Scholar]
- 9. Vassar R., Bennett B. D., Babu-Khan S., Kahn S., Mendiaz E. A., Denis P., Teplow D. B., Ross S., Amarante P., Loeloff R., Luo Y., Fisher S., Fuller J., Edenson S., Lile J., et al. (1999) β-Secretase cleavage of Alzheimer's amyloid precursor protein by the transmembrane aspartic protease BACE. Science 286, 735–741 [DOI] [PubMed] [Google Scholar]
- 10. Yamada T., Liepnieks J. J., Kluve-Beckerman B., Benson M. D. (1995) Cathepsin B generates the most common form of amyloid A (76 residues) as a degradation product from serum amyloid A. Scand. J. Immunol. 41, 94–97 [DOI] [PubMed] [Google Scholar]
- 11. Stix B., Kähne T., Sletten K., Raynes J., Roessner A., Röcken C. (2001) Proteolysis of AA amyloid fibril proteins by matrix metalloproteinases-1, -2, and -3. Am. J. Pathol. 159, 561–570 [DOI] [PMC free article] [PubMed] [Google Scholar]
- 12. Hooper N. M. (2005) Roles of proteolysis and lipid rafts in the processing of the amyloid precursor protein and prion protein. Biochem. Soc. Trans. 33, 335–338 [DOI] [PubMed] [Google Scholar]
- 13. Kurochkin I. V. (1998) Amyloidogenic determinant as a substrate recognition motif of insulin-degrading enzyme. FEBS Lett. 427, 153–156 [DOI] [PubMed] [Google Scholar]
- 14. Farris W., Mansourian S., Chang Y., Lindsley L., Eckman E. A., Frosch M. P., Eckman C. B., Tanzi R. E., Selkoe D. J., Guenette S. (2003) Insulin-degrading enzyme regulates the levels of insulin, amyloid β-protein, and the β-amyloid precursor protein intracellular domain in vivo. Proc. Natl. Acad. Sci. U.S.A. 100, 4162–4167 [DOI] [PMC free article] [PubMed] [Google Scholar]
- 15. de Laureto P. P., Frare E., Battaglia F., Mossuto M. F., Uversky V. N., Fontana A. (2005) Protein dissection enhances the amyloidogenic properties of α-lactalbumin. FEBS J. 272, 2176–2188 [DOI] [PubMed] [Google Scholar]
- 16. Graveland-Bikker J. F., Schaap I. A., Schmidt C. F., de Kruif C. G. (2006) Structural and mechanical study of a self-assembling protein nanotube. Nano Lett. 6, 616–621 [DOI] [PubMed] [Google Scholar]
- 17. Ipsen R., Otte J. (2007) Self-assembly of partially hydrolysed α-lactalbumin. Biotechnol. Adv. 25, 602–605 [DOI] [PubMed] [Google Scholar]
- 18. Frare E., Polverino De Laureto P., Zurdo J., Dobson C. M., Fontana A. (2004) A highly amyloidogenic region of hen lysozyme. J. Mol. Biol. 340, 1153–1165 [DOI] [PubMed] [Google Scholar]
- 19. Picotti P., De Franceschi G., Frare E., Spolaore B., Zambonin M., Chiti F., de Laureto P. P., Fontana A. (2007) Amyloid fibril formation and disaggregation of fragment 1–29 of apomyoglobin: insights into the effect of pH on protein fibrillogenesis. J. Mol. Biol. 367, 1237–1245 [DOI] [PubMed] [Google Scholar]
- 20. Emeson E. E., Kikkawa Y., Gueft B. (1966) New features of amyloid found after digestion with trypsin. J. Cell Biol. 28, 570–577 [DOI] [PMC free article] [PubMed] [Google Scholar]
- 21. Zurdo J., Guijarro J. I., Dobson C. M. (2001) Preparation and characterization of purified amyloid fibrils. J. Am. Chem. Soc. 123, 8141–8142 [DOI] [PubMed] [Google Scholar]
- 22. Kübler E., Oesch B., Raeber A. (2003) Diagnosis of prion diseases. Br. Med. Bull. 66, 267–279 [DOI] [PubMed] [Google Scholar]
- 23. Malisauskas M., Weise C., Yanamandra K., Wolf-Watz M., Morozova-Roche L. (2010) Lability landscape and protease resistance of human insulin amyloid: a new insight into its molecular properties. J. Mol. Biol. 396, 60–74 [DOI] [PubMed] [Google Scholar]
- 24. Polverino de Laureto P., Taddei N., Frare E., Capanni C., Costantini S., Zurdo J., Chiti F., Dobson C. M., Fontana A. (2003) Protein aggregation and amyloid fibril formation by an SH3 domain probed by limited proteolysis. J. Mol. Biol. 334, 129–141 [DOI] [PubMed] [Google Scholar]
- 25. Kheterpal I., Williams A., Murphy C., Bledsoe B., Wetzel R. (2001) Structural features of the Aβ amyloid fibril elucidated by limited proteolysis. Biochemistry 40, 11757–11767 [DOI] [PubMed] [Google Scholar]
- 26. Miake H., Mizusawa H., Iwatsubo T., Hasegawa M. (2002) Biochemical characterization of the core structure of α-synuclein filaments. J. Biol. Chem. 277, 19213–19219 [DOI] [PubMed] [Google Scholar]
- 27. Frare E., Mossuto M. F., Polverino de Laureto P., Dumoulin M., Dobson C. M., Fontana A. (2006) Identification of the core structure of lysozyme amyloid fibrils by proteolysis. J. Mol. Biol. 361, 551–561 [DOI] [PubMed] [Google Scholar]
- 28. Wilson L. M., Mok Y.-F., Binger K. J., Griffin M. D., Mertens H. D., Lin F., Wade J. D., Gooley P. R., Howlett G. J. (2007) A structural core within apolipoprotein C-II amyloid fibrils identified using hydrogen exchange and proteolysis. J. Mol. Biol. 366, 1639–1651 [DOI] [PubMed] [Google Scholar]
- 29. Nielsen L., Khurana R., Coats A., Frokjaer S., Brange J., Vyas S., Uversky V. N., Fink A. L. (2001) Effect of environmental factors on the kinetics of insulin fibril formation: elucidation of the molecular mechanism. Biochemistry 40, 6036–6046 [DOI] [PubMed] [Google Scholar]
- 30. Bouchard M., Zurdo J., Nettleton E. J., Dobson C. M., Robinson C. V. (2000) Formation of insulin amyloid fibrils followed by FTIR simultaneously with CD and electron microscopy. Protein Sci. 9, 1960–1967 [DOI] [PMC free article] [PubMed] [Google Scholar]
- 31. Podestà A., Tiana G., Milani P., Manno M. (2006) Early events in insulin fibrillization studied by time-lapse atomic force microscopy. Biophys. J. 90, 589–597 [DOI] [PMC free article] [PubMed] [Google Scholar]
- 32. Dische F. E., Wernstedt C., Westermark G. T., Westermark P., Pepys M. B., Rennie J. A., Gilbey S. G., Watkins P. J. (1988) Insulin as an amyloid-fibril protein at sites of repeated insulin injections in a diabetic patient. Diabetologia 31, 158–161 [DOI] [PubMed] [Google Scholar]
- 33. Steiner D. F., Oyer P. E. (1967) The biosynthesis of insulin and a probable precursor of insulin by a human islet cell adenoma. Proc. Natl. Acad. Sci. U.S.A. 57, 473–480 [DOI] [PMC free article] [PubMed] [Google Scholar]
- 34. Steiner D. F., Park S.-Y., Støy J., Philipson L. H., Bell G. I. (2009) A brief perspective on insulin production. Diabetes Obes. Metab. 11, 189–196 [DOI] [PubMed] [Google Scholar]
- 35. Huang K., Dong J., Phillips N. B., Carey P. R., Weiss M. A. (2005) Proinsulin is refractory to protein fibrillation: topological protection of a precursor protein from cross-β assembly. J. Biol. Chem. 280, 42345–42355 [DOI] [PubMed] [Google Scholar]
- 36. Dzwolak W., Smirnovas V., Jansen R., Winter R. (2004) Insulin forms amyloid in a strain-dependent manner: an FTIR spectroscopic study. Protein Sci. 13, 1927–1932 [DOI] [PMC free article] [PubMed] [Google Scholar]
- 37. Foderà V., van de Weert M., Vestergaard B. (2010) Large scale polymorphism and auto-catalytic effect in insulin fibrillogenesis. Soft Matter 6, 4413–4419 [Google Scholar]
- 38. Loksztejn A., Dzwolak W. (2008) Chiral bifurcation in aggregating insulin: an induced circular dichroism study. J. Mol. Biol. 379, 9–16 [DOI] [PubMed] [Google Scholar]
- 39. Anson M. L. (1938) The estimation of pepsin, trypsin, papain, and cathepsin with hemoglobin. J. Gen. Physiol. 22, 79–89 [DOI] [PMC free article] [PubMed] [Google Scholar]
- 40. Surmacz-Chwedoruk W., Nieznańska H., Wójcik S., Dzwolak W. (2012) Cross-seeding of fibrils from two types of insulin induces new amyloid strains. Biochemistry 51, 9460–9469 [DOI] [PubMed] [Google Scholar]
- 41. Babenko V., Dzwolak W. (2011) Thioflavin T forms a non-fluorescent complex with α-helical poly-l-glutamic acid. Chem. Commun. 47, 10686–10688 [DOI] [PubMed] [Google Scholar]
- 42. Harel M., Sonoda L. K., Silman I., Sussman J. L., Rosenberry T. L. (2008) Crystal structure of thioflavin T bound to the peripheral site of Torpedo californica acetylcholinesterase reveals how thioflavin T acts as a sensitive fluorescent reporter. J. Am. Chem. Soc. 130, 7856–7861 [DOI] [PMC free article] [PubMed] [Google Scholar]
- 43. Ivanova M. I., Thompson M. J., Eisenberg D. (2006) A systematic screen of β(2)-microglobulin and insulin for amyloid-like segments. Proc. Natl. Acad. Sci. U.S.A. 103, 4079–4082 [DOI] [PMC free article] [PubMed] [Google Scholar]
- 44. Ivanova M. I., Sievers S. A., Sawaya M. R., Wall J. S., Eisenberg D. (2009) Molecular basis for insulin fibril assembly. Proc. Natl. Acad. Sci. U.S.A. 106, 18990–18995 [DOI] [PMC free article] [PubMed] [Google Scholar]
- 45. Dzwolak W., Ravindra R., Lendermann J., Winter R. (2003) Aggregation of bovine insulin probed by DSC/PPC calorimetry and FTIR spectroscopy. Biochemistry 42, 11347–11355 [DOI] [PubMed] [Google Scholar]
- 46. Whittingham J. L., Scott D. J., Chance K., Wilson A., Finch J., Brange J., Guy Dodson G. (2002) Insulin at pH 2: structural analysis of the conditions promoting insulin fibre formation. J. Mol. Biol. 318, 479–490 [DOI] [PubMed] [Google Scholar]
- 47. Fernandez-Escamilla A. M., Rousseau F., Schymkowitz J., Serrano L. (2004) Prediction of sequence-dependent and mutational effects on the aggregation of peptides and proteins. Nat. Biotechnol. 22, 1302–1306 [DOI] [PubMed] [Google Scholar]
- 48. Linding R., Schymkowitz J., Rousseau F., Diella F., Serrano L. (2004) A comparative study of the relationship between protein structure and β-aggregation in globular and intrinsically disordered proteins. J. Mol. Biol., 342, 345–353 [DOI] [PubMed] [Google Scholar]
- 49. Rousseau F., Schymkowitz J., Serrano L. (2006) Protein aggregation and amyloidosis: confusion of the kinds? Curr. Opin. Struct. Biol. 16, 118–126 [DOI] [PubMed] [Google Scholar]
- 50. Babenko V., Piejko M., Wójcik S., Mak P., Dzwolak W. (2013) Vortex-induced amyloid superstructures of insulin and its component A and B chains. Langmuir 29, 5271–5278 [DOI] [PubMed] [Google Scholar]
- 51. Krebs M. R., Morozova-Roche L. A., Daniel K., Robinson C. V., Dobson C. M. (2004) Observation of sequence specificity in the seeding of protein amyloid fibrils. Protein Sci. 13, 1933–1938 [DOI] [PMC free article] [PubMed] [Google Scholar]
- 52. Brange J., Andersen L., Laursen E. D., Meyn G., Rasmussen E. (1997) Toward understanding insulin fibrillation. J. Pharm. Sci. 86, 517–525 [DOI] [PubMed] [Google Scholar]