

Background: Autophagy is essential for β-cell function and survival.
Results: Autophagic turnover is impaired in β-cells when treated with metabolic stressors.
Conclusion: Diminished autophagy leads to apoptotic β-cell death.
Significance: Therapeutic interventions using pharmacological agents, which can improve ER folding capacity, as well as target the autophagy machinery, could provide promising strategies for treating human diseases such as T2D.
Keywords: Apoptosis, ATP, Autophagy, Autophagy-related Protein 7 (ATG7), Beta Cell (B-cell)
Abstract
Autophagy, a cellular recycling process responsible for turnover of cytoplasmic contents, is critical for maintenance of health. Defects in this process have been linked to diabetes. Diabetes-associated glucotoxicity/lipotoxicity contribute to impaired β-cell function and have been implicated as contributing factors to this disease. We tested the hypothesis that these two conditions affect β-cell function by modulating autophagy. We report that exposure of β-cell lines and human pancreatic islets to high levels of glucose and lipids blocks autophagic flux and leads to apoptotic cell death. EM analysis showed accumulation of autophagy intermediates (autophagosomes), with abundant engulfed cargo in palmitic acid (PA)- or glucose-treated cells, indicating suppressed autophagic turnover. EM studies also showed accumulation of damaged mitochondria, endoplasmic reticulum distention, and vacuolar changes in PA-treated cells. Pulse-chase experiments indicated decreased protein turnover in β-cells treated with PA/glucose. Expression of mTORC1, an inhibitor of autophagy, was elevated in β-cells treated with PA/glucose. mTORC1 inhibition, by treatment with rapamycin, reversed changes in autophagic flux, and cell death induced by glucose/PA. Our results indicate that nutrient toxicity-induced cell death occurs via impaired autophagy and is mediated by activation of mTORC1 in β-cells, contributing to β-cell failure in the presence of metabolic stress.
Introduction
Macroautophagy (hereafter named autophagy) is a recycling system in which cells degrade aged and misfolded proteins, organelles, or regions of the cytoplasm, and these materials become building blocks for new cellular components (1). Autophagy involves the formation of a double-membrane structure called the phagophore, which evolves into a single membrane structure called the autophagosome (AP)3 (2). APs contain cytoplasmic inclusions and organelles that remain intact because they lack proteolytic enzymes and have not yet fused with enzyme-containing lysosomes. Autophagy promotes cell survival during nutrient deprivation, by using cellular materials as nutrients and prolonging the life of cells under stress. However, autophagy can also lead to cellular demise, a form of nonapoptotic cell death referred to as “type 2 programmed cell death” (3). Autophagy is regulated by kinases (1, 4) and multiprotein complexes. Behrends et al. (5) used protein interaction screening to globally identify complexes controlling autophagy. They demonstrated that during autophagy microtubule-associated protein 1 light chain 3 (LC3) is cleaved and then lipidated forming LC3-II (6), which is subsequently recruited to the AP membrane. Therefore, LC3-II is a useful biomarker for autophagy. Stimulation of autophagy leads to an increase in the number of APs; however, activation of autophagy cannot alone be measured by quantifying the number of APs (7, 8).
Autophagy plays an important role in mammalian biology, as demonstrated in several animal models (9, 10). Conversely, impaired autophagy has been implicated in the pathophysiology of a variety of diseases including neurodegenerative disorders, cardiovascular diseases, cancer, and diabetes (11, 12). Recent seminal work showed that insulin-producing β-cell specific deletion of the autophagy-promoting protein 7 (Atg7) diminishes pancreatic β-cell mass and function because of increased apoptosis and decreased proliferation of β-cells (13). Interestingly, clinical research studies have shown a decrease in the expression of LAMP-2 (lysosome-associated membrane protein 2) and of cathepsin B and D, which are involved in latter stages of autophagy, in type 2 diabetic patients, thus connecting defective autophagy to diabetes. Mammalian target of rapamycin (mTOR), a serine/threonine-protein kinase that regulates autophagy, is activated by nutrient overload (14). mTOR kinase exists in two distinct complexes, mTORC1, which is rapamycin-sensitive, and mTORC2, which is insensitive to rapamycin. mTORC1 plays an important role in β-cell mass expansion and improved glucose tolerance (15), whereas prolonged inhibition by rapamycin causes loss of β-cell function and mass (16). However, recent studies have linked mTORC1 hyperactivation to insulin resistance and endoplasmic reticulum (ER) stress development resulting in decline in both β-cell mass and function (17, 18). Type 2 diabetes (T2D) is a complex metabolic disorder characterized by a progressive decrease in β-cell function and overt β-cell mass (19). Pancreatic β-cells overproduce insulin to compensate for insulin resistance in the early stages of T2D but eventually become dysfunctional, leading to hyperglycemia and clinical onset of diabetes. Nutrient overload has been postulated as the main cause of deterioration of β-cells in T2D. Increased free fatty acids (FFAs) alone or in combination with glucose have been proposed to impair insulin secretion and trigger the loss of β-cells by apoptosis (20, 21). Saturated fatty acids were found to be particularly cytotoxic to β-cells, whereas unsaturated fatty acids appear to have a protective role (22). Interestingly, fatty acids induce AP formation and suppress autophagic turnover in a rat insulinoma cell line (INS-1) (2). Increased early stage AP formation has been reported in pancreatic β-cells in diabetic db/db and in nondiabetic high fat-fed C57BL/6 mice, suggesting an impairment of AP maturation (23). FFAs have been hypothesized to be the underlying cause of obesity and diabetes (24). Here, human islets treated with PA resulted in impaired autophagy and decreased expression of genes related to lysosomal function that may affect lysosome-autophagosome fusion (25). However, there have been conflicting reports concerning whether FFAs induce or inhibit autophagy (23, 26–28). Glucolipotoxicity has been shown to cause β-cell failure and contribute to diabetes development, but the underlying mechanism has not been definitively elucidated. Therefore, in the present study, we tested the hypothesis that PA and glucose alone or in combination inhibit autophagic turnover in pancreatic β-cells. We also investigated the role of metabolic challenge on β-cell apoptosis and function. Our results demonstrate that autophagic turnover is impaired in metabolically stressed β-cells, ultimately leading to apoptotic cell death. Stimulation of autophagy by treatment with an mTORC1 inhibitor alleviated the suppression of autophagic turnover, and this was accompanied with a protection from apoptotic cell death.
EXPERIMENTAL PROCEDURES
Cell Lines, Treatments, and Transfections
MIN6 and INS-1 cells were purchased from ATCC and were cultured in DMEM and RPMI 1640 medium supplemented with 15% FBS (MIN6) and 10% FBS (INS-1), 10 mm HEPES buffer, 1 mm pyruvate, 50 μm 2-β-mercaptoethanol, 50 units/ml penicillin, and 50 μg/ml streptomycin. Where indicated, cells were maintained in Krebs-Ringer buffer, HBSS, or DMEM lacking glucose or l-glutamine (Sigma; D5030). Cells were treated with antimycin (Sigma), bafilomycin (Torris), rapamycin (Sigma), oleate (Sigma), monnesin (Sigma), 3-methyl adenine (Torris), and LysoTracker® Red (Invitrogen) at the indicated concentrations. Sodium palmitate was dissolved in 150 mm NaCl at 65–70 °C and then complexed to fatty acid free BSA (Sigma) at 40 °C for 2 h to form a 6:1 molar ratio of palmitate:BSA. The PA/BSA conjugates were administered directly on to the cultured cells. Plasmid encoding for WIPI-1-GFP and GFP-LC3B were from Addgene. To obtain a stable cell line, MIN6 and INS-1 cells were transfected using Effectene (Qiagen) reagent according to the manufacturer's instruction. Cells expressing GFP-LC3B and GFP-WIPI-1 were sorted according to the GFP intensity using FACS.
Human Islet Procurement and Culture
Human islets from donors (aged 20–50 years) without a history of diabetes were obtained from Prodo Laboratories (Table 1) and, upon arrival, washed and cultured in CMRL (5.5 mm glucose; Invitrogen) + 10% FBS + penicillin/streptomycin and glutamine in 6-well, ultralow adherence plates (Corning) at a concentration of 1 islet equivalent per 1 μl of medium. The islets were cultured (37 °C in 5% CO2) in 6-well, ultralow adherence plates (Corning) at a concentration of 1 islet equivalent per 1 μl of medium. After 48 h, the medium was changed to culture medium containing 5.5, 16.5, and 33.3 mm glucose supplemented with or without 0.4 mm palmitic acid (PA) for 48 h. Fatty acid free BSA was used as a control.
TABLE 1.
Demographic data of donors whose islets were used in the current study
BMI, body mass index; CVA, cerebrovascular accident; HbA1c, glycosylated hemoglobin.
| Gender | Ethnicity | Age | BMI | Cause of death | HbA1c | Diabetes |
|---|---|---|---|---|---|---|
| years | kg/m2 | % | ||||
| Female | Caucasian | 28 | 25.3 | CVA | 5.6 | No |
| Male | Hispanic | 23 | 27.3 | Head trauma | 5.6 | No |
| Female | Hispanic | 25 | 29.3 | Head trauma | 5.5 | No |
| Male | Asian | 30 | 32.9 | CVA | 5.3 | No |
Viability Assay
CellTiter-Glo luminescent cell viability assay was used to determine the number of viable cells in culture based on quantitation of the ATP present, which signals the presence of metabolically active cells. Briefly 96-well plate was equilibrated for 30 min at room temperature. An equal volume of CellTiter-Glo was added to each well of the plate. The plates were put on an orbital shaker for 2 min to induce cell lysis. The plates were then allowed to stand at room temperature for 10 min, and luminescence was then recorded.
Lentiviral Production
HEK 293T cells were co-transfected using Effectene (Qiagen) with lentiviral packaging plasmids pMD2.G and psPAX2 (Addgene, 12259, 12260), along with lentiviral vector pLK0.1-puro (Addgene) for shRNA production. The media containing the viral particles collected from Day 4 and 5 were pooled and filtered. MIN6 and INS-1 cells were then infected with virus and selected with puromycin. The sequences for scrambled control shRNA and BIF-1 shRNA are 5′-CAACAAGATGAAGAGCACCAA-3′ and 5′-GGGACAATATATGATTGATGC-3′, respectively. Bif-1 and scrambled sequences were cloned following the recommendations from Addgene.
Protein Degradation Assay: Labeling with [14C]Valine
Cells were cultured in 6-well plates and labeled with [14C]valine for 16–18 h with 0.5 μCi of [14C]valine (PerkinElmer Life Sciences NEC291EU050UC). Cells were then washed with PBS, and the medium was switched to medium containing 2 mm cold valine for 24 h. The cells were then incubated in control medium or medium containing PA (0.4 mm) or PA (0.4 mm) plus 10 mm glucose, in the presence or absence of bafilomycin. The medium was then removed at various time points and precipitated with 10% TCA. The supernatant was counted in Biosafe scintillation fluid for 1 min on a Beckman LS6500 scintillation counter.
RNA Analysis
For RT-PCR, total RNA was isolated by TRIzol reagent (Invitrogen; 15596-026) according to manufacturer's protocols. cDNA synthesis from 2 μg of RNA was carried out using SuperScript II (Invitrogen) with random hexamers as described (29). Triplicate samples for quantitative PCR were run in an iCycler (Bio-Rad) using the SYBR Green I system (Bio-Rad). ΔCt for each gene was determined after normalization to TFIIB, and ΔΔCt was calculated relative to the control. Gene expression values were then expressed as a fold change, calculated by 2−ΔΔCt. The primer sequences were: Bif-1-F, 5′-CAGCAACAACAGGAAGGCTA-3′; Bif-1-R, 5′-CCATTCCAACGACACTGAAC-3′; DDIT3-F, 5′-TGTTGAAGATGAGCGGGTG-3′; DDIT3-R, 5′-AGGTTCTGCTTTCAGGTGTG-3′; ATF4-F, 5′-TCGAATCCAGCAAAGCCC-3′; ATF4-R, 5′-GCCACCTCCAGATAGTCATC-3′; DNAJC3-F, 5′-TGAGTGTGGAGTAAATGCGG-3′; DNAJC3-R, 5′-TGAAACTGTGATAAGGCGTCG-3′; TFIIB-F, 5′-CTCTCCCAAGAGTCACATGTCC-3′; and TFIIB-R, 5′-CAATAACTCGGTCCCCTACAAC-3′.
Western Blotting
The antibodies used were anti-AKT (Cell Signaling, 11E7), anti-p-AKT-Ser-473 (Cell Signaling,), anti-β-actin (Cell Signaling, 8H10D10), anti-Beclin-1 (R&D Systems, AB8965), anti-Beclin-1 (Cell Signaling, 3738), anti-Bif-1 (Novus Biologicals, NBP1–31130), anti-Bif-1 (Santa Cruz, sc-50568), anti-Bif-1 (Santa Cruz, sc-374146), anti-caspase 3 (Cell Signaling, 8G10), anti-cleaved caspase 3 (Cell Signaling, Asp-175), anti-CHOP (Cell Signaling, D46F1), anti-4EBP1 (Cell Signaling, 9452), anti-4EBP1-Thr-37/46 (Cell Signaling, 2855), anti-GAPDH (Cell Signaling, 14C10), anti-LC3B (Cell Signaling, D11), anti-LC3B (Cell Signaling, 2775), anti-LC3B (Sigma-Aldrich, SAB4200361), anti-mTOR (Cell Signaling, 2972), anti-mTOR-Ser(P)-2448 (Cell Signaling, 2971), anti-mTOR-Ser(P)-2481 (Cell Signaling, 2974), anti-SQSTM1/p62 (Cell Signaling, D5E2), anti-SQSTM1/p62 (Abnova, PAB1750), PARP (Cell Signaling, 46D11), cleaved PARP (Cell Signaling, Asp-214), anti-pS6RP(Cell Signaling, 54D2), anti-pS6RP-Ser-235/236 (Cell Signaling, 4858), anti-ubiquitin (Santa Cruz, A-5), and anti-ubiquitin (DAKO, Z0458). Briefly, cells were lysed in 1% Nonidet P-40 buffer (1% Nonidet P-40, 20 mm Tris, pH 7.4, 150 mm NaCl, 5 mm EDTA with the Halt protease inhibitor mixture (Thermo, ML16387)). Lysed cells were incubated on ice for 15 min and then centrifuged for 20 min at 13,000 × g at 4 °C. Protein concentrations were determined by bicinchroninic acid assay. Western blots were performed using previously published techniques (30).
Lysosomal and Immunostaining
For detection of fusion between autophagosomes and lysosomes, GFP-LC3B-MIN6 cells were stained with 50 nm LysoTracker® Red (Molecular Probes) for 20 min in DMEM. The cells were then washed with PBS and immediately observed under fluorescent microscope at 540-nm excitation and 560-nm emission.
For immunohistochemistry, islets were harvested, washed, and fixed for 24 h in 4% paraformaldehyde in 1.5-ml microcentrifuge tubes. After fixation, the islets were precipitated (200 g for 3 min), aspirated, and embedded in 1.5% agarose. The agarose plugs were subsequently embedded in paraffin and sectioned at 4 μm. For immunohistochemistry, sections were dewaxed and rehydrated, and these steps were followed by antigen retrieval in 25 mm Tris, 1 mm EDTA (pH 8.5). Endogenous peroxidase activity was then quenched with 3% H2O2 in methanol. Following washes in PBS, sections were blocked with 3% goat serum in PBS. Primary and secondary (biotin-labeled) antibody incubations were followed by VectaStain ABC reagent (Vector Laboratories, Burlingame, CA) and then development with diaminobenzidine.
For immunofluorescence, cells were fixed in 4% PFA for 20 min, washed with PBST, and blocked with 10% goat serum in PBS for 1 h. The fixed cells were then incubated with primary antibody (in 10% goat serum) for 2 h at 4 °C. The cells were then washed with PBST, incubated with secondary antibody (Invitrogen 1:1000) in 10% goat serum with PBS for 1 h, and washed with PBST. Confocal microscopy analyses were carried out using Zeiss LSM510.
TUNEL Staining
The free 3-OH strand breaks resulting from DNA degradation were detected by TUNEL, using an in situ death detection kit, fluorescein (Roche) as per the kit instructions. Coverslip mounting with DAPI was performed and images obtained as above. Overlay and counting was performed with ImageJ software (National Institutes of Health).
Electron Microscopy
MIN6 cells were seeded into 6-well plates and grown in DMEM supplemented with 15% FBS (MIN6) and 10% FBS (INS-1), 10 mm HEPES buffer,1 mm pyruvate, 50 μm 2-β-mercaptoethanol, 50 units/ml penicillin, and 50 μg/ml streptomycin. The cells were then incubated in either control medium or medium containing 0.4 mm PA for 16 h. The cells were then rinsed in PBS and fixed with 3.0% glutaraldehyde in 0.1 cacodylate buffer (pH 7.4) at 4 °C for 2 h. The wells were rinsed four times in 0.1 m cacodylate with 5% sucrose for 5 min each. Cells were osmicated in 1% OsO4 for 45 min at 4 °C, dehydrated in a graded series of ethanol (50–100%), infiltrated with eponate 12 resin, and placed in a 60 °C oven for 48 h. Sectioning was performed with using a Reichert Ultracut E microtome and mounted on copper 300 mesh grids before staining with uranyl acetate and lead citrate. The grids were examined in a Philips Tecnai 12 BioTWIN transmission electron microscope, and images were captured with a Gatan 4K × 4K digital camera.
Data Analysis
All values are expressed as means ± S.D. Student's t test and one-way analysis of variance were employed for two-group and multiple comparisons, respectively. All measurements were considered significant if the p value was ≤0.05 (*) or ≤0.01 (**).
RESULTS
Exposure of β-Cells to Glucose and PA Leads to Apoptotic Cell Death
Because hyperglycemia and FFAs result in impaired β-cell function and are contributing factors to diabetes, we investigated the effects of saturated fatty acid PA (0.4 mm) alone or in combination with increasing concentrations of glucose (from 5.5 to 25 mm) on β-cells at graded incubation times (from 6 to 24 h). As shown in Fig. 1, A–C, incubation of INS-1 cells with varying concentrations of glucose and PA alone or in combination reduced cell viability. A similar situation was also observed for MIN6 cells (Fig. 1, D and E). Next, we investigated the mechanism of PA-induced cell death by evaluating the apoptotic pathway. Immunoblotting analysis showed an increase in the cleaved form of caspase 3 (Fig. 1, F–H) and PARP, suggesting caspase activation and apoptosis. To confirm our immunoblotting results, treated β-cells were stained with annexin V and propidium iodide and analyzed by flow cytometry to discriminate between apoptotic and necrotic cells (Fig. 2, A–C). We found that the proportion of annexin V-positive cells was elevated with increasing concentrations of glucose or PA alone, suggesting apoptosis (Fig. 2, A–C). To extend our findings to human β-cells, insulin and TUNEL staining was performed on histological sections from isolated pancreatic islets treated with either PA (0.4 mm) or glucose (16.5 mm) to look for changes in the expression of insulin and an increase in the number of apoptotic β-cells (Fig. 2, D–H). These experiments revealed that exposure to glucose (16.5 mm) and PA (0.4 mm) decreased the expression of insulin and induced 6- and 7-fold increases in the number of TUNEL-positive β-cells, respectively, relative to islets at 5.5 mm (normal) glucose (Fig. 2, D–F). Glucose (16.5 mm) together with PA (0.4 mm) had no additive effect (Fig. 2, G and H). Western analysis of treated islets showed an increase in the cleaved forms of both caspase 3 and PARP indicating apoptosis (Fig. 2I). Our results reveal that both PA and glucose induce apoptotic cell death in β-cells both alone or in combination.
FIGURE 1.

PA and glucose induce apoptotic cell death in β-cells. A, INS-1 cells were treated with different concentrations of glucose for 18 h. Cell viability was measured using Cell Titer-Glo luminescent cell viability assay. The data were normalized to 0.5 mm glucose as control and represented as percentage viability. **, p < 0.01 versus control. B, INS-1 cells were treated with different concentrations of PA (0.1–0.5 mm) for 6–24 h. Cell viability was analyzed using Cell Titer-Glo Luminescent cell viability assay. *, p < 0.05; **, p < 0.01 versus viability of PA-untreated cells (0 h of incubation). C, INS-1 cells were treated with 0.4 mm PA in the presence of different concentrations of glucose for 16 h. *, p < 0.05; **, p < 0.01 versus viability of cells cultured in the presence of BSA (0.4 mm) and glucose (5 mm). D, MIN6 cells were treated with different concentrations of PA (0.3–0.7 mm) for 18 h. Cell viability was analyzed using Cell Titer-Glo luminescent cell viability assay. *, p < 0.05; **, p < 0.01 versus viability of cells cultured in the presence of BSA (0.4 mm) E, MIN6 cells were treated with 0.4 mm PA in the presence of different concentrations of glucose for 16 h. *, p < 0.05; **, p < 0.01 versus viability of cells cultured in the presence of BSA (0.4 mm) and glucose (5.5 mm). F, caspase 3 activation and PARP cleavage was determined by immunoblotting analysis with anticleaved caspase 3 and anti-PARP antibodies in INS-1 cells treated with different concentrations of glucose. G, caspase 3 activation and PARP cleavage were determined by immunoblotting analysis with anticleaved caspase 3 and anti-PARP antibodies in INS-1 cells treated with 0.4 mm PA and different concentration of glucose (10–30 mm). H, caspase 3 activation and PARP cleavage was determined by immunoblotting analysis with anticleaved caspase 3 and anti-PARP antibodies in MIN6 cells treated with 10 mm glucose and different concentrations of PA (0.3–0.5 mm). The blots represent four different experiments. Glu, glucose.
FIGURE 2.

PA and glucose induce apoptotic cell death in β-cells. A, MIN6 cells were treated for 16 h with different concentrations of glucose (10 and 20 mm). B, different concentrations of PA (0.3 and 0.5 mm). C, 0.5 mm PA and different concentrations of glucose (10 and 20 mm) and then co-stained with propidium iodide and annexin V-FITC (A-V) followed by flow cytometric analysis. A–C, representative scatter plots from flow cytometric analysis and quantitation of annexin-positive cells. The error bars represent S.D. of the mean value from three independent experiments (*, p < 0.05; **, p < 0.01). D, insulin and TUNEL co-staining of human islets exposed to glucose (16.5 mm) and PA (0.4 mm) for 48 h compared with control (5.5 mm) (n = 4). E and G, TUNEL staining of human islets exposed to glucose (16.5 mm) and PA (0.4 mm) for 48 h compared with control (5.5 mm) (n = 4). Arrows indicate apoptotic cells (as indicated by TUNEL+/DAPI+). Arrowheads indicate examples of nonspecific fluorescence (DAPI−) that were not counted as apoptotic cells. Scale bar, 50 μm. F and H, TUNEL+ cells/islet were counted in 30 islets per treatment group per experiment. The bars indicate means ± S.D. I, immunoblot analysis with anticleaved caspase 3 and anti-PARP antibodies in lysates of human islets treated with 16.5 mm glucose, 0.4 mm PA, and 0.4 mm PA with 16.5 mm glucose. The image shown is representative of four separate experiments. Glu, glucose.
PA and Glucose Treatment Results in the Accumulation of Autophagosomes in β-Cells
Impaired autophagy has been linked to the pathophysiology of T2D (31). Recent studies on pancreatic β-cells from T2D patients have shown accumulation of vacuoles and APs, concomitant with an increase in apoptotic β-cell death (31). We therefore hypothesized that metabolic stress leads to accumulation of APs, thus resulting in apoptotic cell death. To test this hypothesis, we first examined the appearance of autophagic vacuoles in β-cells treated with PA and glucose using EM. Our EM analysis showed an increase in APs with abundant engulfed cargo in β-cells treated with PA, whereas relatively few APs were present in control samples (Fig. 3A). Because FFAs have been shown to increase AP formation (2), we treated the β-cell lines and human pancreatic islets with PA and measured levels of the autophagic marker, LC3B-II (which is a well characterized marker used to visualize APs and also represents the membrane bound form of LC3B on autophagic vacuoles). As shown in Fig. 3B, the levels of LC3B-II were significantly higher in PA (0.4 mm)-treated β-cells, thus indicating an increase in the number of APs. Blockade of autophagy by treatment with bafilomycin (200 nm), which inhibits the fusion of APs with lysosomes, further increased the levels of LC3B-II and Sequestosome-1 (SQSTM1/p62) when concomitantly treated with PA (0.4 mm) (Fig. 3, B and C), thus reflecting an increase in the rate of AP formation. Our results reveal that whereas PA inhibited autophagy, it induced a shift in LC3B localization to a punctate pattern (Fig. 3D). In addition, PA (0.4 mm) treatment of MIN6 cells stably expressing GFP-LC3B significantly increased the number of GFP-LC3B puncta per cell as compared with control (p = 0.003), (Fig. 3E). The APs were larger, and the GFP fluorescence intensity (FI) was brighter in β-cells treated with PA (0.4 mm) than under starvation (positive control), suggesting impairment in AP degradation. To confirm increased AP accumulation, WIPI-1 (WD repeat domain phosphoinositide-interacting protein 1), a marker for phagophores, was measured in MIN6 cells stably expressing WIPI-GPF and treated with PA (0.4 mm) alone or in combination with glucose (20 mm). We found that the number of WIPI-1 puncta per cell increased from 5 ± 1.4 in the BSA-treated control cells to 18 ± 5 in the PA-treated cells, which was significant (p = 0.002) (Fig. 3, F and G). No further increases in puncta were observed following concomitant PA (0.4 mm) and glucose (20 mm) exposure (22 ± 4.2, p = 0.002) (Fig. 3, F and G). Insulin and p62 double staining in human islets treated with glucose (33.3 mm) or PA (0.4 mm) alone or in combination showed co-localization of insulin-depleted β-cells with p62 (Fig. 3H), suggesting that the expression of p62 reflects damaged β-cells. Our results demonstrate that lipotoxicity leads to accumulation of APs and p62, potentially reflecting a defect in the lysosomal degradation machinery of β-cells.
FIGURE 3.

PA increases the number and size of the autophagosomes and autophagy substrates. A, micrographs of MIN6 cells revealed accumulation of autophagosomes in PA-treated cells (panels c and d) as compared with BSA controls (panels a and b). B, MIN6 cells were treated with 0.4 mm PA with or without 200 nm bafilomycin (for last 3 h of incubation) for 14 h. Western blot analysis of LC3B-II and p62 (n = 4) is shown. GAPDH was used as a loading control. C, quantification of triplicate experiments described in B, where the error bars represent standard deviation of triplicate measurements. The experiment was performed in quadruplicate. D, confocal images of MIN6 cells expressing GFP-LC3 treated for 14 h with full medium (FM), PA, or starvation medium. E, translocation of LC3B to AP was determined by formation of GFP autofluorescent dots, which were quantified. F, confocal images of MIN6 cells expressing WIPI-GFP and incubated for 16 h in control (FM) medium (5.5 mm glucose) or medium containing 0.4 mm PA alone or with 20 mm glucose. G, quantification of the AP number per cell as determined from confocal images of cells expressing WIPI-GFP. 35 cells were analyzed per condition. H, double staining for insulin (green) and p62 (red) of human pancreatic islets exposed to glucose (33.3 mm), PA (0.4 mm), glucose (16.5 mm), and PA (0.4 mm) for 48 h compared with control (5.5 mm) (n = 4). Nuclei are labeled by DAPI (blue). Co-localization of p62 and insulin-depleted β-cells is indicated by arrows. Scale bars represent 100 μm. Glu, glucose.
PA and Glucose Suppress Autophagic Turnover
Long-lived proteins are degraded during the process of autophagy. To test whether protein degradation was affected by FFAs, we performed a pulse-chase autophagic flux assay. We found that the release of [14C]valine was decreased in INS-1 cells treated with PA alone or in combination with glucose at 18 h (p = 0.03 and p = 0.04, respectively; Fig. 4, A and B). Bafilomycin blocked 40% of [14C]valine release, indicating that proteins are degraded by autophagy. The decrease in [14C]valine release by PA was almost unchanged whether bafilomycin was present or absent in the media, indicating that the suppression of protein degradation by PA was mediated by autophagy. We then determined levels of SQSTM1/p62, a key substrate of autophagy whose primary function is thought to involve turnover of ubiquitinated proteins and aged or damaged cell organelles (32). We measured SQSTM1/p62 expression levels and found that they were increased in β-cell lines treated with PA (0.4 mm) and glucose (5.5–35 mm) (Fig. 4, C, D, F, and G). Ubiquitinated proteins, which are normally removed by SQSTM1/p62, have been shown to accumulate in β-cells of T2D patients (33). We tested whether the increased levels of SQSTM1 led to clearance of ubiquitinated proteins. Instead we found the reverse: accumulation of ubiquitinated proteins in β-cells treated with PA (0.4 mm) alone or in combination with glucose (15 mm) (Fig. 4, E and H). Starvation (which potently induces autophagy) of MIN6-GFP-LC3-expressing cells did not prevent the accumulation of SQSTM1/p62 when treated with PA (0.4 mm) for 14 h (Fig. 4I), indicating that PA provides an overwhelming impairment in autophagic turnover. PA also increased unprocessed free GFP (Fig. 4I), as did 3-methyl adenine, an autophagy inhibitor (Fig. 4J), thus suggesting impaired autophagy. To determine whether PA and glucose affect autophagic turnover in human pancreatic islets, we treated human cadaveric islets with PA (0.4 mm) and glucose (16.5 mm) and found accumulation of several early normally degraded autophagy markers such as LC3B-II, p62, and ATG5 (Fig. 5, A and B). These results suggest impaired autophagic protein turnover.
FIGURE 4.

PA and glucose suppress autophagic turnover. A, in an autophagic flux assay, INS-1 cells were first pulsed with [14C]valine for 24 h, washed, and chased for 8 h in medium containing 10 mm nonradioactive valine. The cells were then treated with or without 0.4 mm PA for 18 h in the presence or absence of bafilomycin A1 (200 nm), and samples were collected thereafter. Each point is derived from three independent samples, and the entire experiment is representative of four independent assays. The error bars indicate standard deviation. B, INS-1 cells were first pulsed with [14C]valine for 24 h, washed, and chased for 8 h in medium containing 10 mm nonradioactive valine. The cells were then treated with BSA (control) and 0.4 mm PA in combination with 10 mm glucose for 24 h, and samples were collected thereafter. Each point is derived from three independent samples, and the entire experiment is representative of four independent assays. The error bars indicate standard deviation. C, MIN6 cells were treated with PA (0.4 mm) for 16 h, and lysates were analyzed by Western blot for SQSTM1/p62 (middle panel) or BECN-1 (bottom middle panel), LC3B (upper panel), and GAPDH (bottom panel). D, MIN6 cells were treated with PA (0.4 mm) for 6–24 h, and lysates were analyzed by Western blot for LC3B (middle panel) or SQSTM1 (upper panel) and GAPDH (bottom panel). E, MIN6 cells were treated with PA (0.4 mm) for 16 h, and lysates were analyzed by Western blot for ubiquitin (UB; upper panel) and GAPDH (bottom panel). F, INS-1 cells were treated with increasing concentration of glucose (5.5–30 mm), and lysates were analyzed by Western blot for SQSTM1 (upper panel), LC3B (middle panel), and GAPDH (bottom panel). G, INS-1 cells were treated with PA (0.4 mm) for 12 and 24 h, and lysates were analyzed by Western blot for SQSTM1 (middle panel) or LC3B (upper panel) and GAPDH (bottom panel). H, INS-1 cells were treated with glucose (15 mm) and increasing concentrations of PA (0.2–0.5 mm) for 16 h, and lysates were analyzed by Western blot for ubiquitin (upper panel), SQSTM1 (middle panel), LC3B (bottom middle panel) and GAPDH (bottom panel). I and J, MIN6 cells were treated with amino acid free medium (Starvation) alone or in the presence of 0.4 mm PA or in the presence of 3-methyl adenine (J) for 16 h, and lysates were analyzed by Western blot for SQSTM1/p62 (upper panel), GFP (middle panel), or LC3B (bottom middle panel) and GAPDH (bottom panel).
FIGURE 5.

PA and glucose suppress autophagic turnover in human pancreatic islets. A and B, human pancreatic islets were treated with PA (0. 4 mm) and increased concentrations of glucose (16.5 mm) for 48 h. The sections were then stained with different autophagy markers, LC3B-II, p62, and ATG5, or lysates were analyzed by Western blot for SQSTM1 (middle panel) or LC3B and GAPDH (bottom panel). C, summary of flow cytometry data from MIN6-GFP-LC3-expressing cells presented as average GFP FI normalized to control. The cells were exposed for 12 h to one of the following conditions: HBSS (starvation), rapamycin (200 nm), palmitate (0.4 mm), and oleate (0.4 mm). Cells were also exposed to bafilomycin (200 nm) for 3 h to inhibit autophagy. GFP-LC3 intensity was inversely correlated with the autophagosome flux. Thus, blockage of autophagosome flux with bafilomycin showed an increase in FI, whereas induction of flux with HBSS and rapamycin decreased FI. The data are expressed as average percentage increase or decrease intensity compared with no treatment. D, flow cytometry data from MIN6-GFP-LC3-expressing cells exposed for 18 and 24 h to one of the following conditions: HBSS (starvation), palmitate (0.4 mm), and oleate (0.4 mm). The data are expressed as average percentage increase or decrease intensity compared with no treatment. E, Western blot for p-mTOR and CHOP in lysates from MIN6 cells treated with oleate (0.4 mm) for 18 h. F, fusion of autophagosome with lysosome in PA (0.4 mm) treated MIN6-GFP-LC3 was detected by co-localization of LC3 with LysoTracker®, which stains lysosomes. MIN6-GFP-LC3 cells were treated with PA (0.4 mm) for 16 h and then stained with LysoTracker® (75 nm) for 20 min. The cells were then washed with serum-free DMEM and observed with confocal microscopy. G, MIN6 cells were treated with PA (0.4 mm) for 16 h, and then cellular ATP levels were measured. Glu, glucose; Rapa, rapamycin.
Autophagic turnover is dependent on the fusion of APs with lysosomes resulting in acidic autolysosomes. We asked whether PA affects lysosomal machinery, and to this end measured GFP fluorescence as it decreases within the acidic lysosomal environment. We utilized flow cytometry to directly measure GFP fluorescence intensity within treated β-cells (34), thus estimating the level of fusion of APs with lysosomes. In this assay, decreased autophagic turnover leads to an increase in total FI in cells expressing GFP-LC3, whereas stimulation of autophagy by starvation or treatment with rapamycin leads to decreased GFP FI. Treatment of the MIN6-GFP-LC3 cell line with PA (0.4 mm) significantly increased the GFP FI by 26 ± 6% as compared with control. However, this result was significantly smaller than that obtained following treatment with the autophagy inhibitor bafilomycin (200 nm) (58 ± 10%), suggesting that PA induces partial blockage of autophagic flux (Fig. 5C). Treatment of the MIN6-GFP-LC3 cell line with oleate (0.4 mm) increased the GFP FI at 12 h (Fig. 5C), but the GFP FI intensity decreased significantly at 18 and 24 h compared with PA-treated cells (Fig. 5D). Western blot of the oleate treated MIN6 cells showed decreased expression of p-mTOR and CHOP, thus suggesting stimulation of autophagy (Fig. 5E). Furthermore, co-localization between GFP-LC3B (Green) and LysoTracker® Red (a marker for lysosomes) was reduced in cells treated with PA compared with untreated controls, suggesting defects in lysosomal machinery (Fig. 5F). Lysosomal acidification is dependent on ATP hydrolysis by the H+ pump, and we found decreased cellular ATP levels in MIN6 cells treated with PA (0.4 mm) as compared with untreated control (47 ± 7 nmol/mg) and (80 ± 9) nm/mg protein, respectively (Fig. 5G). Our results demonstrate that autophagic turnover in β-cells is impaired when treated with PA and glucose, thus leading to accumulation of ubiquitinated and long-lived proteins.
Ultrastructural Changes in β-Cells When Treated with PA
Because p62 targets ubiquitinated proteins and damaged organelles to lysosomes for degradation, we hypothesized that decreased autophagic turnover may lead to accumulation of damaged organelles in β-cells. We performed EM to analyze ultrastructural changes and found cisternal distention of ER, massive vacuolization and aberrant and degenerated mitochondrial morphology in MIN6 cells treated with (0.4 mm) PA alone (Fig. 6A). Mitochondria in PA-treated β-cells showed damaged structures and lost cristae (Fig. 6B). EM studies also showed an increase in the total number of mitochondria in these cells (Fig. 6D, right panel). In addition, mitochondrial staining with MitoTracker Deep Red was increased in MIN6 cells treated with PA, suggesting a decrease in mitochondrial turnover (Fig. 6C, right panel). Our results demonstrate accumulation of mitochondria, which is attributed to impaired or inefficient autophagy.
FIGURE 6.
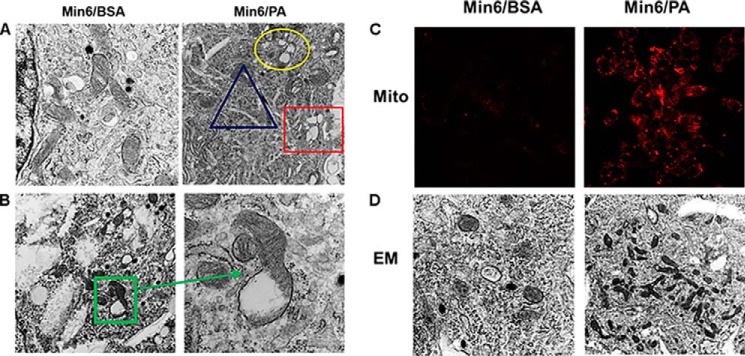
Electron micrographs of β-cells. A, ultrastructural changes in MIN6 cells treated with PA (0. 4 mm). Circle, swelled and damaged mitochondria; triangle, cisternal distention of ER; rectangle, vacuoles. B, higher magnifications showing damaged mitochondria with lost or fewer cristae. C, elevated MitoTracker Deep Red (Mito) staining in PA (0.4 mm)-treated MIN6 cells (right panel) as compared with BSA-treated cells (left panel). D, EM studies revealed increased number of mitochondria in PA (0.4 mm)-treated MIN6 cells (right panel) as compared with BSA-treated cells (left panel).
PA Activates mTOR Signaling
SQSTM1/p62 activates mTORC1 by associating with Raptor, a critical subunit of the mTORC1 (35). mTORC1 is also activated by nutrient overload (14). Because treatment of β-cells with PA and glucose increases p62 levels, we asked whether PA and glucose exposure induce the activation of mTORC1 in β-cells. Immunoblot analysis showed an increase in mTORC1 activation in a dose- and time-dependent manner in MIN6 and INS-1 cells when treated with PA (0.2–0.5 mm) alone or in combination with glucose (Fig. 7, A–C). Increased β-cell apoptosis has been observed in mice expressing a constitutively active form of S6K1, which is a downstream target of mTORC1 (37). We therefore determined whether proteins downstream of mTORC1 were also activated. Western blot analysis of MIN6 cells treated with increasing concentrations of PA (0.2–0.5 mm) showed increased phosphorylation of key proteins downstream of mTORC1, including 4EBP1 (eukaryotic translation initiation factor 4E-binding protein 1) and rpS6 (ribosomal protein S6) (Fig. 7D). Recent studies have shown that hyperactivation of mTORC1 in TSC1 or TSC2 (tuberous sclerosis 1 and 2)-deficient fibroblasts leads to an increase in the unfolded protein response caused by ER stress (14). Because accumulation of polyubiquitinated proteins in β-cells leads to increased ER stress (38), we next asked whether activation of mTORC1 in β-cell lines and human islets induces ER stress. We measured the expression of CCAAT enhancer-binding protein homologous protein (CHOP), a transcription factor and key mediator of cell death in response to ER stress, and found its expression was higher in β-cell lines and human islets when treated with increasing concentrations of PA (0.2–0.5 mm) and glucose (16.5 mm) (Fig. 7, E and F). Furthermore, IHC staining of human cadaver islets treated with PA (0.4 mm) and glucose (16.5 mm) showed intense staining for CHOP, compared with control islets (5.5 mm glucose) (Fig. 7G). We next asked whether stimulation of autophagy in β-cells decreased ER stress. We measured the expression of ER stress-related genes DDIT3, ATF4, and DNAJC3 by RT-PCR and found lower expression of these genes when treated with rapamycin (Fig. 7, H–J). We conclude that activation of mTORC1 by PA alone or in combination with glucose inhibits autophagic turnover, which in turn induces ER stress in β-cells, leading to their apoptotic cell death.
FIGURE 7.

PA activates mTOR signaling. A–C, MIN6 cells were treated for 16 h with different concentration of PA (0.2–0.5 mm) (A), 0.4 mm PA for 6–24 h (B), or INS-1 cells were treated with glucose (10 mm) with different concentrations of PA (0.2–0.5 mm) (C). The lysates were analyzed by Western blot for p-mTOR, p-Akt (middle panel), Beclin-1, and GAPDH (bottom panel). D, MIN6 cells were treated for 16 h with different concentration of PA (0.2–0.5 mm). The lysates were analyzed by Western blot for p4E-BP1, p-RPS6 (middle panel), and GAPDH (bottom panel). E, MIN6 cells were treated for 16 h with different concentrations of PA (0.2–0.5 mm). F, human pancreatic islets were treated with PA (0.4 mm) alone or in combination with glucose (16.5 mm) for 48 h. The lysates were analyzed by Western blot for CHOP and GAPDH. G, human pancreatic islets were treated with PA (0.4 mm) and increased concentration of glucose (16.5 mm) for 48 h. The sections were then stained with CHOP antibody. H–J, MIN6 cells were treated with PA (0.4 mm) for 16 h in the presence or absence of rapamycin (200 nm). ATF4, DDIT3, and DNAJC3 mRNA expression was quantified by real time RTPCR (*, p < 0.05; **, p < 0.01 versus BSA-treated control n = 3). Target transcript levels in H–J were normalized to mRNA levels of the housekeeping gene TFIIB and expressed as means ± S.D. percentages of increase. Glu, glucose.
Blockage of Autophagy in MIN6 Cells Leads to Cell Death
Because our results suggest that PA and glucose inhibit autophagic turnover, we next asked whether modulating autophagic flux would affect PA-induced β-cell death. Using RNA interference, we knocked down Bif-1 (Bax-interacting factor 1, also known as Endophilin B). Bif-1 interacts with Beclin1 through UVRAG (ultraviolet irradiation resistance-associated gene) and regulates autophagy (39). As shown in Fig. 8, A and B, shRNA targeting Bif-1 reduced mRNA and subsequent protein levels of Bif-1. Lentiviral shRNA targeting Bif-1 reduced AP formation in MIN6 cells treated with PA (0.4 mm) for 16 h (Fig. 8C). Levels of p62, increased in MIN6-Bif-1 knockdown cells (Fig. 8C), suggesting impairment in autophagy. Serum starvation (a positive control of autophagy) of MIN6-Bif-1 knockdown cells inhibited cell death (Fig. 8D) as shown in earlier studies in autophagy-deficient Atg5 and Bif-1−/− MEFs (39), thus suggesting that autophagy is the primary cell death mechanism under starvation conditions. To determine whether inhibition of autophagy reduced the viability of MIN6 cells, we treated cells with PA (0.4 mm) and found that viability of the MIN6-Bif-1 knockdown cells was reduced by 40% compared with control (Fig. 8E), whereas PA-induced apoptosis was augmented (Fig. 8, F and G). Treatment of MIN6 cells with autophagy inhibitors monensin (a protein transport inhibitor) and bafilomycin A1 (a V-ATPase inhibitor) (200 nm) significantly increased the proportion of annexin V-positive cells as compared with BSA and PA-treated controls (Fig. 9, A and B), thus suggesting an increase in apoptosis. Co-treatment of MIN6 cells with PA (0.4 mm) and bafilomycin (200 nm) (an inhibitor of fusion between APs and lysosomes), significantly decreased the viability of cells by 30% compared with PA-treated cells (Fig. 9C). Conversely, stimulation of autophagy with rapamycin (200 nm) (an inhibitor of mTORC1) and PA (0.4 mm) significantly increased the viability of MIN6 cells by roughly 30% (Fig. 9C) compared with PA treatment alone. In addition, treatment of MIN6-GFP cells with rapamycin also significantly decreased GFP FI when co-treated with PA as compared with PA alone (Fig. 9D), suggesting an increase in autophagic turnover. Lastly, we determined whether apoptosis was augmented in MIN6 cells treated with PA (0.4 mm) and rapamycin (200 nm). Western blot analysis revealed a decrease in the cleaved form of caspase 3 (Fig. 9E) as compared with cells treated with PA (0.4 mm) alone, suggesting a decrease in apoptotic cell death when cells were treated with PA and rapamycin. To confirm our immunoblotting results, we assayed the treated MIN6 cells with annexin V and propidium iodide (Fig. 9F). FACS analysis showed a decrease in annexin V-positive cells when MIN6 cells were treated with PA (0.4 mm) and rapamycin (200 nm) as compared with PA-treated cells, demonstrating that rapamycin was able to reduce PA-induced apoptosis (Fig. 9, F and G). We therefore conclude that inhibition of autophagy in β-cells decreased their viability via increases in apoptotic cell death, whereas stimulating autophagy by rapamycin increases the autophagic flux and inhibits cell death.
FIGURE 8.

Knockdown of Bif-1 enhances PA-induced cell death. A and B, lentiviral shRNA was used for Bif-1 knockdown. Bif-1 expression was analyzed by RT-PCR (A) and Western blotting (B) after 24 h. **, p < 0.01 versus the level of Bif-1 after infection of scrambled shRNA. C, the MIN6 Bif-1−/− and the scrambled cells were treated with PA (0.4 mm) for 16 h, and the lysates were analyzed by Western blot for SQSTM1/p62 (middle panel) or LC3B and GAPDH (bottom panel). D, the MIN6 Bif-1−/− and the scrambled cells were cultured in HBSS medium for 12 h, and the percentage of cell death was determined by trypan blue exclusion assay (error bars represent S.D. of the mean value from three independent experiments). E, the MIN6 Bif-1−/− and the scrambled cells were treated with PA (0.4 mm) for 16 h. Cell viability was analyzed using Cell Titer-Glo luminescent cell viability assay. *, p < 0.05; **, p < 0.01 versus viability of BSA-treated cells. F, after treating with PA (0.4 mm) for 16 h, immunofluorescence with cleaved caspase 3 antibody was done. G, after treating with PA (0.4 mm) for 16 h, lysates were analyzed by Western blot for cleaved PARP and GAPDH (bottom panel).
FIGURE 9.

Stimulation of autophagy decreases PA-induced cell death. MIN6 cells were co-treated with PA (0.4 mm) and autophagic inhibitors bafilomycin (200 nm) and monnesin (100 nm) for 16 h and then co-stained with propidium iodide and annexin V-FITC followed by flow cytometric analysis. A, representative scatter plot from flow cytometric analysis is shown. B, quantitation of annexin-positive cells. The error bars represent S.D. of the mean value from three independent experiments (*, p < 0.05; **, p < 0.01). C, MIN6 cells were co-treated with PA (0.4 mm), autophagic inhibitor bafilomycin (200 nm), and mTORC1 inhibitor rapamycin (200 nm) for 16 h, and cell viability was analyzed using Cell Titer-Glo luminescent cell viability assay. *, p < 0.05; **, p < 0.01 versus viability of BSA- and PA-treated cells. D, flow cytometry histogram of MIN6 cells expressing GFP-LC3 treated with PA (0.4 mm) for 16 h in the presence of autophagic inhibitor bafilomycin (200 nm) and mTORC1 inhibitor rapamycin (200 nm) added the last 3 h. E, MIN6 cells were treated with PA (0.4 mm) for 16 h in the presence or absence of rapamycin (200 nm), and lysates were analyzed by Western blot for cleaved caspase 3 and GAPDH (bottom panel). MIN6 cells were co-treated with PA (0.4 mm) and rapamycin (200 nm) for 16 h and then co-stained with propidium iodide and annexin V-FITC followed by flow cytometric analysis. F, representative scatter plot from flow cytometric analysis is shown. G, quantitation of annexin-positive cells. Error bars represent S.D. of the mean value from three independent experiments (*, p < 0.05, **, p < 0.01). Bafilo, bafilomycin; Rapa, rapamycin.
DISCUSSION
Glucolipotoxicity is a main contributor to the progression of diseases, such as obesity and diabetes, caused by oxidative ER stress and accumulation of ubiquitinated proteins within cells leading to apoptotic cell death (23, 40). Autophagy plays an essential role for the maintenance of β-cell mass and function (41–43), whereas its dysregulation has been associated with obesity, insulin resistance, and glucose intolerance (44). Autophagy regulates lipid metabolism (45), but little is known about the effect of lipid injury on autophagy levels or activity. We sought to evaluate the consequences of nutrient overload in β-cells based on this being the main feature of obese and T2D patients. To test our hypothesis, we examined the effects of PA and glucose alone or in combination on autophagic turnover in β-cells. We found that treatment of β-cells with different concentrations of glucose and PA alone or in combination decreased cell viability and induced apoptotic cell death. β-Cell apoptosis was associated with suppressed autophagic turnover explaining the toxic effects of nutrient overload, which correlated with the studies showing that β-cell specific knock-out of Atg7 in mice leads to decreased β-cell mass, along with increased β-cell death (23). Recent studies using mice fed with high fat diet or genetic models of obesity (ob/ob) and diabetes (db/db) showed reduced autophagy in liver as indicated by down-regulation of different autophagy markers (26). Conversely, it has also been reported that PA induces autophagy in both in vivo and in vitro model systems (23, 46). These inconsistencies are partly due to technical issues associated with performing in vivo autophagic assays and also attributed to factors such as cell types used, ages of the in vivo experimental animal models, the concentration and duration of FFA treatment, and the ratio of conjugated BSA to FFA used (47).
Our data point to diverse consequences elicited by impaired autophagic turnover. We found that defective autophagy caused by nutrient overload leads to accumulation of LC3B, an early autophagy biomarker, which was previously attributed to an increase in autophagic flux. However, recent advances have provided ample evidence questioning this interpretation (7, 8). Increased LC3B was also associated with an increase in accumulation of APs, which is evidenced by an increase in autofluorescent dots in GFP-LC3-transfected cells and an increase in WIPI-1 puncta. This was also accompanied with an accumulation of large ubiquitin-containing proteins with overexpression of the LC3-binding protein SQSTM1/p62, which otherwise are continuously cleared by autophagy, thus resulting in apoptotic cell death. Our observation of decreased autophagic turnover leading to accumulation of key autophagy substrate proteins, like p62, is supported by other studies showing that diabetes-induced oxidative stress and β-cell specific knock-out of Atg7 led to accumulation of p62 and ubiquitinated proteins (13). Studies in high fat diet-fed mice and db/db mice also showed higher levels of LC3B, accompanied with an increased number of autophagosomes (48). Also in vivo hepatic suppression of Atg7 in mice caused insulin resistance and ER stress, whereas suppression in in vitro cell models caused defective insulin signaling (26).
Autophagy plays an important role in clearance of large long-lived ubiquitinated proteins. Our studies showed a decrease in long-lived protein degradation in β-cells treated with PA alone or in combination with glucose. We also provided evidence indicating a blockage of autophagy by FFAs by showing an increase in GFP-LC3 FI and accumulation of different autophagy substrates. Our EM studies identified accumulation of APs with abundant engulfed cargo in PA-treated β-cells, which is comparable with observations in the β-cells of T2D patients (31). Proper lysosomal acidification is required for autophagic turnover. Any slight changes in ATP levels impair lysosomal H+ pump activity, and we observed a decrease in cellular ATP levels when β-cells were treated with FFAs. Our results were also supported by recent studies in INS-1 cells, which showed that treatment with PA led to decreased expression of ATP6AP2 and its adaptor protein AP2M1, both of which contribute to lysosomal acidification (25). Similar changes have also been reported in several neurodegenerative diseases (9, 12). Recent reports in T2D patients have described altered expression of LAMP-2 and cathepsin B and D in β-cells of T2D patients, suggesting impairment in the latter stages of autophagy (31).
Metabolically stressed human β-cells display markers of ER stress and activation of the apoptosis pathway (49). Similar forces in obese and T2D patients, i.e. enhanced demand for insulin production accompanied by elevated levels of free fatty acids, place a strain on β-cells leading to chronic ER stress (44). Autophagy plays an important protective role in β-cells during ER stress (50), but its impairment may precipitate the onset of ER stress (51), thus eliciting the expression of transcription factor Ddit3/CHOP, which is regarded as a key mediator of cell death in response to ER stress. Our results demonstrate that CHOP is highly up-regulated in β-cells when treated with PA and glucose, thus indicating that autophagy-deficient β-cells are more vulnerable to FFA-induced ER stress. On the other hand, stimulation of autophagy in β-cells by rapamycin decreased ER stress.
Autophagy plays an important role in cell survival under starvation conditions, but it also participates in cell death. Therefore, we investigated the role of autophagy in PA-induced β-cell death by stimulation or inhibition of autophagy. Inhibition of autophagy in β-cell lines by down-regulating Bif-1 expression or treatment with bafilomycin A1 increased FFA-induced apoptotic cell death, suggesting a protective role for autophagy in β-cells. mTORC1, which inhibits autophagy, is activated by nutrient overload (14). We speculate that activated mTORC1 in β-cells treated with PA and glucose inhibits autophagy leading to accumulation of SQSTM1/p62 and ubiquitinated proteins. This is consistent with recent observations (14), where hyperactivation of mTORC1 in Ulk−/− islets and Tsc2−/− fibroblasts leads to accumulation of SQSTM1/p62. Defective mitophagy by mTORC1 activation leads to an increase in mitochondrial mass (52), and we have observed accumulation of damaged or dysfunctional mitochondria in PA-treated β-cells. Also, recent studies show FFAs induce the arrest of mitochondrial fusion and fragmentation (53), concomitant with mitochondrial damage in β-cells (54), thus correlating with our studies. These findings imply that mitochondrial dysfunction and ER stress leads to β-cell death. Inhibiting mTORC1 using rapamycin alleviated the suppression of autophagic turnover by PA and glucose, and this was also accompanied with a protection from glucolipotoxicity-induced cell death. Recent studies in diabetic mouse models have shown improved glycemia, increased pancreatic insulin content, and decreased β-cells apoptosis when treated with rapamycin (55). Also drugs already in clinical use such as metformin, which potentiates AMPK activity and stimulates autophagy, have been shown to decrease β-cell death in isolated islets from T2D, as well as nondiabetic islets cultured with PA (56). On the other hand, chronic inhibition of mTORC1 by rapamycin has been shown to cause glucose intolerance in mice (15), as well as insulin resistance in humans (57). This is because chronic inhibition of mTORC1 with rapamycin disrupts the second mTOR complex, mTORC2, which is required for the insulin-mediated suppression of hepatic gluconeogenesis (36), thus leading to glucose intolerance and reduced β-cell function.
In conclusion, nutrient overload results in impairment of autophagy leading to accumulation of autophagosomes, autophagy substrates like p62, ER stress, accumulation of aberrant mitochondria, lysosomal dysfunction, and activation of mTORC1, thus contributing to β-cell death (Fig. 10). Stimulation of autophagy by treatment with mTORC1 inhibitor rapamycin alleviated the suppression of autophagic turnover by PA and glucose decreased ER stress, and this was also accompanied with a protection from glucolipotoxicity induced cell death. Thus, therapeutic interventions using pharmacological agents, which can improve ER folding capacity and stabilize misfolded proteins, as well as target the autophagy machinery, could provide promising strategies for treating human diseases such as T2D.
FIGURE 10.
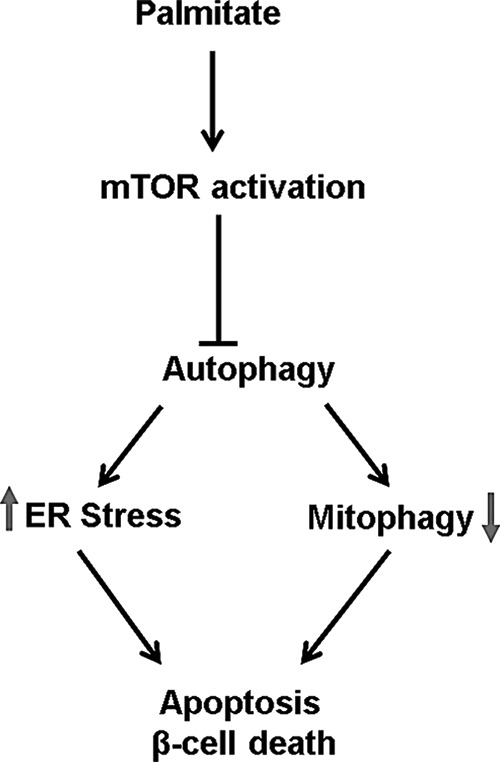
Inhibition of autophagic turnover by palmitatic acid leads to apoptotic cell death. By activating mTORC1, palmitic acid impairs autophagic turnover, resulting in increased ER stress and decreased mitophagy, thus triggering β-cell death.
Acknowledgments
We are grateful to members of the Sarvetnick Lab, particularly Danielle Yarde and Brian Boerner, for helpful discussions pertaining to this work.
Note Added in Proof
Fig. 8F did not show the results of Bif-1 knockdown in Min6 cells in the version of this article that was published as a Paper in Press on December 29, 2014. Instead, the original version showed the results of NLRP3 knockdown in Min6 cells. The correct images are now shown in the revised figure.
This work was supported, in whole or in part, by National Institutes of Health Grant 1UO1AI102012-01 (to N. E. S.). This work was also supported by generous funding from the Kieckhefer Foundation (to N. E. S.).
- AP
- autophagosome
- PA
- palmitic acid
- LC
- light chain
- mTOR
- mammalian target of rapamycin
- ER
- endoplasmic reticulum
- T2D
- type 2 diabetes
- FFA
- free fatty acid
- HBSS
- Hanks' balanced salt solution
- PARP
- poly(ADP-ribose) polymerase
- FI
- fluorescence intensity
- CHOP
- CCAAT enhancer-binding protein homologous protein.
REFERENCES
- 1. Kimmelman A. C. (2011) The dynamic nature of autophagy in cancer. Genes Dev. 25, 1999–2010 [DOI] [PMC free article] [PubMed] [Google Scholar]
- 2. Las G., Serada S. B., Wikstrom J. D., Twig G., Shirihai O. S. (2011) Fatty acids suppress autophagic turnover in beta-cells. J. Biol. Chem. 286, 42534–42544 [DOI] [PMC free article] [PubMed] [Google Scholar]
- 3. Boya P., González-Polo R. A., Casares N., Perfettini J. L., Dessen P., Larochette N., Métivier D., Meley D., Souquere S., Yoshimori T., Pierron G., Codogno P., Kroemer G. (2005) Inhibition of macroautophagy triggers apoptosis. Mol. Cell. Biol. 25, 1025–1040 [DOI] [PMC free article] [PubMed] [Google Scholar]
- 4. Levine B., Kroemer G. (2008) Autophagy in the pathogenesis of disease. Cell 132, 27–42 [DOI] [PMC free article] [PubMed] [Google Scholar]
- 5. Behrends C., Sowa M. E., Gygi S. P., Harper J. W. (2010) Network organization of the human autophagy system. Nature 466, 68–76 [DOI] [PMC free article] [PubMed] [Google Scholar]
- 6. Ichimura Y., Kirisako T., Takao T., Satomi Y., Shimonishi Y., Ishihara N., Mizushima N., Tanida I., Kominami E., Ohsumi M., Noda T., Ohsumi Y. (2000) A ubiquitin-like system mediates protein lipidation. Nature 408, 488–492 [DOI] [PubMed] [Google Scholar]
- 7. Kundu M., Thompson C. B. (2008) Autophagy: basic principles and relevance to disease. Annu. Rev. Pathol. 3, 427–455 [DOI] [PubMed] [Google Scholar]
- 8. Klionsky D. J., Abeliovich H., Agostinis P., Agrawal D. K., Aliev G., Askew D. S., Baba M., Baehrecke E. H., Bahr B. A., Ballabio A., Bamber B. A., Bassham D. C., Bergamini E., Bi X., Biard-Piechaczyk M., Blum J. S., Bredesen D. E., Brodsky J. L., Brumell J. H., Brunk U. T., Bursch W., Camougrand N., Cebollero E., Cecconi F., Chen Y., Chin L. S., Choi A., Chu C. T., Chung J., Clarke P. G., Clark R. S., Clarke S. G., Clavé C., Cleveland J. L., Codogno P., Colombo M. I., Coto-Montes A., Cregg J. M., Cuervo A. M., Debnath J., Demarchi F., Dennis P. B., Dennis P. A., Deretic V., Devenish R. J., Di Sano F., Dice J. F., Difiglia M., Dinesh-Kumar S., Distelhorst C. W., Djavaheri-Mergny M., Dorsey F. C., Droge W., Dron M., Dunn W. A., Jr., Duszenko M., Eissa N. T., Elazar Z., Esclatine A., Eskelinen E. L., Fesus L., Finley K. D., Fuentes J. M., Fueyo J., Fujisaki K., Galliot B., Gao F. B., Gewirtz D. A., Gibson S. B., Gohla A., Goldberg A. L., Gonzalez R., Gonzalez-Estevez C., Gorski S., Gottlieb R. A., Haussinger D., He Y. W., Heidenreich K., Hill J. A., Hoyer-Hansen M., Hu X., Huang W. P., Iwasaki A., Jaattela M., Jackson W. T., Jiang X., Jin S., Johansen T., Jung J. U., Kadowaki M., Kang C., Kelekar A., Kessel D. H., Kiel J. A., Kim H. P., Kimchi A., Kinsella T. J., Kiselyov K., Kitamoto K., Knecht E., Komatsu M., Kominami E., Kondo S., Kovacs A. L., Kroemer G., Kuan C. Y., Kumar R., Kundu M., Landry J., Laporte M., Le W., Lei H. Y., Lenardo M. J., Levine B., Lieberman A., Lim K. L., Lin F. C., Liou W., Liu L. F., Lopez-Berestein G., Lopez-Otin C., Lu B., Macleod K. F., Malorni W., Martinet W., Matsuoka K., Mautner J., Meijer A. J., Melendez A., Michels P., Miotto G., Mistiaen W. P., Mizushima N., Mograbi B., Monastyrska I., Moore M. N., Moreira P. I., Moriyasu Y., Motyl T., Munz C., Murphy L. O., Naqvi N. I., Neufeld T. P., Nishino I., Nixon R. A., Noda T., Nurnberg B., Ogawa M., Oleinick N. L., Olsen L. J., Ozpolat B., Paglin S., Palmer G. E., Papassideri I., Parkes M., Perlmutter D. H., Perry G., Piacentini M., Pinkas-Kramarski R., Prescott M., Proikas-Cezanne T., Raben N., Rami A., Reggiori F., Rohrer B., Rubinsztein D. C., Ryan K. M., Sadoshima J., Sakagami H., Sakai Y., Sandri M., Sasakawa C., Sass M., Schneider C., Seglen P. O., Seleverstov O., Settleman J., Shacka J. J., Shapiro I. M., Sibirny A., Silva-Zacarin E. C., Simon H. U., Simone C., Simonsen A., Smith M. A., Spanel-Borowski K., Srinivas V., Steeves M., Stenmark H., Stromhaug P. E., Subauste C. S., Sugimoto S., Sulzer D., Suzuki T., Swanson M. S., Tabas I., Takeshita F., Talbot N. J., Talloczy Z., Tanaka K., Tanaka K., Tanida I., Taylor G. S., Taylor J. P., Terman A., Tettamanti G., Thompson C. B., Thumm M., Tolkovsky A. M., Tooze S. A., Truant R., Tumanovska L. V., Uchiyama Y., Ueno T., Uzcategui N. L., van der Klei I., Vaquero E. C., Vellai T., Vogel M. W., Wang H. G., Webster P., Wiley J. W., Xi Z., Xiao G., Yahalom J., Yang J. M., Yap G., Yin X. M., Yoshimori T., Yu L., Yue Z., Yuzaki M., Zabirnyk O., Zheng X., Zhu X., Deter R. L. (2008) Guidelines for the use and interpretation of assays for monitoring autophagy in higher eukaryotes. Autophagy 4, 151–175 [DOI] [PMC free article] [PubMed] [Google Scholar]
- 9. Qu X., Zou Z., Sun Q., Luby-Phelps K., Cheng P., Hogan R. N., Gilpin C., Levine B. (2007) Autophagy gene-dependent clearance of apoptotic cells during embryonic development. Cell 128, 931–946 [DOI] [PubMed] [Google Scholar]
- 10. Komatsu M., Waguri S., Ueno T., Iwata J., Murata S., Tanida I., Ezaki J., Mizushima N., Ohsumi Y., Uchiyama Y., Kominami E., Tanaka K., Chiba T. (2005) Impairment of starvation-induced and constitutive autophagy in Atg7-deficient mice. J. Cell Biol. 169, 425–434 [DOI] [PMC free article] [PubMed] [Google Scholar]
- 11. Hara T., Nakamura K., Matsui M., Yamamoto A., Nakahara Y., Suzuki-Migishima R., Yokoyama M., Mishima K., Saito I., Okano H., Mizushima N. (2006) Suppression of basal autophagy in neural cells causes neurodegenerative disease in mice. Nature 441, 885–889 [DOI] [PubMed] [Google Scholar]
- 12. Komatsu M., Waguri S., Chiba T., Murata S., Iwata J., Tanida I., Ueno T., Koike M., Uchiyama Y., Kominami E., Tanaka K. (2006) Loss of autophagy in the central nervous system causes neurodegeneration in mice. Nature 441, 880–884 [DOI] [PubMed] [Google Scholar]
- 13. Jung H. S., Chung K. W., Won Kim J., Kim J., Komatsu M., Tanaka K., Nguyen Y. H., Kang T. M., Yoon K. H., Kim J. W., Jeong Y. T., Han M. S., Lee M. K., Kim K. W., Shin J., Lee M. S. (2008) Loss of autophagy diminishes pancreatic beta cell mass and function with resultant hyperglycemia. Cell Metab. 8, 318–324 [DOI] [PubMed] [Google Scholar]
- 14. Bartolomé A., Kimura-Koyanagi M., Asahara S., Guillén C., Inoue H., Teruyama K., Shimizu S., Kanno A., García-Aguilar A., Koike M., Uchiyama Y., Benito M., Noda T., Kido Y. (2014) Pancreatic beta-cell failure mediated by mTORC1 hyperactivity and autophagic impairment. Diabetes 63, 2996–3008 [DOI] [PubMed] [Google Scholar]
- 15. Cunningham J. T., Rodgers J. T., Arlow D. H., Vazquez F., Mootha V. K., Puigserver P. (2007) mTOR controls mitochondrial oxidative function through a YY1-PGC-1α transcriptional complex. Nature 450, 736–740 [DOI] [PubMed] [Google Scholar]
- 16. Fraenkel M., Ketzinel-Gilad M., Ariav Y., Pappo O., Karaca M., Castel J., Berthault M. F., Magnan C., Cerasi E., Kaiser N., Leibowitz G. (2008) mTOR inhibition by rapamycin prevents beta-cell adaptation to hyperglycemia and exacerbates the metabolic state in type 2 diabetes. Diabetes 57, 945–957 [DOI] [PubMed] [Google Scholar]
- 17. Um S. H., Frigerio F., Watanabe M., Picard F., Joaquin M., Sticker M., Fumagalli S., Allegrini P. R., Kozma S. C., Auwerx J., Thomas G. (2004) Absence of S6K1 protects against age- and diet-induced obesity while enhancing insulin sensitivity. Nature 431, 200–205 [DOI] [PubMed] [Google Scholar]
- 18. Ozcan U., Ozcan L., Yilmaz E., Düvel K., Sahin M., Manning B. D., Hotamisligil G. S. (2008) Loss of the tuberous sclerosis complex tumor suppressors triggers the unfolded protein response to regulate insulin signaling and apoptosis. Mol. Cell 29, 541–551 [DOI] [PMC free article] [PubMed] [Google Scholar]
- 19. Butler A. E., Janson J., Bonner-Weir S., Ritzel R., Rizza R. A., Butler P. C. (2003) Beta-cell deficit and increased beta-cell apoptosis in humans with type 2 diabetes. Diabetes 52, 102–110 [DOI] [PubMed] [Google Scholar]
- 20. El-Assaad W., Buteau J., Peyot M. L., Nolan C., Roduit R., Hardy S., Joly E., Dbaibo G., Rosenberg L., Prentki M. (2003) Saturated fatty acids synergize with elevated glucose to cause pancreatic beta-cell death. Endocrinology 144, 4154–4163 [DOI] [PubMed] [Google Scholar]
- 21. Zhou Y. P., Grill V. E. (1994) Long-term exposure of rat pancreatic islets to fatty acids inhibits glucose-induced insulin secretion and biosynthesis through a glucose fatty acid cycle. J. Clin. Invest. 93, 870–876 [DOI] [PMC free article] [PubMed] [Google Scholar]
- 22. Maedler K., Oberholzer J., Bucher P., Spinas G. A., Donath M. Y. (2003) Monounsaturated fatty acids prevent the deleterious effects of palmitate and high glucose on human pancreatic beta-cell turnover and function. Diabetes 52, 726–733 [DOI] [PubMed] [Google Scholar]
- 23. Ebato C., Uchida T., Arakawa M., Komatsu M., Ueno T., Komiya K., Azuma K., Hirose T., Tanaka K., Kominami E., Kawamori R., Fujitani Y., Watada H. (2008) Autophagy is important in islet homeostasis and compensatory increase of beta cell mass in response to high-fat diet. Cell Metab. 8, 325–332 [DOI] [PubMed] [Google Scholar]
- 24. Chavez J. A., Summers S. A. (2010) Lipid oversupply, selective insulin resistance, and lipotoxicity: molecular mechanisms. Biochim. Biophys. Acta 1801, 252–265 [DOI] [PMC free article] [PubMed] [Google Scholar]
- 25. Cnop M., Abdulkarim B., Bottu G., Cunha D. A., Igoillo-Esteve M., Masini M., Turatsinze J. V., Griebel T., Villate O., Santin I., Bugliani M., Ladriere L., Marselli L., McCarthy M. I., Marchetti P., Sammeth M., Eizirik D. L. (2014) RNA sequencing identifies dysregulation of the human pancreatic islet transcriptome by the saturated fatty acid palmitate. Diabetes 63, 1978–1993 [DOI] [PubMed] [Google Scholar]
- 26. Yang L., Li P., Fu S., Calay E. S., Hotamisligil G. S. (2010) Defective hepatic autophagy in obesity promotes ER stress and causes insulin resistance. Cell Metab. 11, 467–478 [DOI] [PMC free article] [PubMed] [Google Scholar]
- 27. Choi S. E., Lee S. M., Lee Y. J., Li L. J., Lee S. J., Lee J. H., Kim Y., Jun H. S., Lee K. W., Kang Y. (2009) Protective role of autophagy in palmitate-induced INS-1 beta-cell death. Endocrinology 150, 126–134 [DOI] [PubMed] [Google Scholar]
- 28. Koga H., Kaushik S., Cuervo A. M. (2010) Altered lipid content inhibits autophagic vesicular fusion. FASEB J. 24, 3052–3065 [DOI] [PMC free article] [PubMed] [Google Scholar]
- 29. Mir S. U., Jin L., Craven R. J. (2012) Neutrophil gelatinase-associated lipocalin (NGAL) expression is dependent on the tumor-associated sigma-2 receptor S2RPgrmc1. J. Biol. Chem. 287, 14494–14501 [DOI] [PMC free article] [PubMed] [Google Scholar]
- 30. Mir S. U., Ahmed I. S., Arnold S., Craven R. J. (2012) Elevated progesterone receptor membrane component 1/sigma-2 receptor levels in lung tumors and plasma from lung cancer patients. Int. J. Cancer 131, E1–E9 [DOI] [PubMed] [Google Scholar]
- 31. Masini M., Bugliani M., Lupi R., del Guerra S., Boggi U., Filipponi F., Marselli L., Masiello P., Marchetti P. (2009) Autophagy in human type 2 diabetes pancreatic beta cells. Diabetologia 52, 1083–1086 [DOI] [PubMed] [Google Scholar]
- 32. Pankiv S., Clausen T. H., Lamark T., Brech A., Bruun J. A., Outzen H., Øvervatn A., Bjørkøy G., Johansen T. (2007) p62/SQSTM1 binds directly to Atg8/LC3 to facilitate degradation of ubiquitinated protein aggregates by autophagy. J. Biol. Chem. 282, 24131–24145 [DOI] [PubMed] [Google Scholar]
- 33. Kaniuk N. A., Kiraly M., Bates H., Vranic M., Volchuk A., Brumell J. H. (2007) Ubiquitinated-protein aggregates form in pancreatic beta-cells during diabetes-induced oxidative stress and are regulated by autophagy. Diabetes 56, 930–939 [DOI] [PubMed] [Google Scholar]
- 34. Shvets E., Fass E., Elazar Z. (2008) Utilizing flow cytometry to monitor autophagy in living mammalian cells. Autophagy 4, 621–628 [DOI] [PubMed] [Google Scholar]
- 35. Moscat J., Diaz-Meco M. T. (2011) Feedback on fat: p62-mTORC1-autophagy connections. Cell 147, 724–727 [DOI] [PMC free article] [PubMed] [Google Scholar]
- 36. Lamming D. W., Ye L., Katajisto P., Goncalves M. D., Saitoh M., Stevens D. M., Davis J. G., Salmon A. B., Richardson A., Ahima R. S., Guertin D. A., Sabatini D. M., Baur J. A. (2012) Rapamycin-induced insulin resistance is mediated by mTORC2 loss and uncoupled from longevity. Science 335, 1638–1643 [DOI] [PMC free article] [PubMed] [Google Scholar]
- 37. Elghazi L., Balcazar N., Blandino-Rosano M., Cras-Méneur C., Fatrai S., Gould A. P., Chi M. M., Moley K. H., Bernal-Mizrachi E. (2010) Decreased IRS signaling impairs beta-cell cycle progression and survival in transgenic mice overexpressing S6K in beta-cells. Diabetes 59, 2390–2399 [DOI] [PMC free article] [PubMed] [Google Scholar]
- 38. Huang C. J., Haataja L., Gurlo T., Butler A. E., Wu X., Soeller W. C., Butler P. C. (2007) Induction of endoplasmic reticulum stress-induced beta-cell apoptosis and accumulation of polyubiquitinated proteins by human islet amyloid polypeptide. Am. J. Physiol. Endocrinol. Metab. 293, E1656–E1662 [DOI] [PubMed] [Google Scholar]
- 39. Takahashi Y., Coppola D., Matsushita N., Cualing H. D., Sun M., Sato Y., Liang C., Jung J. U., Cheng J. Q., Mulé J. J., Pledger W. J., Wang H. G. (2007) Bif-1 interacts with Beclin 1 through UVRAG and regulates autophagy and tumorigenesis. Nat. Cell Biol. 9, 1142–1151 [DOI] [PMC free article] [PubMed] [Google Scholar]
- 40. Brookheart R. T., Michel C. I., Schaffer J. E. (2009) As a matter of fat. Cell Metab. 10, 9–12 [DOI] [PMC free article] [PubMed] [Google Scholar]
- 41. Kim J., Cheon H., Jeong Y. T., Quan W., Kim K. H., Cho J. M., Lim Y. M., Oh S. H., Jin S. M., Kim J. H., Lee M. K., Kim S., Komatsu M., Kang S. W., Lee M. S. (2014) Amyloidogenic peptide oligomer accumulation in autophagy-deficient beta cells induces diabetes. J. Clin. Invest. 124, 3311–3324 [DOI] [PMC free article] [PubMed] [Google Scholar]
- 42. Rivera J. F., Costes S., Gurlo T., Glabe C. G., Butler P. C. (2014) Autophagy defends pancreatic beta cells from human islet amyloid polypeptide-induced toxicity. J. Clin. Invest. 124, 3489–3500 [DOI] [PMC free article] [PubMed] [Google Scholar]
- 43. Shigihara N., Fukunaka A., Hara A., Komiya K., Honda A., Uchida T., Abe H., Toyofuku Y., Tamaki M., Ogihara T., Miyatsuka T., Hiddinga H. J., Sakagashira S., Koike M., Uchiyama Y., Yoshimori T., Eberhardt N. L., Fujitani Y., Watada H. (2014) Human IAPP-induced pancreatic beta cell toxicity and its regulation by autophagy. J. Clin. Invest. 124, 3634–3644 [DOI] [PMC free article] [PubMed] [Google Scholar]
- 44. Hotamisligil G. S. (2010) Endoplasmic reticulum stress and the inflammatory basis of metabolic disease. Cell 140, 900–917 [DOI] [PMC free article] [PubMed] [Google Scholar]
- 45. Singh R., Kaushik S., Wang Y., Xiang Y., Novak I., Komatsu M., Tanaka K., Cuervo A. M., Czaja M. J. (2009) Autophagy regulates lipid metabolism. Nature 458, 1131–1135 [DOI] [PMC free article] [PubMed] [Google Scholar]
- 46. Shibata M., Yoshimura K., Tamura H., Ueno T., Nishimura T., Inoue T., Sasaki M., Koike M., Arai H., Kominami E., Uchiyama Y. (2010) LC3, a microtubule-associated protein1A/B light chain3, is involved in cytoplasmic lipid droplet formation. Biochem. Biophys. Res. Commun. 393, 274–279 [DOI] [PubMed] [Google Scholar]
- 47. Klionsky D. J., Emr S. D. (2000) Autophagy as a regulated pathway of cellular degradation. Science 290, 1717–1721 [DOI] [PMC free article] [PubMed] [Google Scholar]
- 48. Gonzalez C. D., Lee M. S., Marchetti P., Pietropaolo M., Towns R., Vaccaro M. I., Watada H., Wiley J. W. (2011) The emerging role of autophagy in the pathophysiology of diabetes mellitus. Autophagy 7, 2–11 [DOI] [PMC free article] [PubMed] [Google Scholar]
- 49. Huang C. J., Lin C. Y., Haataja L., Gurlo T., Butler A. E., Rizza R. A., Butler P. C. (2007) High expression rates of human islet amyloid polypeptide induce endoplasmic reticulum stress mediated beta-cell apoptosis, a characteristic of humans with type 2 but not type 1 diabetes. Diabetes 56, 2016–2027 [DOI] [PubMed] [Google Scholar]
- 50. Bartolome A., Guillen C., Benito M. (2012) Autophagy plays a protective role in endoplasmic reticulum stress-mediated pancreatic beta cell death. Autophagy 8, 1757–1768 [DOI] [PMC free article] [PubMed] [Google Scholar]
- 51. Quan W., Hur K. Y., Lim Y., Oh S. H., Lee J. C., Kim K. H., Kim G. H., Kim S. W., Kim H. L., Lee M. K., Kim K. W., Kim J., Komatsu M., Lee M. S. (2012) Autophagy deficiency in beta cells leads to compromised unfolded protein response and progression from obesity to diabetes in mice. Diabetologia 55, 392–403 [DOI] [PubMed] [Google Scholar]
- 52. Koyanagi M., Asahara S., Matsuda T., Hashimoto N., Shigeyama Y., Shibutani Y., Kanno A., Fuchita M., Mikami T., Hosooka T., Inoue H., Matsumoto M., Koike M., Uchiyama Y., Noda T., Seino S., Kasuga M., Kido Y. (2011) Ablation of TSC2 enhances insulin secretion by increasing the number of mitochondria through activation of mTORC1. PloS one 6, e23238. [DOI] [PMC free article] [PubMed] [Google Scholar]
- 53. Chen H., Vermulst M., Wang Y. E., Chomyn A., Prolla T. A., McCaffery J. M., Chan D. C. (2010) Mitochondrial fusion is required for mtDNA stability in skeletal muscle and tolerance of mtDNA mutations. Cell 141, 280–289 [DOI] [PMC free article] [PubMed] [Google Scholar]
- 54. Grishko V., Rachek L., Musiyenko S., Ledoux S. P., Wilson G. L. (2005) Involvement of mtDNA damage in free fatty acid-induced apoptosis. Free Radic. Biol. Med. 38, 755–762 [DOI] [PubMed] [Google Scholar]
- 55. Bachar-Wikstrom E., Wikstrom J. D., Ariav Y., Tirosh B., Kaiser N., Cerasi E., Leibowitz G. (2013) Stimulation of autophagy improves endoplasmic reticulum stress-induced diabetes. Diabetes 62, 1227–1237 [DOI] [PMC free article] [PubMed] [Google Scholar]
- 56. Shaw R. J. (2009) LKB1 and AMP-activated protein kinase control of mTOR signalling and growth. Acta Physiol. (Oxf.) 196, 65–80 [DOI] [PMC free article] [PubMed] [Google Scholar]
- 57. Teutonico A., Schena P. F., Di Paolo S. (2005) Glucose metabolism in renal transplant recipients: effect of calcineurin inhibitor withdrawal and conversion to sirolimus. J. Am. Soc. Nephrol. 16, 3128–3135 [DOI] [PubMed] [Google Scholar]