

Background: The role of the inhibitor factor, IF1, of the F1F0-ATPase complex has not been fully defined.
Results: IF1-silenced osteosarcoma cancer cells show increased mitochondrial membrane potential (Δψm) and decreased ADP-induced respiration rate.
Conclusion: IF1 plays a role in the modulation of Δψm and oxidative phosphorylation rate in osteosarcoma cells.
Significance: These data provide novel insights into the role of IF1 in tumor cells metabolism.
Keywords: ATP Synthase, Bioenergetics, Cancer, Metabolism, Mitochondria, F1F0-ATPase, IF1, Oxidative Phosphorylation
Abstract
The bioenergetics of IF1 transiently silenced cancer cells has been extensively investigated, but the role of IF1 (the natural inhibitor protein of F1F0-ATPase) in cancer cell metabolism is still uncertain. To shed light on this issue, we established a method to prepare stably IF1-silenced human osteosarcoma clones and explored the bioenergetics of IF1 null cancer cells. We showed that IF1-silenced cells proliferate normally, consume glucose, and release lactate as controls do, and contain a normal steady-state ATP level. However, IF1-silenced cells displayed an enhanced steady-state mitochondrial membrane potential and consistently showed a reduced ADP-stimulated respiration rate. In the parental cells (i.e. control cells containing IF1) the inhibitor protein was found to be associated with the dimeric form of the ATP synthase complex, therefore we propose that the interaction of IF1 with the complex either directly, by increasing the catalytic activity of the enzyme, or indirectly, by improving the structure of mitochondrial cristae, can increase the oxidative phosphorylation rate in osteosarcoma cells grown under normoxic conditions.
Introduction
Tumor cells exhibit profound genetic, biochemical, and histological differences with respect to the original non-transformed cellular types (1). The biochemical features of most fast-growing tumor cell types show a significantly modified energy metabolism that is characterized by a higher glycolytic flux (aerobic glycolysis) compared with normal cells: the so-called Warburg effect (2, 3). Indeed, different biochemical mechanisms may contribute to increasing the glycolytic rate of tumor cells, one which is the inhibition of mitochondrial ATP synthase (F1F0-ATPase)4 by the natural inhibitor protein, IF1 (4).
The inhibitor protein, a basic, heat-stable, and highly evolutionarily conserved protein, is constituted of 106 amino acids in humans (5), and is the master regulator of the ATP hydrolytic activity of the ATP synthase complex. It is well established that when the electrochemical proton gradient across the mitochondrial inner membrane collapses becoming insufficient to drive ATP synthesis, as it occurs when mitochondrial respiration is dramatically impaired, ATP synthase reverses its function and hydrolyzes ATP to restore the membrane potential (6–8). Under these conditions, cell energy metabolism is shifted toward glycolysis resulting in a significant decrease in pH that induces the inhibition of ATP synthase by IF1 (9). The pathways mediating this inhibition require the hydrolysis of two molecules of ATP by the IF1-ATP synthase complex (10). The net effect is to prevent massive glycolytic ATP depletion to protect cells from death. Indeed, using oligomycin as a specific inhibitor of ATP synthase, it has been shown that, in ischemia, a considerable fraction (30–50%) of the decline in cytoplasmic high energy phosphates is due to hydrolysis by ATP synthase working in reverse (7, 11).
Besides the well established function described above, a number of other roles have been proposed for IF1 in recent years, including involvement in ischemic preconditioning (12, 13), and in stabilizing both the dimeric form of ATP synthase and the structure of mitochondrial cristae (14, 15). A role in tumorigenesis is also suggested by the higher expression of IF1 in a number of carcinomas than in normal tissues (4, 16–19). The latter point is of peculiar interest and is worth considering further for several reasons: the binding of IF1 to ATP synthase is supposed to be strictly dependent on the environmental conditions of cells, and both acidic pH and mitochondrial membrane potential collapse seem to be required, as occurs during ischemia (6). These conditions, however, have only been marginally considered in recent studies. In addition, most of these studies were performed in cells with transient IF1 overexpression or silencing. Transient transfection results in a heterogeneous population of cells due to the coexistence of transfected and control cells. Moreover, studies on transiently transfected cells do not represent a stable steady-state metabolic condition, but a dynamic situation in which the cells are adapting to the change in IF1 content, producing potentially ambiguous biochemical data. Finally, transient transfection does not allow long-term changes to be studied. Given these restrictions, to dissipate ambiguities and clarify the contribution of the inhibitor protein to tumor cell viability and metabolism, we prepared IF1-silenced clones from the human osteosarcoma 143B cell lines and assayed the main bioenergetic parameters. The purpose of this study was to examine in stable IF1-silenced human osteosarcoma cells both the role played by IF1 and the mechanism IF1 adopts in tumor cells to regulate energy homeostasis and possibly to control mitochondrial mass, structure, and function.
EXPERIMENTAL PROCEDURES
Cell Culture, Transient Cotransfection, and Selection of Stable IF1-silenced Clones
Human osteosarcoma 143B cells were maintained in Dulbecco's modified Eagle's medium (DMEM) supplemented with 10% bovine serum, 100 units/ml of penicillin, and 100 μg/ml of streptomycin, 0.25 μg/ml of amphotericin B, 4 mm glutamine, and 1 mm pyruvate at 37 °C in a humidified atmosphere (5% CO2). For transient cotransfection we used a pCMV6-XL5-IF1 expression plasmid together with alternatively a single shRNA vector or a scrambled negative control construct cloned in a pGFP-V-RS plasmid (#1 GI325933, #2 GI325934, #3 GI325935, and #4 GI325936 and TR30013, respectively). All plasmids used were from Origene (Rockville, MD). Equal amounts of the two vectors (4 μg total DNA) were transfected overnight using polyethylenimine (PEI). After 24 h the medium was replaced with complete DMEM and the cells were cultured for a further 24 h before analyzing the level of IF1 silencing. To establish stable clones, parental 143B cells were seeded and transfected as described above with 2 μg of either GI325936 or TR30013 plasmid DNA. 48 h later, cells were split and selected for stable transformation in the presence of 1 μg/ml of puromycin, changing the medium every day. Single colonies were then subcloned by limiting dilution and finally all the clones obtained were assayed for IF1 expression.
Mitochondrial Isolation
Coupled mitochondria were isolated from cells according to the method by Kun et al. (20), modified to exclude digitonin treatment. Essentially, cell homogenates were obtained using a glass Potter-Helvehjem homogenizer with a motor-driven Teflon pestle in isolation buffer (0.22 m mannitol, 0.07 m sucrose, 0.02 m HEPES, 1 mm K-EDTA, 0.1 mm K-EGTA, pH 7.4) containing 1 mm PMSF (phenylmethanesulfonyl fluoride). Crude extracts were centrifuged at 2000 × g for 10 min (Sorvall SS34 rotor) to remove nuclei and plasma membrane fragments, and then the supernatant was centrifuged at 10,000 ]times] g for 10 min (Sorvall SS34 rotor) to obtain the mitochondrial pellet. Mitochondria were washed in 0.25 m sucrose, 0.02 m HEPES, 1 mm K-EDTA, and 0.1 mm K-EGTA, pH 7.4, and resuspended in the same buffer to a concentration of ∼10 mg/ml of protein.
Cell Growth
Cell growth was assessed after seeding 2 × 10⁵ cells in complete DMEM and culturing the cells for up to 72 h. Adherent cells were trypsinized and collected, and the growth of cell lines was assayed using the trypan blue exclusion test. Cell count was performed every 24 h without changing the medium.
SDS-PAGE and Western Blot Analysis
Osteosarcoma cellular lysates were separated by SDS-PAGE and blotted onto nitrocellulose membranes to perform semiquantitative analysis of protein content according to Baracca et al. (21). Blots of resolved proteins were incubated either with primary mouse monoclonal antibodies specific for the d-subunit of F1F0-ATPase (19 kDa) and for IF1 (12 kDa) or with a mixture of five primary mouse monoclonal antibodies specific for single subunits of each OXPHOS complex (MitoSciences Inc., Eugene, OR) as reported in Sgarbi et al. (22). Actin (42 kDa) and porin (35 kDa), used as loading controls for cells and mitochondria, respectively, were immunodetected with mouse monoclonal anti-actin (Sigma) and anti-porin (Mito-Sciences Inc., Eugene, OR) primary antibodies. Immunodetection of primary antibody was carried out with secondary goat anti-mouse IgGH+L antibody (Invitrogen) labeled with horseradish peroxidase. Chemiluminescent detection of the specific proteins was performed with the ECL Western blotting Detection Reagent Kit (GE Healthcare, Waukesha, WI) using the ChemiDoc MP system equipped with the ImageLab software (Bio-Rad) to perform the densitometric scanning of the relative protein intensity.
BN-PAGE Analysis and Western Blot Analysis
The organization of the ATP synthase complex and the binding of IF1 to the monomeric and/or oligomeric form of the enzyme were analyzed in digitonin-treated mitochondria (2.5:1 (w/w) digitonin:protein ratio) by one-dimensional blue native-PAGE (23). Following electrophoresis under non-denaturating conditions, proteins were immediately electroblotted onto nitrocellulose membranes under denaturing conditions. ATP synthase and IF1 protein bands were detected using anti-α subunit and anti-IF1 primary monoclonal antibodies (MitoSciences Inc.), respectively, and a secondary goat anti-mouse IgGH+L antibody labeled with horseradish peroxidase (Invitrogen). The immunoblots were detected and quantified by chemiluminescence using the ECL Western Blotting Detection Reagent Kit (Amersham Biosciences).
In-gel ATPase Activity
Immediately after the electrophoretic run of the protein complexes extracted from digitonin-treated mitochondria, ATPase activity was assayed on the native gel using an enzymatic colorimetric method (24). White-stained ATP synthase bands were acquired using a GS-800 densitometer (Bio-Rad) with a blue filter to minimize the interference from the residual Coomassie Blue.
Flow Cytometric Assessment
Flow cytometry of GFP positive cells was performed using a FACSaria cytometer (BD Biosciences). Excitation was at 488 nm and fluorescence emission was measured at 530/30 nm. Data acquisition and analysis was performed with BD FACSDiva and Flowing Software, respectively.
The inner mitochondrial membrane potential was measured by staining cells with 20 nm tetramethylrhodamine methyl ester (TMRM) (Molecular Probes, Eugene, OR), a lipophilic probe that enters mitochondria in a Δψm-dependent manner (25). The cells were incubated with the probe for 30 min at 37 °C in the absence or presence of 0.6 μm oligomycin and wells were then washed twice with Hanks' balanced salt solution to remove any remaining unincorporated dye. The cells were rapidly trypsinized, diluted to the optimal density (300,000 cells/ml) with Hanks' balanced salt solution supplemented with 10% FBS and immediately analyzed with the MUSE cell analyzer (Millipore, Billerica, MA). Excitation was at 532 nm and fluorescence emission was measured at 576/28 nm. Data acquisition and analysis were performed with MuseSoft Analysis and Flowing software, respectively. A total of 10,000 events were acquired for each determination.
Brightfield and Fluorescence Microscopy
Brightfield and fluorescence images of controls and IF1-silenced cells were acquired using a fluorescence inverted microscope (Olympus IX50 equipped with a CCD camera). Multiple high-power (magnification ×10 and 40) images were acquired with IAS2000 software (Delta Sistemi, Roma, Italy). Fluorescence photographs of GFP-positive cells were obtained using a specific set of filters: excitation 480/30 and emission 530/30. Mitochondrial network morphology and membrane potential were evaluated by incubating cells with 20 nm TMRM for 30 min. At least 10 different optic fields were acquired for every experimental condition tested.
Biochemical Assays
Glucose consumption and lactate release were determined in the medium of cells using the Glucose Liquid Trinder Method Kit (FAR, Verona, Italy) and Lactate PAP Fluid Kit (Centronic GmbH, Wartenberg, Germany), respectively, following the manufacturer's instructions. Data were expressed as micromole/106 cells and normalized to the number of cells present in the wells.
The ATP content of cells was assayed by a bioluminescence method using a luciferin-luciferase system (ATP bioluminescent assay kit CLS II; Roche Applied Science, Basel, Switzerland) as previously described (26). The amount of ATP measured was referred to the protein content, determined by the method of Lowry et al. (27) and expressed as nanomole/mg of protein. Citrate synthase activity was assayed as previously described (28).
The oxygen consumption rate was measured in permeabilized cells (60 μg/ml of digitonin) at 30 °C with 10 mm glutamate, 10 mm malate (plus 1.8 mm malonate) as substrate, using an oxygen Clark-type electrode as previously reported by Baracca et al. (21). State 3 and uncoupled respiration rates were measured in the presence of 0.5 mm ADP or 60 μm dinitrophenol, respectively. The NADH-dependent respiration was sensitive to rotenone.
The ATP hydrolysis assay was determined at 30 °C with an ATP regenerating system by following the decrease of NADH absorbance at 340 nm in a V-450 Jasco spectrophotometer. The assay was carried out at substrate-saturating concentration as previously reported (29). Protein concentration of samples was assessed by the method of Lowry et al. (27) in the presence of 0.3% (w/v) sodium deoxycholate. Bovine serum albumin was used as standard.
Data Analysis
Results are average ± S.D. of 4–6 samples from two independent experiments. Statistical analyses were performed using the OriginPro 7.5 software (Origin-Lab Corporation, Northampton, MA) applying the analysis of variance test followed by the Bonferroni means comparison. Statistical significance was defined by p ≤ 0.05.
RESULTS
shRNA-mediated Stable Silencing of the IF1 Inhibitor Protein in Osteosarcoma 143B Cells
To obtain stable suppression of the IF1 inhibitor protein in human osteosarcoma 143B cells, which are cancer cells expressing IF1 to a high extent (data not shown), we screened four IF1 gene-specific shRNA expression plasmids (Fig. 1A) to identify the 29-mer shRNA sequence with the most powerful IF1 silencing competence (Fig. 1, A and C). The transient cotransfection of the cells with the IF1 expression plasmid together with each shRNA construct, resulted in different efficiency of silencing, and the maximal reduction of IF1 expression (about −70%) was observed using plasmid #4 (Fig. 1B). To set up the stable transfection, the latter vector (Fig. 1C) and a scrambled plasmid were used. After 24 h of culture, the morphology of cells transfected with either the scrambled or #4 plasmid was similar and the transfection efficiency was about 30% as estimated on the basis of the GFP positive cells, GFP being encoded by each shRNA plasmid (Fig. 1D). Following puromycin selection and subcloning, several clones were obtained for both scrambled and shRNA #4 plasmids. Immunodetection of IF1 protein bands obtained by SDS-PAGE and Western blotting showed a remarkable suppression of IF1 expression in all the silenced clones (Fig. 2A). Densitometric analysis of the bands revealed that clones A7 and D9 expressed the least IF1 content (6 and 9% of the controls, respectively). The morphology of the IF1-silenced and scrambled clones was similar to that of the parental cells (Fig. 2B, upper panels). Transfection stability and cell homogeneity of IF1-silenced and scrambled clones were evaluated by both fluorescence microscopy (Fig. 2B, lower panels) and flow cytometry (Fig. 2C). Nearly all cells (99%) were found to be positive for GFP expression. Moreover, the morphology and adhesion capacity of IF1-silenced and control cells appeared indistinguishable, as shown in the brightfield microscopy images (Fig. 2B, upper panels).
FIGURE 1.

Silencing of the IF1 inhibitor protein: assessment of the most efficient shRNA sequence. A, nucleotide sequence of the four shRNA constructs, spanning the 3′ end of the IF1 mRNA, cloned in the pGFP-V-RS vector. B, immunoblot analysis of the IF1 protein level of 143B osteosarcoma cells transiently cotransfected with both the IF1 overexpression plasmid and alternatively one of the shRNA (#1–4 plasmids) or scrambled plasmids, as detailed under ”Experimental Procedures.“ C, map of plasmid #4 showing the complete sequence of the construct (target sequence, loop and reverse complementary sequence), cloned under the control of the U6 promoter, and the termination sequence TTTTTT located immediately downstream of the shRNA construct. D, brightfield and fluorescence microscopy images of 143B cells transiently transfected with either the scrambled or the sh-IF1 #4 plasmids (magnification ×10). The pictures are representative of several observations.
FIGURE 2.

Sorting of IF1-silenced clones: silencing efficacy and transfection homogeneity. A, immunoblot analysis of the IF1 protein level in parental (143B cells), scrambled clones (B3 and D1), and IF1-depleted clones (A7, B7, B8, C7, C9, D7, D9, D10). Porin and F1F0-ATPase d-subunit were both used as mitochondrial loading controls. B, brightfield and fluorescence (GFP) microscopy images of 143B cells, scrambled clone B3 and IF1-silenced clones A7 and D9 (magnification ×10). The pictures are representative of several optical fields. C, typical flow cytometry GFP-positive cells distribution in controls and IF1-depleted clones.
IF1 Silencing Does Not Affect the Viability and Proliferation Rate of Osteosarcoma Cells, nor the Main Metabolic Parameters
We first analyzed and compared the growth rate of two IF1-silenced clones with both parental and scrambled human osteosarcoma cells. The results shown in Fig. 3A indicate that under normal growth conditions the two IF1-silenced clones grow and proliferate similarly to both the parental cell line and the scrambled clone. In addition, no difference was observed between IF1 expressing or non-expressing cells in glucose consumption and lactate release after 24 h of cells growth. Incidentally, the lactate release to glucose consumption ratio was approximately two (Fig. 3, B and C). Finally, the steady-state level of cellular ATP was about 25 nmol/mg of protein in all cells analyzed, independently of IF1 content (Fig. 3D). On the basis of earlier studies on both isolated mitochondria and submitochondrial particles (30, 31), the above results were expected because cells were grown under conditions that did not favor binding and inhibition of IF1 to the F1F0-ATPase complex. Indeed, most of the above data agree with those recently reported by Fujikawa et al. (32), who analyzed the only stable IF1-depleted cell line (HeLa cells) as yet studied. However, to clarify the conflicting hypothesis on the role of IF1 in cancer cell bioenergetics, the activity of both the respiratory chain and the F1F0-ATPase complex was analyzed in both parental and IF1-silenced osteosarcoma cells.
FIGURE 3.

IF1 silencing does not change cell growth or metabolic parameters. A, cell growth of human osteosarcoma 143B cell line (black), scrambled (blue), and IF1-silenced clones (red, A7 and magenta, D9). B, glucose consumption and C, lactate release analysis performed in parental, scrambled (Scr), and IF1-silenced cells grown for 24 h. D, ATP levels measured in parental, scrambled, and IF1-silenced cells cultured for 24 h. The ATP content of each sample was normalized to the protein and expressed as nanomole/mg of protein. Bars indicate the mean ± S.D. of three independent experiments.
Bioenergetic Changes in IF1-silenced Osteosarcoma Cells
Some studies reported that overexpression of IF1 in cells promotes tumor progression by either reducing mitochondrial ATP synthase activity and increasing aerobic glycolysis (4), or inducing a Δψm decrease that is associated with enhanced proneness to apoptotic cell death by cytochrome c release from mitochondria (19, 33). In addition, Fujikawa et al. (32) reported a nearly 40% Δψm increase in IF1 null cells and proposed that it was the result of an increased ATP hydrolytic activity of the F1F0-ATPase complex under normoxic conditions. To address these conflicting issues, we first evaluated the respiratory chain activity by assaying the oxygen consumption rate in digitonin-permeabilized cells, and found that removal of IF1 from cells caused a modest (about 20%) but reproducible decrease in the ADP-induced respiration rate (state 3) (Fig. 4, A and B). At variance, no difference was observed in both state 4 and dinitrophenol uncoupled respiration rate in IF1-silenced and control cells (Fig. 4, C and D). Overall, these data indicate that the presence of the inhibitor protein in osteosarcoma 143B cells can enhance the rate of ATP synthesis via OXPHOS, and suggest that the absence of IF1 has no effect on respiratory chain activity. In addition, no significant difference was observed in the level of OXPHOS complexes between IF1-silenced and control cells (Fig. 5). On the basis of earlier studies on perfused hearts (11), this result was quite unexpected because the conditions to which the cells were exposed (normoxia and slightly basic pH) should not favor the binding of IF1 to the ATP synthase complex (34, 35). On the other hand, IF1 has been regarded as an unidirectional inhibitor of ATP hydrolysis without effects on ATP synthesis (36) at least under steady-state conditions (37). To verify whether the ATP hydrolysis rate of the ATP synthase complex showed similar behavior to those earlier reported, we tested the ATPase activity of our set of cells. Because in cells this assay cannot give reliable results due to the presence of many ATP hydrolyzing enzymes and technical restrictions, the ATP hydrolytic activity of the ATP synthase was assayed in isolated uncoupled mitochondria (Fig. 6). As expected, the oligomycin-sensitive ATPase activity of mitochondria was pH sensitive (31, 38), being at pH 6.7 about half than at pH 7.4. As expected and in accord with previous data obtained from organ extracts and the isolated enzyme, the oligomycin-sensitive ATPase activity of mitochondria from IF1-silenced cells resulted in being 2–3- and 4–5-fold higher than in controls at pH 7.4 and 6.7, respectively. Incidentally, the latter data match those reported by Cabezon et al. (35) analyzing the pH dependence of the isolated IF1-F1-ATPase complex activity.
FIGURE 4.

Mitochondrial respiration changes in IF1-depleted cells. A, typical Complex I-driven oxygen consumption traces obtained in digitonin-permeabilized cells after energizing mitochondria with glutamate/malate, followed by addition of ADP and oligomycin A. Parental (black line), scrambled (blue line), and IF1-depleted cells (red and magenta lines) were represented. State 3 (B), state 4 (C), and uncoupled (D) respiration rate, expressed as nanomole of O2/min/mg of protein, were represented. Histograms show the mean ± S.D. of three independent experiments. *, p < 0.05 indicates the statistical significance of data compared with both parental and scrambled cells.
FIGURE 5.

Immunodetection of OXPHOS complexes after SDS-PAGE separation in parental, scrambled, and IF1-silenced cells. A, typical electrophoretic separation and immunodetection of OXPHOS complex subunits in cell lysates of IF1-silenced cells. B, scanned images were quantitated using Image Lab Software and data were normalized with respect to the porin content, taken as an internal standard. Relative protein levels of OXPHOS subunits were expressed as arbitrary units. The histograms show the mean ± S.D. of two independent experiments.
FIGURE 6.
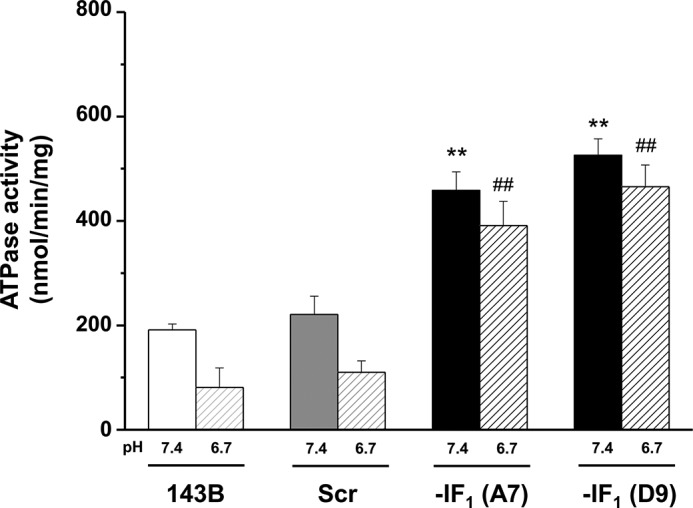
Oligomycin-sensitive ATP hydrolysis activity in IF1-depleted cells. Oligomycin-sensitive ATP hydrolysis activity measured in mitochondria isolated from controls and IF1-silenced clones. Mitochondria were isolated using different buffers at either pH 7.4 (filled bars) or 6.7 (hashed bars) during the extraction procedure. Histograms showing the mean ± S.D. of three independent experiments. **, p < 0.01 and ##, p < 0.01 indicates the statistical significance of data compared with both parental and scrambled mitochondria isolated at pH 7.4 and 6.7, respectively.
Mitochondrial Membrane Potential of IF1-silenced Cells Is Higher Compared with Parental Cells
Given the different bioenergetic behavior of IF1-silenced cells compared with controls, we measured the Δψm of all cell types by examining the fluorescence of TMRM-loaded cells. Fig. 7A shows typical images of the four types of cells observed by fluorescence microscopy. The fluorescence intensity of IF1-silenced cells was higher than controls, indicating a higher endogenous Δψm. These results were assessed and quantified by flow cytometry and representative cell fluorescence distribution is reported in Fig. 7B. The mean fluorescence values of IF1-silenced cells was nearly 30% higher than in control cells, and no difference was observed between IF1-silenced clones and controls upon the addition of oligomycin (Fig. 7, B and C), indicating that the endogenous steady-state Δψm of the IF1-silenced cells is significantly increased compared with controls, but is still far below its maximum (i.e. when cells are exposed to oligomycin). Incidentally, the mitochondrial mass of all the cells types was similar, as determined by the citrate synthase assay (Fig. 7D). These unexpected, but somehow intriguing results pushed us to analyze whether IF1 was bound to the F1F0-ATPase complex and eventually to which form of the enzyme (i.e. monomeric and/or oligomeric).
FIGURE 7.

IF1 silencing enhances the mitochondrial membrane potential in human osteosarcoma cells. A, parental, scrambled, and IF1-depleted cells were loaded with 20 nm TMRM and fluorescence images were obtained using an inverted fluorescence microscope (magnification ×40). B, flow cytometry analysis of cellular populations stained with TMRM, in the absence (yellow) or presence (brown) of oligomycin. C, histogram graph showing the flow cytometry semiquantitative evaluation of the mitochondrial membrane potential of controls and IF1-depleted cells in the absence (filled bars) or presence (dashed bars) of oligomycin. Bars show the mean ± S.D. of six independent experiments; **, p < 0.01 indicates the statistical significance of data compared with controls. D, citrate synthase activity expressed as nanomole/min/mg of protein. Bars show the mean ± S.D. of five independent experiments.
The Inhibitor Protein IF1 Binds to the ATP Synthase Complex in Its Dimeric Form
The ATP synthase complex has been shown to be present in dimers in mitochondria from several species (see Ref. 39 for a recent review). The choice and quality of the detergent and the conditions used to solubilize the ATP synthase complex is critical if oligomerization of the enzyme has to be studied (40). Indeed, on the basis of an empirical evaluation, to disaggregate the inner mitochondrial membrane, we chose a 2.5:1 (w/w) digitonin:protein ratio (Fig. 8A), and results were also confirmed when digitonin was used to extract the ATP synthase oligomers directly from cells (data not shown). Noteworthy, IF1 binds exclusively to the ATP synthase complexes even when a higher digitonin:protein ratio is used to extract proteins from mitochondria (Fig. 8B).
FIGURE 8.
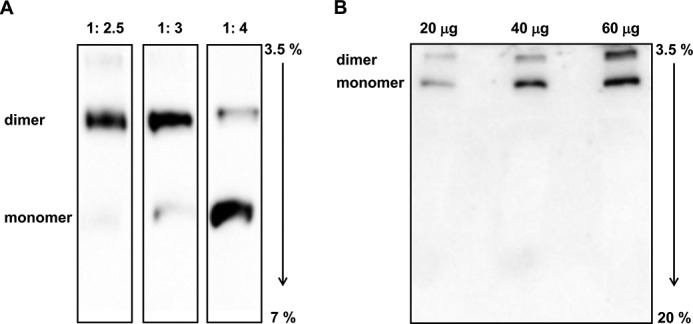
BN-PAGE and immunoblotting analysis of IF1-ATP synthase complexes in parental cells. A, representative immunodetection of IF1 bound to the different forms of ATP synthase when different digitonin:protein ratio were used. Immunodetection of IF1 was performed after separation of dimeric and monomeric ATP synthase by BN-PAGE (3.5–7% gradient) followed by blotting onto nitrocellulose membrane. B, typical immunoblotting analysis showing the specificity of IF1 binding to ATP synthase complexes in mitochondria of parental cells. Mitochondria were exposed to 3.5:1 (w/w) digitonin:protein ratio and the extract was applied to a 3.5–20% polyacrylmide gradient gel. Three different protein loading amounts were analyzed.
Fig. 9A shows the in-gel ATPase activity of the F1F0-ATPase complex following blue native-gel electrophoretic separation of the digitonin-extracted proteins. It is clearly seen that both monomers and dimers are ATP hydrolysis competent. The blotted ATP synthase protein bands were immunodetected and quantified using an α-subunit monoclonal antibody (Fig. 9B): the ATP synthase complex from all different cells distribute similarly between the monomeric (53–58%) and dimeric (42–47%) forms, as quantitatively shown in Fig. 9D. This occurred independently of the presence of IF1, as confirmed in Fig. 9C. Indeed, immunodetection of IF1 clearly indicates that the main target of IF1 is the dimeric form of the ATP synthase in controls, and, as expected, no band was observed in IF1-silenced cells.
FIGURE 9.

The inhibitor protein does not affect the dimerization of ATP synthase. A, representative in-gel activity staining of the monomeric and oligomeric ATP synthase forms extracted from digitonin-treated mitochondria of parental, scrambled, and IF1-depleted cells and separated by BN-PAGE. B, monomeric and oligomeric distribution analysis of the ATP synthase performed by immunodetection of the F1 α-subunit after separation of the proteins by BN-PAGE, followed by blotting of the native complexes onto nitrocellulose membrane. C, immunoblot analysis of the IF1 binding to the ATP synthase complexes. The same amount of protein used in panels A and B were loaded. D, histograms represent the densitometric analysis of the monomer (dark bar) and dimer (gray bar) of the ATP synthase complex immunodetected and shown in panel B. The representative data were confirmed in three independent experiments.
DISCUSSION
The main findings of the present study are: first, IF1 does not affect the mitochondrial volume nor the level of dimeric F1F0-ATPase in human osteosarcoma cells; second, IF1-silenced cells have a reproducibly higher Δψm associated with a lower respiration rate than parental cells; and third, IF1 has a higher affinity for the dimeric form of ATP synthase than the monomeric form. Moreover, we report the method to prepare stable IF1-silenced clones from human osteosarcoma cells. Indeed, a brief comment on this point is that the transient transfection efficiency of osteosarcoma cells by using either the scrambled or the #4 plasmid was about 30% and upon puromycin selection and subcloning, stable transfected clones were obtained. The IF1 content of most of the silenced clones was found to be strongly reduced (90–95%) compared with parental cells and the silencing is still present after two years of cells cycling.
An intriguing paper (41) recently published reports that the mitochondrial volume of HeLa cells is regulated by IF1. This work was based on the analysis of cells in which IF1 was transiently either overexpressed or silenced: in the former case a higher mitochondrial volume was described and the lower mitochondrial volume found in the presence of reduced IF1 level was ascribed to enhanced autophagy compared with controls. However, Fujikawa et al. (32) did not observe any difference between IF1 knockdown and control HeLa cells. Accordingly, in the present study, the mitochondrial content of osteosarcoma cells was found unchanged in IF1-silenced clones and in controls, as assessed by measuring citrate synthase activity and by comparing the porin content of cells following electrophoretic separation of proteins by SDS-PAGE and immunoblotting (Figs. 2A and 5).
This investigation clarifies previous conflicting data concerning the difference between the main bioenergetic parameters of human cancer cells containing high levels of IF1 protein and stable null IF1 clones. Under normal conditions (i.e. normoxia) in which the inhibitor protein is not supposed to inhibit the ATP hydrolytic activity of the enzyme, the silenced IF1 cells exhibited the same growth, glucose consumption, and steady-state ATP levels as control cells. These results were expected on the basis of earlier studies mostly obtained analyzing organs in perfusion (11) or isolated mitochondria from heart (7) or liver (42) exposed to ischemic conditions. However, the IF1-silenced osteosarcoma cells also showed some intriguing features, including: reduced state 3 respiration rate, enhanced Δψm, and similar presence of dimeric ATP synthase compared with controls, the latter implying that IF1 does not contribute to inducing ATP synthase dimerization.
In the last decade, this issue has been addressed in a number of studies by means of different approaches and techniques. García et al. (14) studied different higher eukaryotic cells and proposed that IF1 promotes dimerization of the ATP synthase. Accordingly, Campanella et al. (19) reported that IF1 transiently overexpressed in HeLa cells enhanced the dimeric:monomeric ATP synthase ratio. However, the dimer:monomer ratio of the current study carried out in permanently IF1-silenced clones definitely shows that it is independent of the IF1 presence as previously proposed by Tomasetig et al. (43), in bovine heart mitochondria.
The increased Δψm of IF1-silenced osteosarcoma 143B cells studied in the present work matches the results recently reported analyzing stable IF1-silenced HeLa cells (32), but our data are in contrast with those reported by Sanchez-Cenizo et al. (4), who found increased Δψm in different carcinoma cell lines overexpressing IF1. We believe that the latter result may be only apparent due to the transient overexpression of IF1 that results in heterogeneous population of cells carrying different IF1 expression levels. However, we cannot exclude that different types of cancer cells as used in Ref. 4 behave differently from HeLa (19, 32) and osteosarcoma cells.
According to Fujikawa et al. (32), the significantly higher steady-state Δψm level found in IF1-silenced cells than in controls was somewhat expected because it might be due to the presence of F1F0-ATPase complexes that reverse the physiological activity and hydrolyze ATP in an uncontrolled manner. Therefore, more ATP hydrolysis occurs in the absence of IF1 than in its presence, setting a higher steady-state Δψm. Nevertheless, this hypothesis is not supported by some of our results, including the same glucose consumption and the same steady-state ATP level measured in IF1-silenced and control cells. Moreover, we observed that the Δψm of both IF1-silenced and control cells increased and reached the same level when exposed to 0.6 μm oligomycin (Fig. 7, B and C), a concentration capable of selectively inhibiting ATP synthase in cells (44). According to a recent report (45), when ATP hydrolysis significantly contributes to the maintenance of Δψm, the addition of oligomycin results in a Δψm collapse even in the presence of IF1. The observed higher Δψm shown by IF1-silenced cells compared with controls appears somehow intriguing because in normoxia IF1 should not affect F1F0-ATPase unless uncoupled conditions are considered (32, 46), therefore the enhanced Δψm seen in IF1-silenced cells deserves a different explanation.
First, it has been reported that besides binding the β subunit of F1, IF1 can bind another protein of low Mr of the inner mitochondrial membrane (47) and this might lead to Δψm enhancement in respiring mitochondria. This hypothesis does not seem acceptable because native PAGE analysis in our hand never showed the inhibitor protein in bands other than the IF1-ATP synthase complexes (Fig. 8B). A second possibility might originate from a recent study showing that dimers of the F1F0-ATPase incorporated into lipid bilayers form channels with the key features of the mitochondrial permeability transition pore (48). Indeed, one might speculate that the absence of IF1 could dysregulate the opening of the pore, resulting in a steady-state Δψm higher than in controls. Finally, it could be that the lack of IF1 decreases the dimeric form of the ATP synthase complex (19), and this might reduce the enzyme activity that in turn results in a higher Δψm in OXPHOS competent mitochondria. However, this is not the case because the distribution of ATP synthase between the dimeric and monomeric forms was found to be similar in IF1-silenced and control cells (Fig. 9B). If we now recall that the respiration rate under ADP phosphorylating conditions was higher in controls than in IF1-silenced cells, our data altogether suggest that IF1 can enhance the ATP synthesis rate via OXPHOS. This might occur through a direct interaction of IF1 with the ATP synthase at the αβ interface, as it has been proposed to occur as the first step of the inhibitory pathway described by Bason et al. (10), or IF1 might bind the ATP synthase complex at a different site that, however, should favor catalysis by enhancing the rate of ATP release once it has been formed (49). Finally, another possibility that we are at present exploring, is that the binding of IF1 to ATP synthase contributes to the modeling of mitochondrial cristae, as suggested by Campanella et al. (19), and this could in turn increase the OXPHOS rate.
Acknowledgment
We thank Dr. Kerry J. Rhoden for careful reading of this manuscript.
This work was supported by Ministero dell'Istruzione, dell'Università e della Ricerca, MIUR, Italy Grant PRIN2010-11 20107Z8XBW.
- F1F0-ATPase
- ATP synthase complex
- TMRM
- tetramethylrhodamine methyl ester
- IF1
- natural inhibitor protein of ATP synthase complex
- OXPHOS
- oxidative phosphorylation.
REFERENCES
- 1. Hanahan D., Weinberg R. A. (2011) Hallmarks of cancer: the next generation. Cell 144, 646–674 [DOI] [PubMed] [Google Scholar]
- 2. Frezza C., Gottlieb E. (2009) Mitochondria in cancer: not just innocent bystanders. Semin. Cancer Biol. 19, 4–11 [DOI] [PubMed] [Google Scholar]
- 3. Moreno-Sánchez R., Rodríguez-Enríquez S., Marín-Hernández A., Saavedra E. (2007) Energy metabolism in tumor cells. FEBS J. 274, 1393–1418 [DOI] [PubMed] [Google Scholar]
- 4. Sánchez-Cenizo L., Formentini L., Aldea M., Ortega A. D., García-Huerta P., Sánchez-Aragó M., Cuezva J. M. (2010) Up-regulation of the ATPase inhibitory factor 1 (IF1) of the mitochondrial H+-ATP synthase in human tumors mediates the metabolic shift of cancer cells to a Warburg phenotype. J. Biol. Chem. 285, 25308–25313 [DOI] [PMC free article] [PubMed] [Google Scholar]
- 5. Ichikawa N., Ushida S., Kawabata M., Masazumi Y. (1999) Nucleotide sequence of cDNA coding the mitochondrial precursor protein of the ATPase inhibitor from humans. Biosci. Biotechnol. Biochem. 63, 2225–2227 [DOI] [PubMed] [Google Scholar]
- 6. Harris D. A., Das A. M. (1991) Control of mitochondrial ATP synthesis in the heart. Biochem. J. 280, 561–573 [DOI] [PMC free article] [PubMed] [Google Scholar]
- 7. Rouslin W. (1991) Regulation of the mitochondrial ATPase in situ in cardiac muscle: role of the inhibitor subunit. J. Bioenerg. Biomembr. 23, 873–888 [DOI] [PubMed] [Google Scholar]
- 8. Di Lisa F., Bernardi P. (1998) Mitochondrial function as a determinant of recovery or death in cell response to injury. Mol. Cell. Biochem. 184, 379–391 [PubMed] [Google Scholar]
- 9. Solaini G., Harris D. A. (2005) Biochemical dysfunction in heart mitochondria exposed to ischaemia and reperfusion. Biochem. J. 390, 377–394 [DOI] [PMC free article] [PubMed] [Google Scholar]
- 10. Bason J. V., Montgomery M. G., Leslie A. G., Walker J. E. (2014) Pathway of binding of the intrinsically disordered mitochondrial inhibitor protein to F1-ATPase. Proc. Natl. Acad. Sci. U.S.A. 111, 11305–11310 [DOI] [PMC free article] [PubMed] [Google Scholar]
- 11. Jennings R. B., Reimer K. A., Steenbergen C. (1991) Effect of inhibition of the mitochondrial ATPase on net myocardial ATP in total ischemia. J. Mol. Cell. Cardiol. 23, 1383–1395 [DOI] [PubMed] [Google Scholar]
- 12. Bosetti F., Yu G., Zucchi R., Ronca-Testoni S., Solaini G. (2000) Myocardial ischemic preconditioning and mitochondrial F1F0-ATPase activity. Mol. Cell. Biochem. 215, 31–37 [DOI] [PubMed] [Google Scholar]
- 13. Formentini L., Pereira M. P., Sánchez-Cenizo L., Santacatterina F., Lucas J. J., Navarro C., Martínez-Serrano A., Cuezva J. M. (2014) In vivo inhibition of the mitochondrial H+-ATP synthase in neurons promotes metabolic preconditioning. EMBO J. 33, 762–778 [DOI] [PMC free article] [PubMed] [Google Scholar]
- 14. García J. J., Morales-Ríos E., Cortés-Hernandez P., Rodríguez-Zavala J. S. (2006) The inhibitor protein (IF1) promotes dimerization of the mitochondrial F1F0-ATP synthase. Biochemistry 45, 12695–12703 [DOI] [PubMed] [Google Scholar]
- 15. Strauss M., Hofhaus G., Schröder R. R., Kühlbrandt W. (2008) Dimer ribbons of ATP synthase shape the inner mitochondrial membrane. EMBO J. 27, 1154–1160 [DOI] [PMC free article] [PubMed] [Google Scholar]
- 16. Luciaková K., Kuzela S. (1984) Increased content of natural ATPase inhibitor in tumor mitochondria. FEBS Lett. 177, 85–88 [DOI] [PubMed] [Google Scholar]
- 17. Capuano F., Guerrieri F., Papa S. (1997) Oxidative phosphorylation enzymes in normal and neoplastic cell growth. J. Bioenerg. Biomembr. 29, 379–384 [DOI] [PubMed] [Google Scholar]
- 18. Bravo C., Minauro-Sanmiguel F., Morales-Ríos E., Rodríguez-Zavala J. S., García J. J. (2004) Overexpression of the inhibitor protein IF1 in AS-30D hepatoma produces a higher association with mitochondrial F1F0-ATP synthase compared to normal rat liver: functional and cross-linking studies. J. Bioenerg. Biomembr. 36, 257–264 [DOI] [PubMed] [Google Scholar]
- 19. Campanella M., Casswell E., Chong S., Farah Z., Wieckowski M. R., Abramov A. Y., Tinker A., Duchen M. R. (2008) Regulation of mitochondrial structure and function by the F1F0-ATPase inhibitor protein, IF1. Cell Metab. 8, 13–25 [DOI] [PubMed] [Google Scholar]
- 20. Kun E., Kirsten E., Piper W. N. (1979) Stabilization of mitochondrial functions with digitonin. Methods Enzymol. 55, 115–118 [DOI] [PubMed] [Google Scholar]
- 21. Baracca A., Chiaradonna F., Sgarbi G., Solaini G., Alberghina L., Lenaz G. (2010) Mitochondrial Complex I decrease is responsible for bioenergetic dysfunction in K-ras transformed cells. Biochim. Biophys. Acta 1797, 314–323 [DOI] [PubMed] [Google Scholar]
- 22. Sgarbi G., Matarrese P., Pinti M., Lanzarini C., Ascione B., Gibellini L., Dika E., Patrizi A., Tommasino C., Capri M., Cossarizza A., Baracca A., Lenaz G., Solaini G., Franceschi C., Malorni W., Salvioli S. (2014) Mitochondria hyperfusion and elevated autophagic activity are key mechanisms for cellular bioenergetic preservation in centenarians. Aging 6, 296–310 [DOI] [PMC free article] [PubMed] [Google Scholar]
- 23. Solaini G., Sgarbi G., Baracca A. (2011) Oxidative phosphorylation in cancer cells. Biochim. Biophys. Acta 1807, 534–542 [DOI] [PubMed] [Google Scholar]
- 24. Zerbetto E., Vergani L., Dabbeni-Sala F. (1997) Quantification of muscle mitochondrial oxidative phosphorylation enzymes via histochemical staining of blue native polyacrylamide gels. Electrophoresis 18, 2059–2064 [DOI] [PubMed] [Google Scholar]
- 25. Borsi E., Perrone G., Terragna C., Martello M., Dico A. F., Solaini G., Baracca A., Sgarbi G., Pasquinelli G., Valente S., Zamagni E., Tacchetti P., Martinelli G., Cavo M. (2014) Hypoxia inducible factor-1α as a therapeutic target in multiple myeloma. Oncotarget 5, 1779–1792 [DOI] [PMC free article] [PubMed] [Google Scholar]
- 26. Baracca A., Sgarbi G., Padula A., Solaini G. (2013) Glucose plays a main role in human fibroblasts adaptation to hypoxia. Int. J. Biochem. Cell Biol. 45, 1356–1365 [DOI] [PubMed] [Google Scholar]
- 27. Lowry O. H., Rosebrough N. J., Farr A. L., Randall R. J. (1951) Protein measurement with the Folin phenol reagent. J. Biol. Chem. 193, 265–275 [PubMed] [Google Scholar]
- 28. Sgarbi G., Giannone F., Casalena G. A., Baracca A., Baldassare M., Longobardi P., Caraceni P., Derenzini M., Lenaz G., Trerè D., Solaini G. (2011) Hyperoxia fully protects mitochondria of explanted livers. J. Bioenerg. Biomembr. 43, 673–682 [DOI] [PubMed] [Google Scholar]
- 29. Solaini G., Baracca A., Parenti Castelli G., Strambini G. B. (1993) Tryptophan phosphorescence as a structural probe of mitochondrial F1-ATPase ϵ-subunit. Eur. J. Biochem. 214, 729–734 [DOI] [PubMed] [Google Scholar]
- 30. Barogi S., Baracca A., Parenti Castelli G., Bovina C., Formiggini G., Marchetti M., Solaini G., Lenaz G. (1995) Lack of major changes in ATPase activity in mitochondria from liver, heart, and skeletal muscle of rats upon ageing. Mech. Ageing Dev. 84, 139–150 [DOI] [PubMed] [Google Scholar]
- 31. Solaini G., Baracca A., Gabellieri E., Lenaz G. (1997) Modification of the mitochondrial F1-ATPase epsilon subunit, enhancement of the ATPase activity of the IF1-F1complex and IF1-binding dependence of the conformation of the ϵ subunit. Biochem. J. 327, 443–448 [DOI] [PMC free article] [PubMed] [Google Scholar]
- 32. Fujikawa M., Imamura H., Nakamura J., Yoshida M. (2012) Assessing actual contribution of IF1, inhibitor of mitochondrial F0F1, to ATP homeostasis, cell growth, mitochondrial morphology, and cell viability. J. Biol. Chem. 287, 18781–18787 [DOI] [PMC free article] [PubMed] [Google Scholar]
- 33. Faccenda D., Tan C. H., Duchen M. R., Campanella M. (2013) Mitochondrial IF1 preserves cristae structure to limit apoptotic cell death signaling. Cell Cycle 12, 2530–2532 [DOI] [PMC free article] [PubMed] [Google Scholar]
- 34. Lippe G., Sorgato M. C., Harris D. A. (1988) The binding and release of the inhibitor protein are governed independently by ATP and membrane potential in ox-heart submitochondrial vesicles. Biochim. Biophys. Acta 933, 1–11 [DOI] [PubMed] [Google Scholar]
- 35. Cabezon E., Butler P. J., Runswick M. J., Walker J. E. (2000) Modulation of the oligomerization state of the bovine F1-ATPase inhibitor protein, IF1, by pH. J. Biol. Chem. 275, 25460–25464 [DOI] [PubMed] [Google Scholar]
- 36. Horstman L. L., Racker E. (1970) Partial resolution of the enzyme catalyzing oxidative phosphorylation: XXII. interaction between mitochondrial adenosine triphosphatase inhibitor and mitochondrial adenosine triphosphatase. J. Biol. Chem. 245, 1336–1344 [PubMed] [Google Scholar]
- 37. Husain I., Jackson P. J., Harris D. A. (1985) Interaction between F1-ATPase and its naturally occurring inhibitor protein. Studies using a specific anti-inhibitor antibody. Biochim. Biophys. Acta 806, 64–74 [DOI] [PubMed] [Google Scholar]
- 38. Baracca A., Degli Esposti M., Parenti Castelli G., Solaini G. (1992) Purification and characterization of adenosine triphosphatase from eel liver mitochondria. Comp. Biochem. Physiol. 101B, 421–426 [Google Scholar]
- 39. Chaban Y., Boekema E. J., Dudkina N. V. (2014) Structures of mitochondrial oxidative phosphorylation supercomplexes and mechanisms for their stabilisation. Biochim. Biophys. Acta 1837, 418–426 [DOI] [PubMed] [Google Scholar]
- 40. Bisetto E., Comelli M., Salzano A. M., Picotti P., Scaloni A., Lippe G., Mavelli I. (2013) Proteomic analysis of F1F0-ATP synthase super-assembly in mitochondria of cardiomyoblasts undergoing differentiation to the cardiac lineage. Biochim. Biophys. Acta 1827, 807–816 [DOI] [PubMed] [Google Scholar]
- 41. Campanella M., Seraphim A., Abeti R., Casswell E., Echave P., Duchen M. R. (2009) IF1, the endogenous regulator of the F1F0-ATP synthase, defines mitochondrial volume fraction in HeLa cells by regulating autophagy. Biochim. Biophys. Acta 1787, 393–401 [DOI] [PubMed] [Google Scholar]
- 42. Schwerzmann K., Pedersen P. L. (1981) Proton–adenosinetriphosphatase complex of rat liver mitochondria: effect of energy state on its interaction with the adenosinetriphosphatase inhibitory peptide. Biochemistry 20, 6305–6311 [DOI] [PubMed] [Google Scholar]
- 43. Tomasetig L., Di Pancrazio F., Harris D. A., Mavelli I., Lippe G. (2002) Dimerization of F0F1ATP synthase from bovine heart is independent from the binding of the inhibitor protein IF1. Biochim. Biophys. Acta 1556, 133–141 [DOI] [PubMed] [Google Scholar]
- 44. Solaini G., Harris D. A., Lenaz G., Sgarbi G., Baracca A. (2008) The study of the pathogenic mechanism of mitochondrial diseases provides information on basic bioenergetics. Biochim. Biophys. Acta 1777, 941–945 [DOI] [PubMed] [Google Scholar]
- 45. Porcelli A. M., Angelin A., Ghelli A., Mariani E., Martinuzzi A., Carelli V., Petronilli V., Bernardi P., Rugolo M. (2009) Respiratory complex I dysfunction due to mitochondrial DNA mutations shifts the voltage threshold for opening of the permeability transition pore toward resting levels. J. Biol. Chem. 284, 2045–2052 [DOI] [PubMed] [Google Scholar]
- 46. Walker J. E. (2013) The ATP synthase: the understood, the uncertain and the unknown. Biochem. Soc. Trans. 41, 1–16 [DOI] [PubMed] [Google Scholar]
- 47. Lopez-Mediavilla C., Vigny H., Godinot C. (1993) Docking the mitochondrial inhibitor protein IF1 to a membrane receptor different from the F1-ATPase β subunit. Eur. J. Biochem. 215, 487–496 [DOI] [PubMed] [Google Scholar]
- 48. Giorgio V., von Stockum S., Antoniel M., Fabbro A., Fogolari F., Forte M., Glick G. D., Petronilli V., Zoratti M., Szabó I., Lippe G., Bernardi P. (2013) Dimers of mitochondrial ATP synthase form the permeability transition pore. Proc. Natl. Acad. Sci. U.S.A. 110, 5887–5892 [DOI] [PMC free article] [PubMed] [Google Scholar]
- 49. Boyer P. D. (1997) The ATP synthase: a splendid molecular machine. Annu. Rev. Biochem. 66, 717–749 [DOI] [PubMed] [Google Scholar]