Background: Glucose uptake in adipocytes is largely mediated by GLUT4 and is impaired in type 2 diabetics.
Results: ZFP407 regulates expression of GLUT4 and other peroxisome proliferator-activated receptor γ target genes.
Conclusion: ZFP407 regulates insulin-stimulated glucose uptake by altering the levels of GLUT4.
Significance: ZFP407 represents a new therapeutic target for type 2 diabetes.
Keywords: Adipocyte, Glucose Transport, Glucose Transporter Type 4 (GLUT4), Insulin, mRNA Decay, Peroxisome Proliferator-activated Receptor (PPAR), Transcription Regulation, Type 2 Diabetes, Zinc Finger
Abstract
The glucose transporter GLUT4 facilitates insulin-stimulated glucose uptake in peripheral tissues including adipose, muscle, and heart. GLUT4 function is impaired in obesity and type 2 diabetes leading to hyperglycemia and an increased risk of cardiovascular disease and neuropathy. To better understand the regulation of GLUT4 function, a targeted siRNA screen was performed and led to the discovery that ZFP407 regulates insulin-stimulated glucose uptake in adipocytes. The decrease in insulin-stimulated glucose uptake due to ZFP407 deficiency was attributed to a reduction in GLUT4 mRNA and protein levels. The decrease in GLUT4 was due to both decreased transcription of Glut4 mRNA and decreased efficiency of Glut4 pre-mRNA splicing. Interestingly, ZFP407 coordinately regulated this decrease in transcription with an increase in the stability of Glut4 mRNA, resulting in opposing effects on steady-state Glut4 mRNA levels. More broadly, transcriptome analysis revealed that ZFP407 regulates many peroxisome proliferator-activated receptor (PPAR) γ target genes beyond Glut4. ZFP407 was required for the PPARγ agonist rosiglitazone to increase Glut4 expression, but was not sufficient to increase expression of a PPARγ target gene reporter construct. However, ZFP407 and PPARγ co-overexpression synergistically activated a PPARγ reporter construct beyond the level of PPARγ alone. Thus, ZFP407 may represent a new modulator of the PPARγ signaling pathway.
Introduction
Insulin-stimulated glucose uptake in adipocytes is important for maintaining whole body glucose homeostasis and insulin sensitivity (1–3). This process is largely mediated by Glut4 (solute carrier family 2, member 4; Slc2a4), which is the major insulin-responsive glucose transporter in adipocytes. Decreased levels of GLUT4 or impairment of its ability to traffic to the plasma membrane are major factors underlying the hyperglycemia associated with insulin resistance and type 2 diabetes (T2D)3 (4). As hyperglycemia is a significant cause of morbidity and mortality, GLUT4 and the molecules that regulate GLUT4 represent attractive targets for the treatment or prevention of T2D (5). Importantly, even modest increases in GLUT4 levels lead to improved metabolic phenotypes (6).
The mechanisms regulating GLUT4 function are highly evolutionarily conserved (7, 8), suggesting that experiments utilizing model organisms represent a powerful approach for studying GLUT4 function. We therefore utilized a prior genome-wide genetic screen in Caenorhabditis elegans to guide an siRNA screen in mammalian adipocytes to identify regulators of insulin-stimulated glucose uptake and GLUT4 function. The C. elegans screen identified genes with a synthetic lethal interaction with Rap1 (9), which is a small Ras-like GTPase that functions in cell adhesion, proliferation, secretion, and cell-cell interactions (10). Eight genes that genetically interacted with Rap1 were identified, including homologs of v-ral simian leukemia viral oncogene homolog A (RalA)/v-ral simian leukemia viral oncogene homolog B (RalB), exocyst complex component 8 (Exoc8), and ARP10 actin-related protein 10 (Actr10), each of which regulates glucose uptake and GLUT4 trafficking in adipocytes (11–14). We therefore hypothesized that the remaining genes identified in the screen may also regulate GLUT4 function. Our data demonstrate that one such gene, zinc finger protein 407 (Zfp407), regulates the levels of Glut4 transcription and mRNA stability.
EXPERIMENTAL PROCEDURES
Materials
Insulin (catalogue number I5523), dexamethasone (D1756), 3-isobutyl-1-methylxanthine (I5879), 2-deoxy-d-glucose (2-DG) (D6134), actinomycin D (A1410), and fetal bovine serum (FBS) (F2442) were obtained from Sigma. 2-[14C]Deoxy-d-glucose (ARC 0112A) was obtained from American Radiolabeled Chemical (St. Louis, MO). Rosiglitazone maleate (71740) and T0070907 (10026) were obtained from Cayman Chemical (Ann Arbor, MI). Newborn calf serum (16010-159), high-glucose DMEM (11965-092), l-glutamine/Pen/Strep (10378-016), 0.05% trypsin-EDTA (25300–054), 0.25% trypsin-EDTA (25200-056), and trypan blue solution, 0.4% (15250-061), were obtained from Invitrogen.
Cell Culture
3T3-L1 cells were passaged, differentiated, and electroporated as previously described (15). 3T3-L1 cells stably expressing myc-GLUT4-GFP were previously described (16).
siRNA-mediated Knockdowns
Custom Stealth RNAi siRNAs (Table 1) were designed using the BLOCK-iT RNAi designer (Invitrogen). A medium GC content siRNA (12935-300, Invitrogen) was used as the negative control. Differentiated 3T3-L1 adipocytes were electroporated with 0.75 nmol of siRNAs per ∼1.5 × 10⁷ cells between 2 and 4 days after differentiation as described (15). All siRNA experiments were performed 4 days following electroporation (6–8 days following differentiation) to allow time for the siRNA knockdown to take effect.
TABLE 1.
Sequence of siRNAs
| Gene | Sense sequence (5′ → 3′) |
|---|---|
| Zfp36 #1 | UCCCUCGGAGGACUUUGGAACAUAA |
| Zfp36 #2 | UUUCUGAGUAGGUCCGACAGAGCUC |
| Zfp407 #1 | UGCCACUUAUGUGAUAGAAGUUUCA |
| Zfp407 #2 | UGACGAGUCAAGUGUGACUGGGUUG |
| Zfp407 #3 | CAUGGUUUCUGGCAUCUCCAAGCUG |
| Slc2a4 (Glut4) | UGAAACCCAGUACAGAACUUGAAUA |
| Ppp2r2a #1 | UCAUGUACCUGGUAUGUCUCCACGG |
| Ppp2r2a #2 | GCCCACACUUAUCACAUCAACUCAA |
| Dusp8 #1 | CGGACUUCAUCUGUGAGAGCCGUUU |
| Dusp8 #2 | GAGGAAGGUGAUGGACGCAAAGAAA |
| Chmp1b #1 | UAUUCUUGCAACUUCUGUAUUGCCC |
| Chmp1b #2 | GACAGGGUCUGUUGGUGCAAGUGUU |
| Actr10 #1 | CAGGAGAAACUGGUCCACGAUGUAU |
| Actr10 #2 | GAGGAGAAGUCAGUUGCCACUUUAA |
Insulin-stimulated Glucose Uptake Assay
3T3-L1 cells were starved in 0.5% FBS for greater than 3 h prior to insulin stimulation. 2-DG uptake was measured as described (15).
Western Blotting and Antibodies
Western blotting was performed as described (17) and quantified using ImageJ (18). Anti-GLUT4 (2213), anti-pAKT473 (9271), anti-AKT (9272), anti-PPARγ (2443), anti-FABP4 (2120), and anti-PLIN1 (9349) antibodies were obtained from Cell Signaling (Danvers, MA). Anti-RALA (610221) antibodies were obtained from BD Biosciences (San Jose, CA). Anti-phosphotyrosine (05-321) antibodies were obtained from EMD Millipore (Billerica, MA). Anti-MYC (SC-789) antibodies were obtained from Santa Cruz Biotechnology (Santa Cruz, CA). A custom anti-ZFP407 antibody was generated in rabbits against the C-terminal 149 amino acids of the mouse ZFP407 protein (Proteintech Group, Chicago, IL). Goat anti-rabbit HRP (31460) and goat anti-mouse HRP (31430) secondary antibodies were obtained from Thermo Scientific (Rockford, IL). All primary antibodies were used at a dilution of 1:1,000 and all secondary antibodies were used at a dilution of 1:10,000. Coomassie Blue staining was performed by fixing polyacrylamide gels in 50% EtOH and 10% acetic acid at room temperature for 1 h followed by washing in water. Gels were stained with GelCode Blue Stain Reagent (Fisher Scientific, Waltham, MA) for 1 h at room temperature and destained in water overnight. Gels were scanned using a ChemiDoc MP imager (Bio-Rad) and total protein from each lane was quantified using ImageJ.
Bromouridine (BrU) Assay
3T3-L1 cells were grown to confluence and electroporated with control or Zfp407 siRNA. BrU incorporation and detection was determined as described following a 30-min pulse and then again following a 6-h chase (19). Gene expression was normalized to the ribosomal protein L32 (Rpl32) and the ribosomal protein, large, p0 (Rplp0). Quantitative PCR (qPCR) primers were localized within a single exon to amplify both spliced and unspliced transcripts (Table 2).
TABLE 2.
Sequence of primers
| Gene | Forward primer (5′ → 3′) | Reverse primer (5′ → 3′) |
|---|---|---|
| Chmp1a | GGAGGTCCTAGACCAGCTCA | CGAAGGGTTGGAGAAAGTGA |
| Chmp1b | GGTCAGACAGGGTCTGTTGG | CACACACAAATGATGGCTCA |
| Ppp2r2a | GCCACTTCCTGCTTAGTGAGA | CCACACAGCTTTCTCCATGA |
| Ppp2r2b | TTTGGGTCTTCATTTTGATGC | CCAAGCCTACCGAGTTTGAC |
| Dusp8 | AAAACACACAGAAAAGGTAAATGG | GACAGTAAAAACAGAGCTTTAGGG |
| Dusp9 | TATAAGCAGGGATGGGATGC | TGGGGCAGGTTTCTACTCTG |
| Dusp16 | GAAGACCTCGTCGCTTCTGT | GTGCAGGTGCTGAGAGAACA |
| Hormad1 | CAAACAAGATGCCCTGGACT | CAGAGGTACAGAAGGCACACC |
| Hormad2 | AGGTGCCTTTGCTACACCTG | AAGTGAACCTAGGGCCTGCT |
| Actr10 | GCTAATTGTGTGGCCTGGTT | GCTTTCCCCACATCAAACAT |
| Zfp407 | CCACGGAACTTTGTCGTGTT | TGCTCTATGGCACAGGTTCA |
| Actb | CAGCTTCTTTGCAGCTCCT | TCACCCACATAGGAGTCCTT |
| Glut4, one exon | GCAACGTGGCTGGGTAGGCA | CCCACAGAGAAGATGGCCACGG |
| C/EBPa, one exon | GGTACGGCGGGAACGCAACA | GAAGATGCCCCGCAGCGTGT |
| Zfp407, one exon | ACTCGGACGGTGTTGCTGCG | CCAACCCACAGGCACCCTGC |
| Rplp0, one exon | AGGGAAGGCCGTGGTGCTGA | CACGAAGCCCACGTTCCCCC |
| Rpl32, one exon | CTGGCGGAAACCCAGAGGCA | GAAGCCGCTGGGCAGCATGT |
Glut4 Translocation Assay
3T3-L1 cells stably expressing myc-GLUT4-eGFP were used to measure GLUT4 translocation (16). Cells were electroporated with the indicated siRNA and plated on glass coverslips. After 4 days, the cells were serum starved for 3 h and then stimulated with 100 nm insulin. After 30 min, cells were washed 3 times with ice-cold phosphate-buffered saline (PBS) then fixed for 5 min in 4% paraformaldehyde in PBS at room temperature without permeabilization. Immunostaining was performed as previously described (20). Cells were visually examined and blindly scored as either membrane or non-membrane for both the GFP signal and the extracellular MYC tag.
RNA Analysis
RNA was collected using the QIAshredder and the RNeasy mini kit (Qiagen). RNA for qPCR was reverse transcribed using the high capacity cDNA reverse transcription kit without the RNase inhibitor (Applied Biosystems, Carlsbad, CA). Primer sequences are given in Table 2. qPCR was performed in triplicate on a 7900HT Real-time PCR system or Roche Lightcycler using the power SYBR Green PCR mastermix (Applied Biosystems). The expression level for all genes was calculated using the ΔΔCt method relative to the ribosomal protein, large, P0 (Rplp0) or actin β (Actb) control genes unless otherwise indicated. For RNA-Seq analysis, independent electroporations were performed using a single batch of differentiated 3T3-L1 adipocytes to minimize the variation in gene expression due to differences in adipocyte differentiation. RNA quality was determined on the Agilent BioAnalyzer 2100 and all samples had an RNA integrity number score greater than 9.5. Illumina TruSeq sequencing libraries were prepared at the University of Michigan DNA sequencing core using standard procedures. Samples were run on three lanes of an Illumina HiSeq2000 generating 442,000,000 reads with quality scores greater than Q30 for 97.2% of all bases. Reads were aligned to the mouse genome (Ensembl m38.69, GenBank Assembly ID GCA_000001635.2) using TopHat version 2.0.5, SamTools version 0.1.18.0, and Bowtie2 version 2.0.0.7 (21). Gene expression was analyzed using Cufflinks version 2.0.2 (22) or DESeq version 1.9.4 (23). Splicing was analyzed using DEXseq version 1.4 (24). A p value corrected for a false discovery rate of 0.05 was considered statistically significant. Heat maps were generated in R version 2.15.1 with the heatmap.2 function in the gplots package (version 2.11.0) using the hierarchical clustering method ward and the distance function euclidean. GO analysis was conducted using DAVID (25) with a false discovery rate adjusted p < 0.05 considered statistically significant.
PPARγ Luciferase Reporter Assay
293T cells were transfected using Lipofectamine 2000 (Invitrogen) using standard conditions for a 12-well dish. DNA plasmid-transfected constructs encoded the PPARγ cDNA (pSV Sport PPARgamma2, Addgene number 8862), a Myc-DDK tagged Zfp407 cDNA (MR214555, Origene Technologies, Rockville, MD), an empty vector control plasmid (pRK5-Myc), and the PPARγ target gene luciferase reporter plasmid (PPRE-X3-Tk-luc, Addgene number 1015). The control plasmid pRL-SV40 encodes Renilla and was co-transfected for normalization. 500 ng of each plasmid was transfected per well, with the exception of pRL-SV40 for which 50 ng/well was used. Luciferase was measured 24 h post-transfection with the Dual-Glo Luciferase Assay System (Promega, Madison, WI).
Mice
Mice were housed in ventilated racks, had access to food and water ad libitum, and were maintained at 21 °C on 12-h light/12-h dark cycle. C57BL/6J mice were originally purchased from The Jackson Laboratories and then bred and maintained in the Case Western Reserve University animal facility. Mice were fed standard chow diet (LabDiet 5010, PMI Nutrition International, St. Louis, MO). Tissues for Western blotting were collected following a 16-h overnight fast.
Statistics
Data are shown as the mean ± S.E. of the mean or as the mean ± 95% confidence intervals, as indicated. A two-tailed Fisher exact test using the method of summing small p values was used to compare Glut4 splicing efficiency between control and ZFP407-deficient 3T3-L1 cells. 95% confidence intervals were calculated using the Wald method. A one-sample t test was used to compare changes in Glut4 splicing efficiency.
RESULTS
ZFP407 Regulates Insulin-stimulated Glucose Uptake
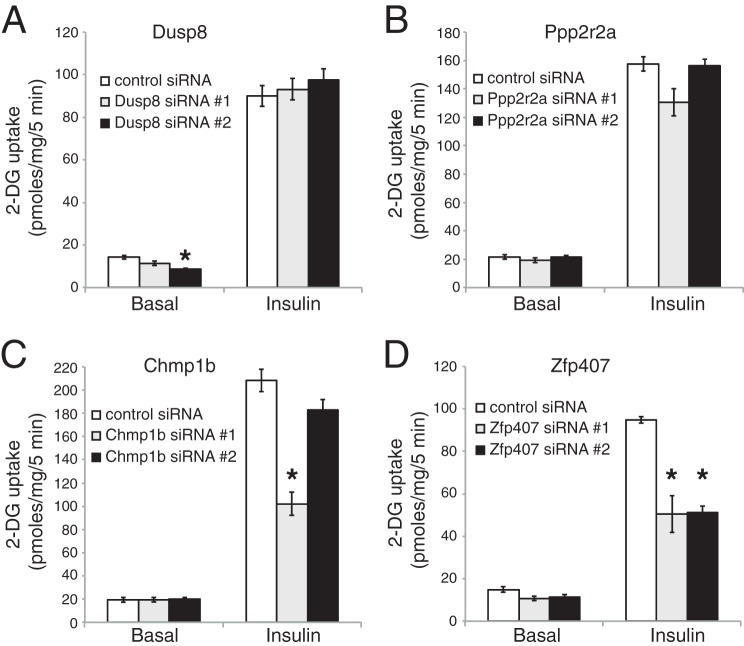
Among the homologs of genes identified by Frische et al. (9) that genetically interacted with Rap1, charged multivesicular body protein 1B (Chmp1b), protein phosphatase 2, regulatory subunit Bα (Ppp2r2a), dual specificity phosphatase 8 (Dusp8), and Zfp407 were expressed in differentiated 3T3-L1 adipocytes. However, expression of charged multivesicular body protein 1A (Chmp1a), protein phosphatase 2, regulatory subunit Bβ (Ppp2r2b), HORMA domain containing 1 (Hormad1), HORMA domain containing 2 (Hormad2), dual specificity phosphatase 9 (Dusp9), and dual specificity phosphatase 16 (Dusp16) were not detected (data not shown). To test whether those genes expressed in adipocytes were required for insulin-stimulated glucose uptake, each gene was knocked down by two independent siRNAs and both basal and insulin-stimulated 2-DG uptake was measured (Fig. 1). Knockdown efficiency was confirmed by qPCR relative to the control gene Actb (data not shown). Only ZFP407 deficiency significantly reduced insulin-stimulated glucose uptake in a manner that was consistently observed with both siRNAs (Fig. 1). There was no effect of ZFP407 deficiency on basal glucose uptake, suggesting that the knockdown did not affect cell viability. Replicate studies confirmed the effect of ZFP407 on insulin-stimulated glucose uptake with knockdown efficiencies consistently between 30 and 50% (data not shown), suggesting that haploinsufficieny of ZFP407 could affect glucose homeostasis and that ZFP407 is required for maximal insulin-stimulated glucose uptake in adipocytes.
FIGURE 1.
ZFP407 deficiency decreases insulin-stimulated glucose uptake. Differentiated 3T3-L1 adipocytes were electroporated with control siRNA or Dusp8 (A), Ppp2r2a (B), Chmp1b (C), or Zfp407 (D) siRNA. Four days later, the cells were serum starved and treated with or without 100 nm insulin for 30 min. The rate of 2-DG uptake was determined. Results are the mean ± S.E., n = 3 per group. * indicates p < 0.05.
ZFP407 Regulates GLUT4 Protein and mRNA Levels
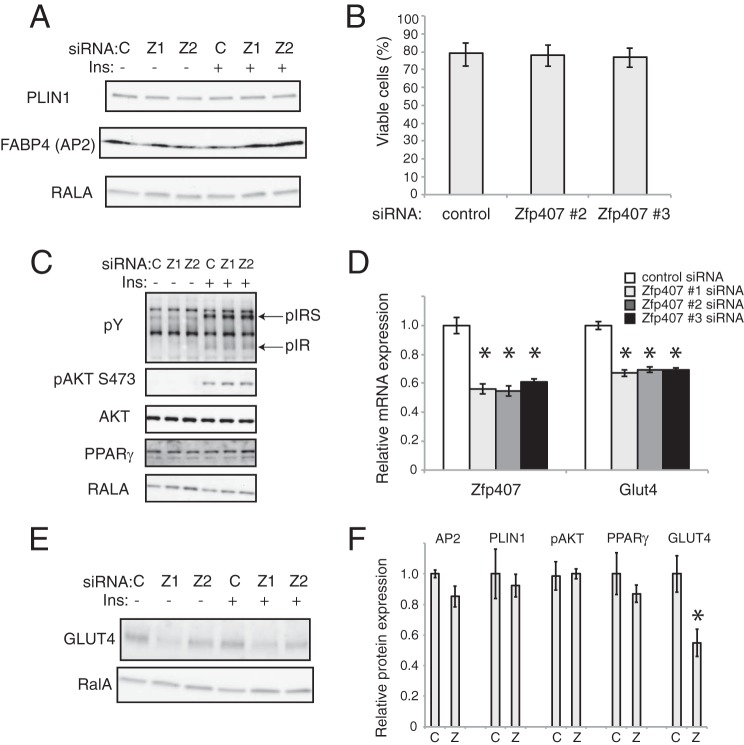
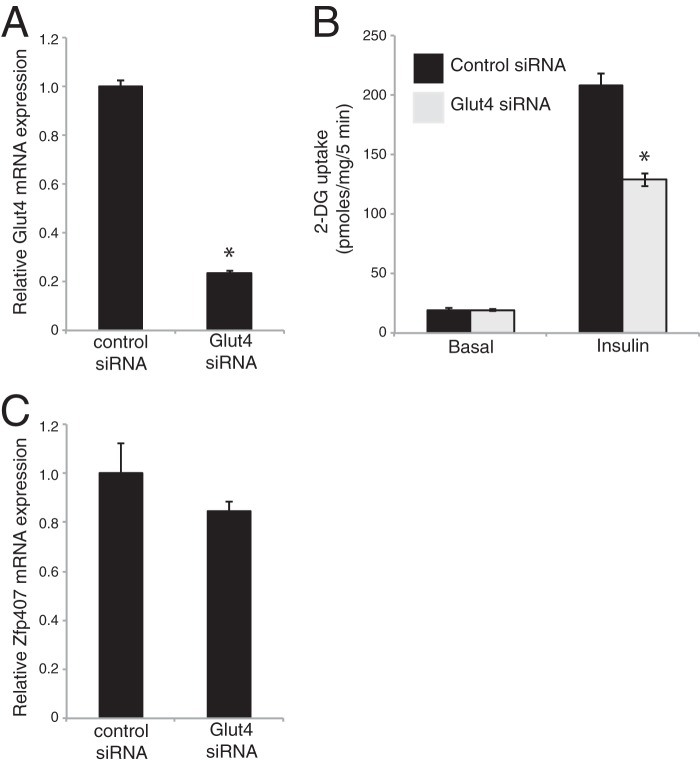
Insulin-stimulated glucose uptake depends upon cellular processes including insulin signaling, GLUT4 trafficking, and GLUT4 levels (3). Because little is known about the cellular function of ZFP407, we sought to determine the molecular mechanism underlying its role in glucose transport. ZFP407 deficiency did not affect GLUT4 trafficking (Fig. 2, A and B), adipocyte differentiation (Fig. 3A), cell viability (Fig. 3B), or proximal insulin signaling (Fig. 3C). However, knockdown of Zfp407 led to a significant reduction in both Glut4 mRNA and GLUT4 protein levels (Fig. 3, D–F). The 50% reduction in GLUT4 protein levels observed in ZFP407 knockdown cells is consistent with the 30–40% reduction in insulin-stimulated glucose uptake. For comparison, a near complete knockdown of Glut4 leads to a 55% reduction in insulin-stimulated glucose uptake (26), whereas a 75% reduction in Glut4 leads to a 40% reduction (Fig. 4, A and B). Additionally, deficiency of Glut4 had no effect on Zfp407 mRNA levels suggesting the absence of a regulatory feedback loop (Fig. 4C).
FIGURE 2.
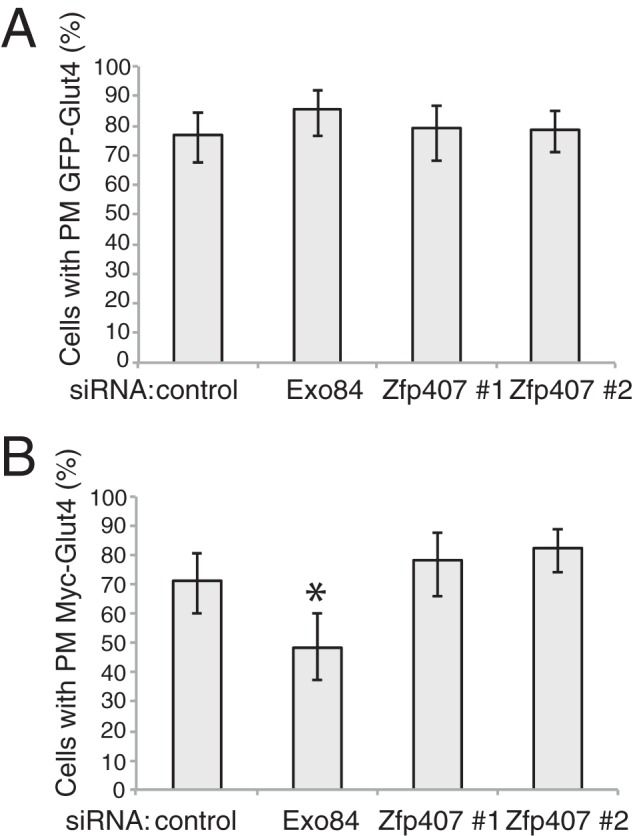
ZFP407 does not regulate GLUT4 protein trafficking. Differentiated 3T3-L1 adipocytes stably expressing myc-GLUT4-eGFP were electroporated with control siRNA, Exo84 siRNA, or Zfp407 siRNA. Four days later, the cells were serum starved and treated with 100 nm insulin. A and B, cells were fixed without permeabilizing. The cells were incubated with anti-myc secondary antibody overnight. GFP and MYC localization were determined by confocal microscopy. A, GFP-GLUT4 positive cells were blindly counted as either positive or negative for plasma membrane localized GFP. B, plasma membrane positive cells were then blindly counted as either positive or negative for MYC staining. Mean ± 95% confidence intervals are shown. n = 95, 84, 71, and 60 cells, respectively.
FIGURE 3.
ZFP407 regulates GLUT4 protein and mRNA levels. Differentiated 3T3-L1 adipocytes were electroporated with control siRNA or Zfp407 siRNA (Zfp407 siRNA#1, Z1; Zfp407 siRNA#2, Z2). Four days later, the cells were serum starved and treated with or without 100 nm insulin. A, cell lysates were subjected to SDS-PAGE and Western blotting for the adipocyte differentiation markers perilipin 1 (PLIN1) and fatty acid-binding protein 4 (FABP4 or AP2). v-ral simian leukemia viral oncogene homolog A (RALA) represents the loading control. B, cells were stained with trypan blue (0.04%) and blindly counted as positive (dead) or negative (viable). Mean ± 95% confidence intervals are shown. n = 153, 187, and 230 cells, respectively. C, cell lysates were subjected to SDS-PAGE and Western blotting for the phosphorylated (active) forms of the insulin signaling markers AKT (pAKT S473), insulin receptor (pIR), and the insulin receptor substrates 1/2 (pIRS). Total AKT levels, RALA, and PPARγ represent controls for loading and adipocyte differentiation status. respectively. D, total RNA was isolated from 3T3-L1 cells and analyzed by real-time qPCR (n = 3). Data are expressed as mean ± S.E. E, cell lysates were subjected to SDS-PAGE and Western blotting for the GLUT4 and the loading control RALA. A representative image is shown. F, Western blots shown in A, C, and E were quantitated using ImageJ. Data are expressed as mean ± S.E. and is relative to the control gene RalA except pAKT, which is relative to total AKT. * indicates p < 0.05 relative to control siRNA. C, control siRNA. Z, Zfp407 siRNA.
FIGURE 4.
Effect of Glut4 siRNA knockdown on glucose uptake and Zfp407 expression. Differentiated 3T3-L1 adipocytes were electroporated with control or Glut4 siRNA. A, Glut4 or C, Zfp407 mRNA expression was determined by qPCR. B, four days post-electroporation, the cells were serum starved and treated with or without 100 nm insulin for 30 min. The rate of 2-DG uptake was determined. Results are the mean ± S.E., n = 3 per group. * indicates p < 0.05.
Transcriptional Regulation by ZFP407
To confirm the regulation of Glut4 mRNA levels by ZFP407, we compared the transcriptomes of control and ZFP407 knockdown 3T3-L1 adipocytes. ZFP407 deficiency led to a 15% decrease in Glut4 mRNA levels. This decrease was not significant using the Tuxedo (Bowtie, TopHat, Cufflinks) analysis package (p > 0.3), but was significantly different when analyzed with DESeq (p < 0.002). No other glucose transporters differed between the control and ZFP407-deficient cells, consistent with the effect on insulin-stimulated glucose uptake being due to the reduction in Glut4.
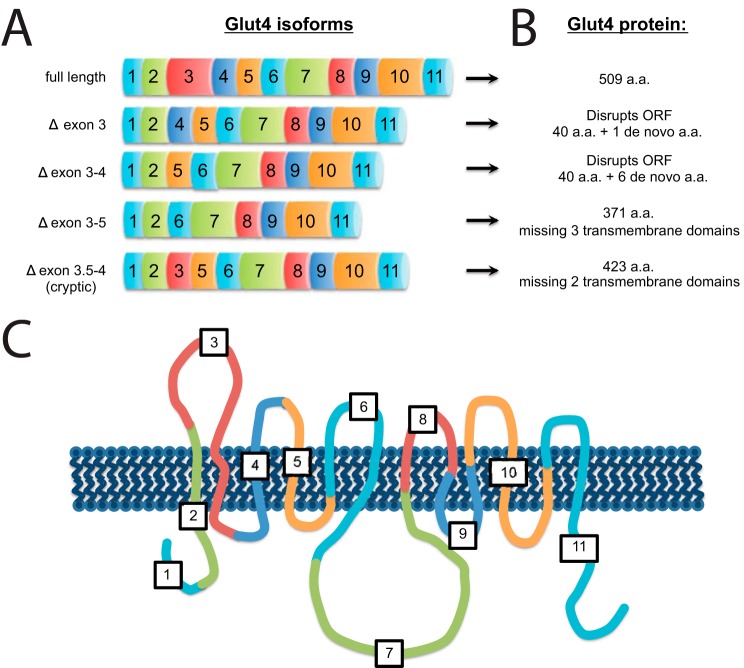
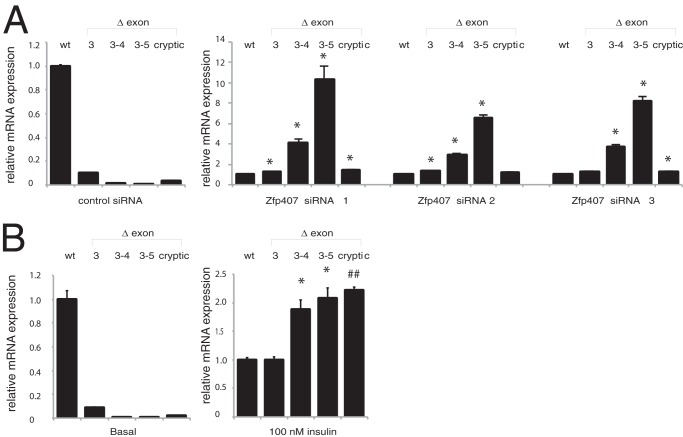
Analysis of the splicing pattern of Glut4 with DEXSeq revealed that in addition to the overall reduction in Glut4 transcript levels, there was an even more pronounced reduction in exon 3 of Glut4 (p < 0.008). In control 3T3-L1 adipocytes, 533 of 603 (88.4%) Glut4 RNA-Seq reads beginning in exon 2 were correctly spliced to exon 3. However, only 470 of 635 (74.0%) Glut4 RNA-Seq reads beginning in exon 2 from the ZFP407 knockdown cells were correctly spliced to exon 3 (Chi squared test, p < 0.0001). Of the incorrectly spliced Glut4 transcripts in ZFP407 knockdown cells, 19% skipped exon 3, 43% skipped exons 3–4, 21% skipped exons 3–5, and 16% used a cryptic splice donor site within exon 2 in addition to skipping exon 3 (Fig. 5). This represented an increase in the exon 3–4-skipped product (p < 0.003), the exon 3–5-skipped transcript (p < 0.001), and the cryptic splice donor transcript (p < 0.002), but not in the exon 3-skipped transcript (p > 0.2). The increases in incorrectly spliced Glut4 transcripts were confirmed by qPCR (Fig. 6A). These transcripts either disrupt the open reading frame or encode for proteins that are missing multiple transmembrane segments and are likely nonfunctional (Fig. 5). Therefore, the reduction in GLUT4 protein levels in ZFP407-deficient cells is due to both reduced steady-state Glut4 mRNA levels as well as a reduction in correctly spliced transcript.
FIGURE 5.
Schematic of alternative splice isoforms of Glut4. A, Glut4 isoforms are represented by colored rectangles corresponding to each Glut4 exon. B, the predicted protein encoded by each Glut4 isoform. a.a., amino acids. C, diagram of the GLUT4 protein in the plasma membrane showing the location of each Glut4 exon within the overall protein. Numbers indicate the corresponding Glut4 exon.
FIGURE 6.
Regulation of Glut4 mRNA splicing. Glut4 splicing was analyzed by real-time qPCR using primers that span exon junctions to specifically amplify the alternatively spliced Glut4 splice isoforms. Relative Glut4 transcript levels were compared with correctly spliced Glut4 transcript levels (wt) followed by calculation of the fold-change for each splice isoform relative to the fold-change of wt transcripts. Total RNA was obtained from (A) 3T3-L1 adipocytes treated with control or Zfp407 siRNAs (n = 3 per group). Cryptic represents a Glut4 isoform that utilizes a cryptic splice donor 35 nucleotides into the 3rd exon of Glut4 (gtaggc) that is spliced directly to the 5th exon; B, differentiated 3T3-L1 adipocytes were treated with or without 100 nm insulin for 6 h (n = 6 per group). Data are expressed as mean ± S.E. * indicates p < 0.05; and ## indicates p < 0.0001 relative to the wt transcript.
Insulin Decreases Glut4 Splicing Efficiency in 3T3-L1 Cells
To test whether additional regulators of the Glut4 transcription effect Glut4 splicing, 3T3-L1 cells were treated with 100 nm insulin for 6 h, which reduced Glut4 mRNA levels 64 ± 1% (p < 0.0001) (27). As was observed in ZFP407 knockdown cells, the resulting decrease in Glut4 mRNA levels was associated with reduced Glut4 splicing efficiency (Fig. 6B). Increases were observed in exon 3–4-, exon 3–5-, and cryptic-skipped transcripts, with no increase in the level of exon 3-skipped transcripts. The similarity in splicing patterns between insulin-treated and ZFP407 knockdown cells suggests a conserved mechanism.
ZFP407 Regulates the Transcription of Glut4 mRNA
The observed regulation of steady-state Glut4 mRNA levels by ZFP407 could be due to altered transcription, mRNA stability, or both. Transcription rates were measured following a 30-min pulse of BrU to label nascent transcripts, which were then isolated with magnetic beads and quantified by qPCR (19). Glut4 transcription rates were decreased 80 ± 2% (p < 0.0001) in ZFP407 knockdown adipocytes, whereas the transcription rates of the control gene CCAAT/enhancer binding protein α (C/ebpα) (19 ± 4% decrease) and Zfp407 itself (11 ± 5% decrease) were not significantly different.
ZFP407 Regulates Glut4 mRNA Stability
One advantage of the BrU labeling technique to measure transcription rates is that mRNA stability can be measured in the same experiment following a 6-h chase with unlabeled uridine (19). The t½ of Glut4 mRNA in 3T3-L1 adipocytes electroporated with a control siRNA was 9.5 ± 0.7 h, a value similar to previous studies (8.6 h) (27). The t½ of Glut4 mRNA in 3T3-L1 adipocytes electroporated with Zfp407 siRNA#1 was increased 2.8-fold to 26.3 ± 0.7 h (p = 0.1). To confirm these findings, Glut4 mRNA stability was also measured following treatment of cells with the transcriptional inhibitor actinomycin D. Three different siRNAs were separately used to knock down Zfp407 in 3T3-L1 adipocytes, and each was found to increase Glut4 mRNA stability. Zfp407 siRNAs #1–3 increased Glut4 stability 2.4-fold (p < 0.05), 3.1-fold (p < 0.05), and 6.1-fold (p < 0.05), respectively. Thus, ZFP407 regulates both the transcription rate and mRNA stability of Glut4 mRNA, with opposing consequences on the steady-state levels of Glut4 mRNA.
The increased stability of Glut4 transcripts may have been common to all Glut4 isoforms, or due to one or more of the incorrectly spliced Glut4 isoforms that increased in ZFP407-deficient cells. To distinguish between these possibilities, the mRNA half-life of each Glut4 isoform was measured, and no differences were detected relative to the correctly spliced isoform. The exon 3-skipped transcript was increased 3.2-fold (p < 0.05), the exon 3–4-skipped transcript was increased 3.5-fold (p < 0.1), and the exon 3–5-skipped transcript was increased 5.1-fold (p < 0.05). Therefore, the increased t½ of Glut4 was not due to the alternately spliced transcripts.
To test whether the increase in the t½ of Glut4 mRNA was specific to the regulation by ZFP407 or was due to a generic cellular response to decreased levels of Glut4, we directly decreased the levels of Glut4 mRNA in 3T3-L1 adipocytes with a Glut4 siRNA. The Glut4 siRNA resulted in an 86.5 ± 0.7% decrease in Glut4 mRNA levels (p < 0.0001) relative to a control siRNA. This decrease in Glut4 did not increase the t½ of Glut4 mRNA in Glut4 siRNA-transfected cells (10.2 ± 0.3 h) relative to control cells (12.4 ± 0.4 h) indicating that ZFP407 specifically regulates the t½ of Glut4 mRNA.
The stability of mRNA is often regulated by an adenylate- and uridine-rich element in the 3′ UTR of transcripts with a canonical AUUUA pentamer motif. This motif regulates mRNA stability through interactions with RNA-binding proteins including zinc finger protein 36 (ZFP36, also known as TTP) (28). The human and mouse Glut4 transcript both contain an AUUUA sequence within the 3′ UTR. Therefore we sought to test whether ZFP36 could regulate the stability of Glut4 and thus mediate the effect of ZFP407 on Glut4 mRNA stability. Initially, the t½ of the known ZFP36 target gene FBJ osteosarcoma oncogene (c-Fos) (29) was measured to test the effectiveness of ZFP36 knockdown. Relative to the t½ of c-Fos in control siRNA cells (0.5 ± 0.02 h), knockdown of ZFP36 with both siRNA#1 (1.5 ± 0.3 h; p < 0.05 relative to control) and siRNA#2 (2.0 ± 0.5 h; p < 0.05 relative to control) significantly increased the t½ of c-Fos thus demonstrating the effectiveness of the knockdown. However, the t½ of Glut4 mRNA in adipocytes transfected with control siRNA (10.7 ± 1.5 h) did not differ from cells transfected with Zfp36 siRNA#1 (11.8 ± 1.3 h; p > 0.6 relative to control) or Zfp36 siRNA#2 (10.9 ± 0.6 h; p > 0.9 relative to control). Therefore, Glut4 mRNA does not appear to be a target of ZFP36.
Transcriptome Analysis of ZFP407 Deficiency
To determine the genes beyond Glut4 regulated by ZFP407, the transcriptomes of 3T3-L1 adipocytes electroporated with control and Zfp407 siRNA were compared. The expression of 217 genes were down-regulated and 85 genes were up-regulated by ZFP407 deficiency (supplemental Table S1).
To move beyond individual genes such as Glut4 that are regulated by ZFP407, the Gene Ontology and KEGG pathways were analyzed using DAVID (25). The only significantly different Gene Ontology (GO) pathways were the biological process term oxidation reduction (GO: 0055114, adjusted p < 10−6) and the cellular component term mitochondrion (GO: 0005739, adjusted p < 10−5).
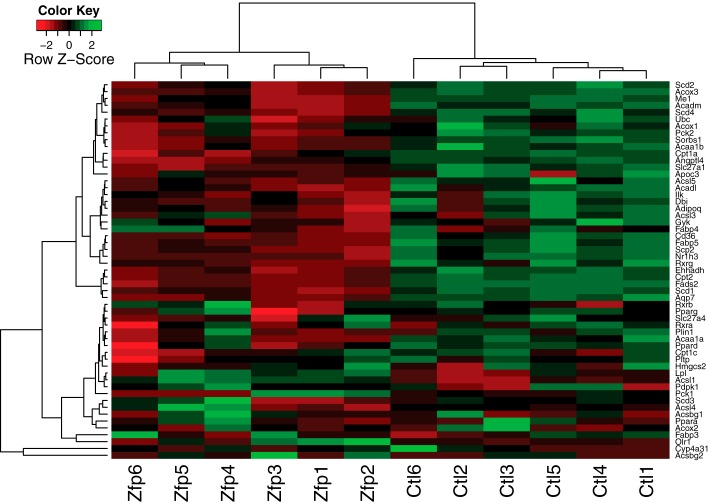
In addition to testing the genes and pathways that were differentially expressed in ZFP407-deficient cells, DEXSeq was used to evaluate differences in splicing. Five hundred and ninety-two genes, including Glut4, were identified that contained at least one differentially expressed exon (supplemental Table S2). The most significant pathway identified among the differentially spliced genes was the KEGG PPAR signaling pathway (mmu03320). As was the case with Glut4, splicing and transcriptional regulation are often linked (30). Therefore, we next examined the expression of the entire PPAR pathway for subtle expression differences and discovered that nearly all of the known PPAR-regulated genes were down-regulated in ZFP407-deficient cells (Fig. 7).
FIGURE 7.
ZFP407 deficiency reduces expression of PPAR target genes. Heat map of the RNA-Seq expression profiles of PPAR target genes (KEGG pathway mmu03320). Red indicates decreased relative expression, green indicates increased relative expression. Only genes expressed in all samples (FPKM > 0) are shown. Zfp1–6 represents 6 independent electroporations of differentiated 3T3-L1 adipocytes with Zfp407 siRNA#1 (Zfp1–3) or Zfp407 siRNA#2 (Zfp4–6). Ctl 1–6 represents 6 independent electroporations of differentiated 3T3-L1 adipocytes with the control siRNA.
ZFP407 Regulates PPARγ-mediated Transcription
PPARγ is an important regulator of Glut4 expression in adipocytes (31, 32). To test whether ZFP407 could be regulating Glut4 expression through the PPARγ pathway, the effects of both ZFP407 overexpression and deficiency on PPARγ signaling were examined. The PPARγ agonist rosiglitazone (ROSI) induces Glut4 expression in 3T3-L1 adipocytes (33), however, the effect of ROSI on Glut4 expression was completely abrogated by siRNA-mediated inhibition of Zfp407 (Fig. 8A). Additionally, whereas ZFP407 overexpression had no effect on luciferase expression from a PPARγ target gene reporter construct, the co-overexpression of ZFP407 and PPARγ synergistically increased luciferase expression 2-fold relative to PPARγ alone (Fig. 8B). Thus, ZFP407 is necessary but not sufficient for PPARγ-mediated transcriptional regulation.
FIGURE 8.
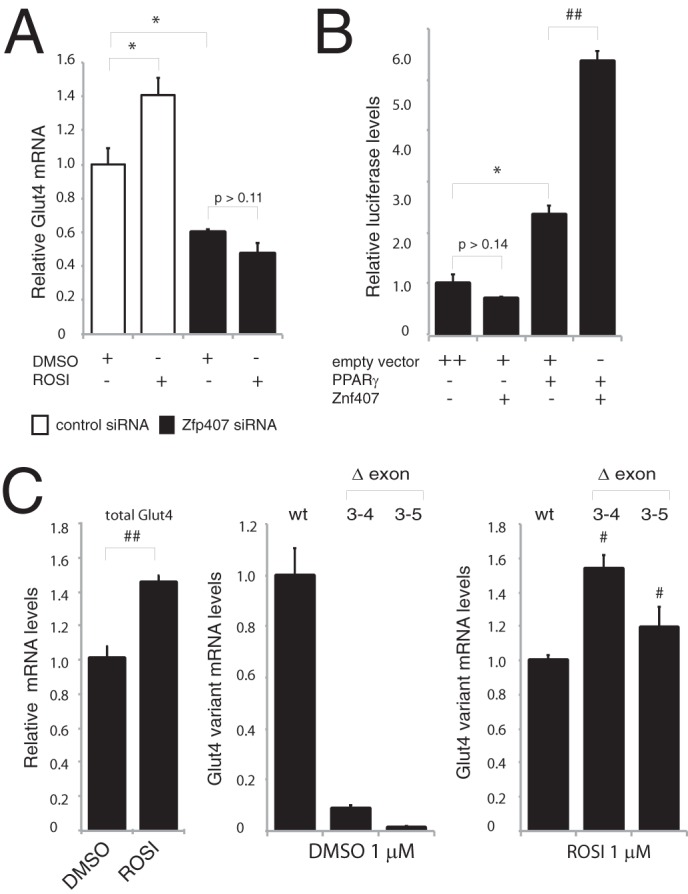
Regulation of Glut4 by ZFP407 is mediated by PPARγ. A, Glut4 mRNA levels were analyzed by qPCR in 3T3-L1 adipocytes electroporated with control or Zfp407 siRNA followed by treatment with 1 μm ROSI or dimethyl sulfoxide (DMSO). B, a PPARγ consensus reporter vector was co-electroporated in 293T cells with the following indicated vectors: pRK5-myc (empty vector control), Zfp407 cDNA, and PPARγ cDNA. C, levels of total Glut4 and relative Glut4 transcript variants were evaluated by qRT-PCR and compared with total Glut4 transcript levels to calculate the fold-change for each variant as compared with the correctly spliced transcripts. Total RNA was obtained from 3T3-L1 adipocytes treated for 24 h with ROSI (1 μm). Data are expressed as mean ± S.E. * indicates p < 0.05; # indicates p < 0.001; and ## indicates p < 0.0001.
To test whether PPARγ could directly regulate Glut4 splicing, 3T3-L1 adipocytes were treated with either ROSI (1 μm) or the PPARγ antagonist T0070907 (1 μm) for 24 h. ROSI treatment increased Glut4 transcript levels 40% relative to the control treated cells (Fig. 8C), but had an even larger effect on the exon 3–4- and exon 3–5-skipped splice variants of Glut4 (Fig. 8C). Interestingly, whereas T0070907 reduced the total Glut4 transcript by 65%, it did not alter the level of the exon 3–4- and exon 3–5-skipped splice variants relative to total Glut4 levels (data not shown).
Expression of Zfp407
Because little is known about the expression pattern of ZFP407, protein expression levels of ZFP407 were analyzed in a diverse panel of tissues (Fig. 9). ZFP407 protein was detected in all tissues, although interestingly at lower levels in muscle and the gonadal fat pad, which are sites of elevated Glut4 expression (Fig. 9).
FIGURE 9.
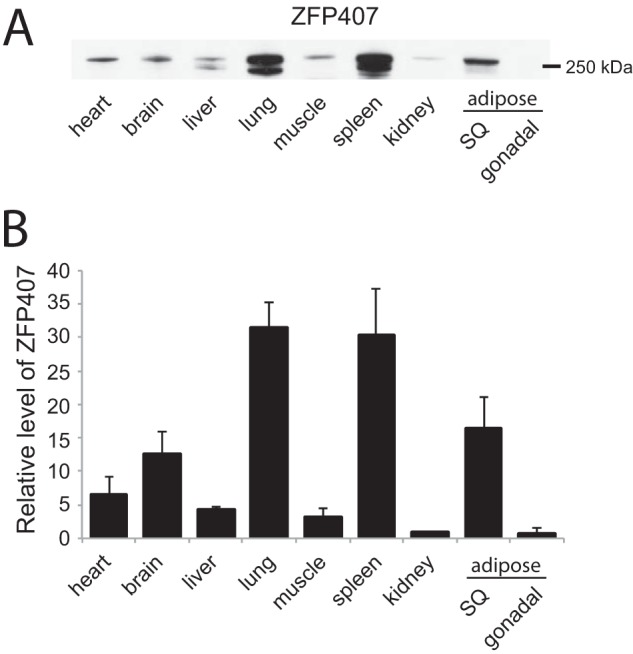
ZFP407 is widely expressed in C57BL/6J mice. Tissue lysates were obtained from 4.5-month-old mice that were fasted for 16 h. Western blots were probed using an anti-ZFP407 antibody and quantified relative to total protein as determined by Coomassie Blue staining. SQ, subcutaneous.
DISCUSSION
This study identifies the first known function of ZFP407 as a regulator of Glut4 expression and insulin resistance in adipocytes, based on insight gained from a screen for synthetic lethal interactions with Rap1 that was conducted in C. elegans. It was surprising that the effect of ZFP407 on Glut4 is at the mRNA level, given that RalA/RalB, Exoc8, and Actr10, which were identified in the C. elegans screen, all regulate trafficking of the GLUT4 protein. One potential reason for this is the weak homology of ZFP407 to the C. elegans homolog C01B7.1 identified in the Rap1 screen (9), in particular outside of the zinc finger domain. Therefore, it is possible that the function of these homologs is poorly conserved as well.
ZFP407 was detected in all tissues tested, suggesting widespread expression. This suggests that although we present evidence for ZFP407 function in glucose homeostasis, there are likely to be additional functions in other tissues that do not express GLUT4. In fact, relative to other tissues, the expression of ZFP407 was lower in muscle and the gonadal fat pad where GLUT4 is highly expressed. ZFP407 is also likely to have additional functions within the adipocyte beyond glucose uptake. The expression of 302 genes was regulated by ZFP407 deficiency in 3T3-L1 adipocytes, among them many genes involved in mitochondrial function. As adipocyte mitochondria play a key role in differentiation, lipogenesis, and lipolysis, additional studies may reveal a broader cellular function of ZFP407 (34).
In addition to the role of ZFP407 in the regulation of Glut4, we demonstrated that insulin not only decreases the transcription of Glut4 as has been previously shown, but also decreases the splicing efficiency of Glut4 mRNA as well. Multiple incorrectly spliced transcripts were increased, collectively accounting for nearly 15% of the total Glut4 transcripts in vitro. Because these incorrectly spliced transcripts are predicted to encode non-functional proteins, targeting the splicing efficiency of Glut4 represents a novel mechanism for therapeutically increasing GLUT4 levels in patients with T2D. A similar approach has been taken with other splicing disorders including Duchenne muscular dystrophy and spinal muscular atrophy (35). For example, the splicing of survival of motor neuron 2 (Smn2) can be modified to increase the incorporation of exon 7 into the mature Smn2 transcript by treating with an antisense oligonucleotide that targets either exonic or intronic splicing regulatory elements (36, 37). The increased levels of exon 7 incorporation into Smn2 are able to rescue the mutant phenotype of a mouse model of spinal muscular atrophy (38).
Intensive study has revealed a complex and poorly understood network of genes that regulate the expression of Glut4 including PPARγ, nuclear receptor subfamily 1, group H, member 3 (Nr1h3 or LXR), myocyte enhancer factor 2A (MEF2a), and SLC2A4 regulator (SLC2A4RG or GEF), among others (31, 32, 39, 40). Although the presence of multiple zinc finger domains suggests that ZFP407 binds DNA and functions as a transcription factor, it is not clear whether or not ZFP407 directly or indirectly regulates the expression of Glut4, although it appears to function as part of the PPARγ pathway. However, PPARγ levels were not regulated by ZFP407 at either the mRNA or protein levels suggesting that ZFP407 may instead regulate the activity or subcellular localization of PPARγ. PPARγ plays a critical role in regulating glucose homeostasis and insulin sensitivity, however, the exact mechanisms of PPARγ action during T2D and insulin resistance are not fully understood at the molecular level. Thus, there remains a need to better elucidate the roles of novel proteins involved in PPARγ-mediated gene expression. For example, PPARγ regulates the expression of mitochondrial genes and fatty acid β-oxidation in 3T3-L1 adipocytes (41). Gene Ontology and KEGG analysis also identified broad regulation of mitochondrial genes by ZFP407. However, it remains unclear which effects of ZFP407, including those on mitochondrial gene expression, are PPARγ-dependent.
The PPARγ agonist ROSI resulted in a similar pattern of incorrectly spliced Glut4 transcripts as was detected with ZFP407 deficiency suggesting a conserved mechanism. Therefore it was surprising that the PPARγ antagonist T0070907 had no effect on Glut4 splicing, despite a decrease in total Glut4 mRNA levels on par with those due to ZFP407 deficiency. T0070907 inhibits PPARγ activity, in part by enabling the recruitment of the transcriptional co-repressor NCoR (42). NCoR associates with SAP130 and SF3a120 (43), two components of the U2 snRNP, which plays a pivotal role in selecting the branch point adenosine and its subsequent positioning with the catalytic core of the spliceosome (44). Thus, perhaps T0070907 recruits specific co-factors that reduce the incorrect splicing of Glut4 and may provide information as to specific factors that may improve the splicing efficiency of Glut4.
Among the known genes that regulate Glut4 transcription, none have been found to regulate both the transcription of Glut4 as well as the mRNA half-life of Glut4 in opposing directions. Other stimuli including insulin and TNFα effect both the transcription and the half-life of Glut4, however, these effects are in the same direction and therefore work in concert to either raise or lower the levels of GLUT4. This raises the question of why ZFP407 would have counter-balancing effects on transcription and mRNA stability. Further work is required to better understand the physiological role of ZFP407 in regulating Glut4 mRNA and glucose homeostasis.
Acknowledgments
We thank Dr. Louise Chang and Maeran Uhm for helpful discussions.
This work was supported, in whole or in part, by National Institutes of Health Grants DK084079 and DK61618.
The RNA-Seq expression profiling data has been deposited in the Gene Expression Omnibus under GSE64757.

This article contains supplemental Tables S1 and S2.
- T2D
- type 2 diabetes
- Glut4
- glucose transporter 4
- PPARγ
- peroxisome proliferator-activated receptor γ
- qPCR
- quantitative polymerase chain reaction
- ROSI
- rosiglitazone
- Zfp407
- zinc finger protein 407
- 2-DG
- 2-deoxy-d-glucose
- BrU
- bromouridine.
REFERENCES
- 1. Abel E. D., Peroni O., Kim J. K., Kim Y. B., Boss O., Hadro E., Minnemann T., Shulman G. I., Kahn B. B. (2001) Adipose-selective targeting of the GLUT4 gene impairs insulin action in muscle and liver. Nature 409, 729–733 [DOI] [PubMed] [Google Scholar]
- 2. Bogan J. S. (2012) Regulation of glucose transporter translocation in health and diabetes. Annu. Rev. Biochem. 81, 507–532 [DOI] [PubMed] [Google Scholar]
- 3. Leto D., Saltiel A. R. (2012) Regulation of glucose transport by insulin: traffic control of GLUT4. Nat. Rev. Mol. Cell Biol. 13, 383–396 [DOI] [PubMed] [Google Scholar]
- 4. Foley K., Boguslavsky S., Klip A. (2011) Endocytosis, recycling, and regulated exocytosis of glucose transporter 4. Biochemistry 50, 3048–3061 [DOI] [PubMed] [Google Scholar]
- 5. Morgan B. J., Chai S. Y., Albiston A. L. (2011) GLUT4 associated proteins as therapeutic targets for diabetes. Recent Pat. Endocr. Metab. Immune Drug Discov. 5, 25–32 [DOI] [PubMed] [Google Scholar]
- 6. Atkinson B. J., Griesel B. A., King C. D., Josey M. A., Olson A. L. (2013) Moderate GLUT4 overexpression improves insulin sensitivity and fasting triglyceridemia in high-fat diet-fed transgenic mice. Diabetes 62, 2249–2258 [DOI] [PMC free article] [PubMed] [Google Scholar]
- 7. Marín-Juez R., Diaz M., Morata J., Planas J. V. (2013) Mechanisms regulating GLUT4 transcription in skeletal muscle cells are highly conserved across vertebrates. PLoS ONE 8, e80628. [DOI] [PMC free article] [PubMed] [Google Scholar]
- 8. Shewan A. M., McCann R. K., Lamb C. A., Stirrat L., Kioumourtzoglou D., Adamson I. S., Verma S., James D. E., Bryant N. J. (2013) Endosomal sorting of GLUT4 and Gap1 is conserved between yeast and insulin-sensitive cells. J. Cell Sci. 126, 1576–1582 [DOI] [PMC free article] [PubMed] [Google Scholar]
- 9. Frische E. W., Pellis-van Berkel W., van Haaften G., Cuppen E., Plasterk R. H., Tijsterman M., Bos J. L., Zwartkruis F. J. (2007) RAP-1 and the RAL-1/exocyst pathway coordinate hypodermal cell organization in Caenorhabditis elegans. EMBO J. 26, 5083–5092 [DOI] [PMC free article] [PubMed] [Google Scholar]
- 10. Frische E. W., Zwartkruis F. J. (2010) Rap1, a mercenary among the Ras-like GTPases. Dev. Biol. 340, 1–9 [DOI] [PubMed] [Google Scholar]
- 11. Huang J., Imamura T., Olefsky J. M. (2001) Insulin can regulate GLUT4 internalization by signaling to Rab5 and the motor protein dynein. Proc. Natl. Acad. Sci. U.S.A. 98, 13084–13089 [DOI] [PMC free article] [PubMed] [Google Scholar]
- 12. Inoue M., Chang L., Hwang J., Chiang S. H., Saltiel A. R. (2003) The exocyst complex is required for targeting of Glut4 to the plasma membrane by insulin. Nature 422, 629–633 [DOI] [PubMed] [Google Scholar]
- 13. Chen X.-W., Leto D., Chiang S.-H., Wang Q., Saltiel A. R. (2007) Activation of RalA is required for insulin-stimulated Glut4 trafficking to the plasma membrane via the exocyst and the motor protein Myo1c. Dev. Cell 13, 391–404 [DOI] [PubMed] [Google Scholar]
- 14. Karunanithi S., Xiong T., Uhm M., Leto D., Sun J., Chen X.-W., Saltiel A. R. (2014) A Rab10:RalA G protein cascade regulates insulin-stimulated glucose uptake in adipocytes. Mol. Biol. Cell. 25, 3059–3069 [DOI] [PMC free article] [PubMed] [Google Scholar]
- 15. Chiang S. H., Chang L., Saltiel A. R. (2006) TC10 and insulin-stimulated glucose transport. Methods Enzymol. 406, 701–714 [DOI] [PubMed] [Google Scholar]
- 16. Bogan J. S., McKee A. E., Lodish H. F. (2001) Insulin-responsive compartments containing GLUT4 in 3T3-L1 and CHO cells: regulation by amino acid concentrations. Mol. Cell. Biol. 21, 4785–4806 [DOI] [PMC free article] [PubMed] [Google Scholar]
- 17. Chen X.-W., Leto D., Xiong T., Yu G., Cheng A., Decker S., Saltiel A. R. (2011) A Ral GAP complex links PI 3-kinase/Akt signaling to RalA activation in insulin action. Mol. Biol. Cell. 22, 141–152 [DOI] [PMC free article] [PubMed] [Google Scholar]
- 18. Schneider C. A., Rasband W. S., Eliceiri K. W. (2012) NIH Image to ImageJ: 25 years of image analysis. Nat. Methods 9, 671–675 [DOI] [PMC free article] [PubMed] [Google Scholar]
- 19. Paulsen M. T., Veloso A., Prasad J., Bedi K., Ljungman E. A., Tsan Y.-C., Chang C.-W., Tarrier B., Washburn J. G., Lyons R., Robinson D. R., Kumar-Sinha C., Wilson T. E., Ljungman M. (2013) Coordinated regulation of synthesis and stability of RNA during the acute TNF-induced proinflammatory response. Proc. Natl. Acad. Sci. U.S.A. 110, 2240–2245 [DOI] [PMC free article] [PubMed] [Google Scholar]
- 20. Bridges D., Fisher K., Zolov S. N., Xiong T., Inoki K., Weisman L. S., Saltiel A. R. (2012) Rab5 proteins regulate activation and localization of target of rapamycin complex 1. J. Biol. Chem. 287, 20913–20921 [DOI] [PMC free article] [PubMed] [Google Scholar]
- 21. Langmead B., Salzberg S. L. (2012) Fast gapped-read alignment with Bowtie 2. Nat. Methods 9, 357–359 [DOI] [PMC free article] [PubMed] [Google Scholar]
- 22. Trapnell C., Williams B. A., Pertea G., Mortazavi A., Kwan G., van Baren M. J., Salzberg S. L., Wold B. J., Pachter L. (2010) Transcript assembly and quantification by RNA-Seq reveals unannotated transcripts and isoform switching during cell differentiation. Nat. Biotechnol. 28, 511–515 [DOI] [PMC free article] [PubMed] [Google Scholar]
- 23. Anders S., Huber W. (2010) Differential expression analysis for sequence count data. Genome Biol. 11, R106. [DOI] [PMC free article] [PubMed] [Google Scholar]
- 24. Anders S., Reyes A., Huber W. (2012) Detecting differential usage of exons from RNA-seq data. Genome Res. 22, 2008–2017 [DOI] [PMC free article] [PubMed] [Google Scholar]
- 25. Huang da W., Sherman B. T., Lempicki R. A. (2009) Systematic and integrative analysis of large gene lists using DAVID bioinformatics resources. Nat. Protoc. 4, 44–57 [DOI] [PubMed] [Google Scholar]
- 26. Liao W., Nguyen M. T., Imamura T., Singer O., Verma I. M., Olefsky J. M. (2006) Lentiviral short hairpin ribonucleic acid-mediated knockdown of GLUT4 in 3T3-L1 adipocytes. Endocrinology 147, 2245–2252 [DOI] [PubMed] [Google Scholar]
- 27. Flores-Riveros J. R. (1993) Insulin down-regulates expression of the insulin-responsive glucose transporter (GLUT4) gene: effects on transcription and mRNA turnover. Proc. Natl. Acad. Sci. U.S.A. 90, 512–516 [DOI] [PMC free article] [PubMed] [Google Scholar]
- 28. Sanduja S., Blanco F. F., Dixon D. A. (2011) The roles of TTP and BRF proteins in regulated mRNA decay. RNA 2, 42–57 [DOI] [PMC free article] [PubMed] [Google Scholar]
- 29. Chen C.-Y., Gherzi R., Ong S.-E., Chan E. L., Raijmakers R., Pruijn G. J., Stoecklin G., Moroni C., Mann M., Karin M. (2001) AU binding proteins recruit the exosome to degrade ARE-containing mRNAs. Cell. 107, 451–464 [DOI] [PubMed] [Google Scholar]
- 30. Braunschweig U., Gueroussov S., Plocik A. M., Graveley B. R., Blencowe B. J. (2013) Dynamic integration of splicing within gene regulatory pathways. Cell 152, 1252–1269 [DOI] [PMC free article] [PubMed] [Google Scholar]
- 31. Armoni M., Harel C., Karnieli E. (2007) Transcriptional regulation of the GLUT4 gene: from PPAR-γ and FOXO1 to FFA and inflammation. Trends Endocrinol. Metab. 18, 100–107 [DOI] [PubMed] [Google Scholar]
- 32. Karnieli E., Armoni M. (2008) Transcriptional regulation of the insulin-responsive glucose transporter GLUT4 gene: from physiology to pathology. Am. J. Physiol. Endocrinol. Metab. 295, E38–E45 [DOI] [PubMed] [Google Scholar]
- 33. Armoni M. (2003) Peroxisome proliferator-activated receptor-represses GLUT4 promoter activity in primary adipocytes, and rosiglitazone alleviates this effect. J. Biol. Chem. 278, 30614–30623 [DOI] [PubMed] [Google Scholar]
- 34. Kusminski C. M., Scherer P. E. (2012) Mitochondrial dysfunction in white adipose tissue. Trends Endocrinol. Metab. 23, 435–443 [DOI] [PMC free article] [PubMed] [Google Scholar]
- 35. Spitali P., Aartsma-Rus A. (2012) Splice modulating therapies for human disease. Cell 148, 1085–1088 [DOI] [PubMed] [Google Scholar]
- 36. Hua Y., Vickers T. A., Baker B. F., Bennett C. F., Krainer A. R. (2007) Enhancement of SMN2 exon 7 inclusion by antisense oligonucleotides targeting the exon. PLoS Biol. 5, e73. [DOI] [PMC free article] [PubMed] [Google Scholar]
- 37. Hua Y., Vickers T. A., Okunola H. L., Bennett C. F., Krainer A. R. (2008) Antisense masking of an hnRNP A1/A2 intronic splicing silencer corrects SMN2 splicing in transgenic mice. Am. J. Hum. Genet. 82, 834–848 [DOI] [PMC free article] [PubMed] [Google Scholar]
- 38. Hua Y., Sahashi K., Rigo F., Hung G., Horev G., Bennett C. F., Krainer A. R. (2011) Peripheral SMN restoration is essential for long-term rescue of a severe spinal muscular atrophy mouse model. Nature 478, 123–126 [DOI] [PMC free article] [PubMed] [Google Scholar]
- 39. Dalen K. T. (2003) Expression of the insulin-responsive glucose transporter GLUT4 in adipocytes is dependent on liver X receptor. J. Biol. Chem. 278, 48283–48291 [DOI] [PubMed] [Google Scholar]
- 40. Knight J. B. (2003) Regulation of the human GLUT4 gene promoter: Interaction between a transcriptional activator and myocyte enhancer factor 2A. Proc. Natl. Acad. Sci. U.S.A. 100, 14725–14730 [DOI] [PMC free article] [PubMed] [Google Scholar]
- 41. Deng T., Sieglaff D. H., Zhang A., Lyon C. J., Ayers S. D., Cvoro A., Gupte A. A., Xia X., Baxter J. D., Webb P., Hsueh W. A. (2011) A peroxisome proliferator-activated receptor (PPAR)/PPAR coactivator 1 autoregulatory loop in adipocyte mitochondrial function. J. Biol. Chem. 286, 30723–30731 [DOI] [PMC free article] [PubMed] [Google Scholar]
- 42. Lee G., Elwood F., McNally J., Weiszmann J., Lindstrom M., Amaral K., Nakamura M., Miao S., Cao P., Learned R. M., Chen J.-L., Li Y. (2002) T0070907, a selective ligand for peroxisome proliferator-activated receptor γ, functions as an antagonist of biochemical and cellular activities. J. Biol. Chem. 277, 19649–19657 [DOI] [PubMed] [Google Scholar]
- 43. Underhill C., Qutob M. S., Yee S. P., Torchia J. (2000) A novel nuclear receptor corepressor complex, N-CoR, contains components of the mammalian SWI/SNF complex and the corepressor KAP-1. J. Biol. Chem. 275, 40463–40470 [DOI] [PubMed] [Google Scholar]
- 44. Dybkov O., Will C. L., Deckert J., Behzadnia N., Hartmuth K., Lührmann R. (2006) U2 snRNA-protein contacts in purified human 17S U2 snRNPs and in spliceosomal A and B complexes. Mol. Cell. Biol. 26, 2803–2816 [DOI] [PMC free article] [PubMed] [Google Scholar]


