

Abstract
Polarization sensitive optical coherence tomography (PS-OCT) was used to obtain spatially resolved ex vivo images of polarization changes in skeletal muscle, bone, skin and brain. Through coherent detection of two orthogonal polarization states of the signal formed by interference of light reflected from the biological sample and a mirror in the reference arm of a Michelson interferometer, the depth resolved change in polarization was measured. Inasmuch as any fibrous structure will influence the polarization of light, PS-OCT is a potentially powerful technique investigating tissue structural properties. In addition, the effects of single polarization state detection on OCT image formation is demonstrated.
Index Terms: Biological tissues, biomedical imaging, birefringence, optical tomography, polarization
I. Introduction
First reported in the field of fiber optics [1], [2], optical coherence tomography (OCT) has become an important new high resolution technique for biomedical imaging. OCT utilizes a Michelson interferometer with a low coherence source to measure light reflected from turbid structures with high spatial resolution (~10 μm) and sensitivity (>100 dB) [3]. OCT has been used to image the eye [4], skin [5]–[7], aero-digestive tracts [8], and cervical dysplasia and carcinoma in situ [9]. In these studies, OCT images displayed the spatially resolved magnitude of reflected light. Except for an early study reported by Hee et al. [10], the polarized nature of light was not considered until recently [11]–[13]. Here we illustrate the importance of polarization changes in reflected light in a variety of biological tissues, such as skeletal muscle, bone, skin and brain. PS-OCT provides high resolution spatial information on the polarization state of light reflected from the tissue not discernible using existing diagnostic optical methods. Furthermore, the polarization effects on OCT images are illustrated in rodent skin by showing separately the images recorded by each detector.
II. Instrument
Fig. 1 shows a schematic of the PS-OCT system used in our experiments. Light from a superluminescent diode (SLD), 0.8-mW output power, central wavelength λ0 = 856 nm and spectral FWHM Δλ = 25 nm, passed through a polarizer (P) to select a pure linear horizontal input state, and was split into reference and sample arms by a polarization insensitive beamsplitter (BS). Light in the reference arm passed through a zeroth-order quarter-wave plate (QWP) oriented at 22.5° to the incident horizontal polarization. Following reflection from a mirror attached to a piezoelectric transducer (PZT), retroreflector, and return pass through the QWP, light in the reference arm had a linear polarization at 45° with respect to the horizontal. The normal to the plane of the PZT driven mirror made an angle of 11° with respect to the incident light. The mirror on the PZT modulated the reference arm length over 20 μm to generate a carrier frequency. The PZT retroreflector assembly was mounted on a translation stage to allow for active focus tracking in the sample [14]. For improved signal to noise ratio [15], a neutral density filter (NDF) positioned in the reference arm reduced intensity noise by a factor of 50.
Fig. 1.
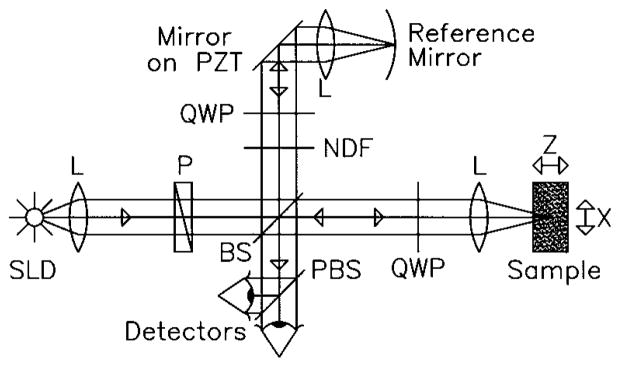
Schematic of the PS-OCT system. SLD: superluminescent diode. L: Lens. P: Polarizer. BS: Beam splitter. QWP: Quarter-wave plate. NDF: Neutral density filter. PBS: Polarizing beam splitter. PZT: Piezoelectric transducer. 2-D images were formed by lateral movement of the sample at constant velocity (x-direction), repeated after each longitudinal displacement (z-direction).
Light in the sample arm passed through a QWP oriented at 45° to the incident horizontal polarization producing circularly polarized light incident on the sample. After double passage through a lens L (f = 50 mm) and the sample, and propagation through the QWP, light in the sample arm was in an arbitrary (elliptical) polarization state, determined by the sample birefringence. After recombination in the detection arm, the light was split into its horizontal and vertical components by a polarizing beamsplitter (PBS) and focused (f = 50 mm) on 25-μm-diameter pinholes placed directly in front of the detectors to detect a single polarization and spatial mode.
Two dimensional images were formed by lateral movement of the sample at constant velocity v (x-direction), repeated after each longitudinal displacement (z-direction). The carrier frequency f ≈ 6 kHz was generated by displacing the PZT driven mirror with a 50-Hz triangular or 100-Hz sawtooth waveform. Transverse and longitudinal pixel sizes of the images were, respectively, the product of the transverse velocity v and the time duration of a single ramp of the PZT waveform (10 ms for both waveforms), and the longitudinal displacement between transverse scans. Transverse and axial image resolutions were ~15 μm and ~10 μm, respectively, determined by the beam waist at the focal point and the coherence length of the source.
III. Theory
The polarization state in each arm of the interferometer was computed using the Jones matrix formalism. In the calculation, it was assumed that the polarization changes in the sample are due to birefringence. The horizontal AH and vertical AV polarized components of the interference intensity between light in the sample and reference paths were detected separately. Since light from the reference arm was split equally into the horizontal and vertical polarization states, AH and AV were proportional to the light amplitude fields reflected from the sample [11],
| (1) |
| (2) |
where Δz was the optical path length difference between the sample and reference arms of the interferometer, z the depth of light reflected from the sample, R(z) described the reflectivity at depth zs and the attenuation of the coherent beam by scattering, k0 = 2π/λ0, , c the speed of light in a vacuum, δ the birefringence given by the difference in refractive indices along the fast and slow axes of the sample (δ = ns − nf) and α the angle of the fast optical axis measured with respect to the vertical. In addition to the carrier frequency (cos[2k0Δz]) within the coherence envelope (exp[−(ΩΔz/c)2]), both signals oscillated with a periodicity determined by the product of sample birefringence δ and propagation depth z.
Signals AH and AV were bandpass filtered between 3–10 kHz and digitized at 5 × 10⁴ points per second each. The central 256 points of a single ramp of the piezoelectric transducer were digitally bandpass filtered between 5–7 kHz, squared, and averaged over those 256 points (which corresponded to averaging over a 10-μm-length modulation of the reference arm). The resulting signals gave the horizontal and vertical reflected intensities as a function of depth z, modulated with their respective birefringence dependent terms, IH(z) = R(z)sin2(k0zδ), IV(z) = R(z)cos2(k0zδ).
OCT images were formed by grayscale coding the common log of the sum of both polarization channels, IS(z) = IH(z) + IV(z), from 0 to −48 dB, where the 0 dB level corresponded to the maximum signal in an image and the noise level was below −54 dB, determined by the signal above the sample surface. The PS-OCT images were formed by grayscale coding the birefringence induced phase retardation,
| (3) |
from 0° to 90°. Contour lines indicating −16 and −32-dB intensity and 30° and 60° phase retardation levels in the OCT and PS-OCT images, respectively, were calculated after low pass filtering by convolving the images with a Gaussian filter of 4 × 4 pixels and overlayed with the original image.
IV. Experiment and Discussion
In Fig. 2, four OCT and PS-OCT images made within hours postmortem are shown of rat skeletal muscle, bone, skin and brain; all tissues studied show birefringence in the PS-OCT images. The birefringence in Fig. 2(a) is attributed to the high structural order (anisotropy) of skeletal muscle fibers. Several periods of the phase retardation ϕ, cycling from 0–90° and back, are observed. The greater birefringence in skeletal muscle (δ = 2.2 × 10⁻³) as compared to the myocardium reported by Everett et al. [12] can be attributed to the different wavelengths used (850 nm versus 1300 nm), and to the structural difference between these two types of muscle. In the myocardium, the fibers are oriented in different directions, and not necessarily parallel to the muscle surface. The skeletal muscle imaged in Fig. 2(a) shows a high degree of fiber alignment.
Fig. 2.
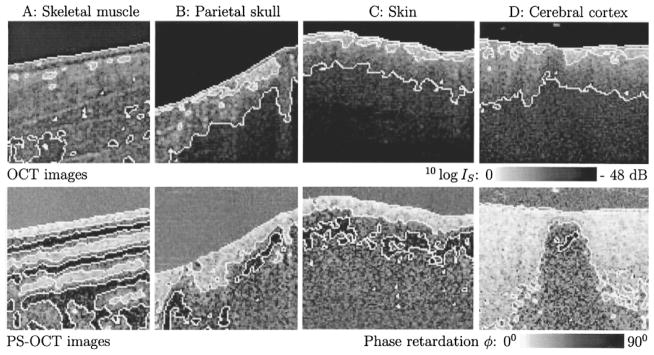
Upper panel shows OCT images. White lines are contours at −16 dB (white to gray transition) and −32 dB (gray to black transition) intensity levels, respectively. Lower panel shows PS-OCT images. White lines are contours at 30° (white to gray transition) and 60° (gray to black transition) phase retardation levels, respectively. The phase retardation above the sample surfaces was ≈45°, determined by an approximately equal noise level in each polarization channel. A: 1 mm × 1 mm image of ex vivo rat skeletal muscle. Three periods of the phase retardation can be observed in the PS-OCT image; such detail is not discernible in the OCT image. B: 1 mm × 1 mm image of ex vivo rat parietal skull. C: 1.2 mm × 1 mm image of ex vivo rat skin. PS-OCT images B and C show dark islands below the surface confined by the 60° phase contour line. D: 1.2 mm × 1 mm image of dissected ex vivo rat cerebral cortex. The birefringent region in the PS-OCT image is a strip of white matter, surrounded by gray matter.
The birefringence observed in Fig. 2(B) and (C) is attributed to the presence of collagen in bone and skin, respectively. Fig. 2(D) shows a scan of dissected cerebral cortex which was made perpendicular to a strip of white matter, dividing an adjacent area of gray matter. As seen in the PS-OCT image, the gray matter minimally influences polarization, while considerable birefringence is observed in the white matter, which largely consists of myelin, a fibrous structure containing nerve bundles.
Both birefringence and scattering by particles [16], [17] can change the polarization state of light propagating through turbid media. Birefringence is likely to be the dominant factor for the images presented in Fig. 2. Except for scatterers arranged in a macroscopic order, scattering would change the polarization state in a random manner. The largest change would be a complete scrambling of the polarization, in which case the signal amplitude on each detector would be equal, which corresponds to a phase retardation calculated from (3) of 45°. All images in Fig. 2 show large area’s with a phase retardation of 60° or more, which is a strong indication for birefringence. Even stronger evidence for birefringence can be provided by measuring the Stokes vector of the reflected light. We demonstrated recently that the depth resolved Stokes vector of the reflected light can be calculated with PS-OCT [18]. It was also shown that the change of the Stokes vector with depth in rodent muscle and skin was consistent with birefringence.
Calculation of the Stokes vector with our instrument can be summarized as follows: if the interference fringes are maximized on one detector, and minimal on the other, the polarization state is linear in either the horizontal or vertical plane, which corresponds to the Stokes parameter Q being one or minus one. If the interference fringes on both detectors are of equal amplitude and exactly in phase, or exactly π out of phase, the polarization state is linear, at 45° with the horizontal or vertical, corresponding to the Stokes parameter U. If the interference fringes on both detectors are of equal amplitude and are exactly π/2 or π/2 out of phase, the polarization state is circular, corresponding to the Stokes parameter V.
Fig. 3 shows six images reconstructed from a single scan of rodent skin, 3 weeks post exposure to a 100 °C brass rod for 20 s. The six images display, respectively, in the left column from top to bottom the sum of the reflected intensity detected by the detectors, the vertically polarized reflected intensity (detector 1), the horizontally polarized reflected intensity (detector 2), and, in the right column from top to bottom, the Stokes parameters Q, U, and V. The Stokes parameters were calculated as described in [18] and give the polarization state of light reflected from the sample before the return pass through the QWP. Images display the Stokes parameters normalized on the intensity and grayscale coded from 1 to −1. Contour lines indicating 1/3 and −1/3 values were calculated after low pass filtering by convolving the images with a Gaussian filter of 4 × 4 pixels and overlayed with the original image. The scan was made from normal (left) into thermal damaged skin with scar formation (right).
Fig. 3.
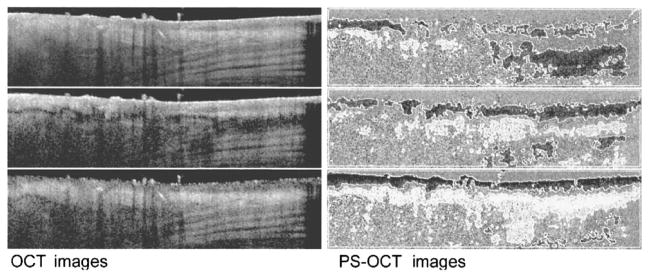
OCT and PS-OCT images generated from a single scan of rodent skin, three weeks post exposure to a 100 °C brass rod for 20 s. Image size is 4 mm × 1 mm. The six images display, respectively, in the left column from top to bottom, the sum of the reflected intensity detected by the detectors, the vertically polarized reflected intensity (detector 1) and the horizontally polarized reflected intensity (detector 2) gray-scale coded on a logarithmic scale, and, in the right column from top to bottom, the normalized Stokes parameters Q, U, and V gray scale coded from 1 to −1. White lines are contours at 1/3 (white to gray transition) and −1/3 (gray-to-black transition) values. The scan was made from normal (left) into thermal damaged skin with scar formation (right). Punch biopsy and histological evaluation of the imaged location indicate that the banded structure in the lower right half of the summed intensity image is muscle tissue.
Two interesting observations can be made. First, the images recorded by a single detector show dark area’s suggesting low tissue reflectivity that are completely absent in the summed image. These features are solely due to polarization changes in the tissue, and are not correlated with tissue reflectivity. Images of the Stokes parameters show the polarization state changing from circular to linear and back as a function of increasing depth.
Second, the summed image has a smoother appearance than the single channel images, which suggests that speckle noise is averaged. Presently, speckle averaging algorithms in OCT use four detectors recording light that has traveled over a slightly different path through the sample to the focal point and back [19], [20]. Wavefront distortions by tissue inhomogeneities create a different speckle pattern at each detector. However, implementation of this approach in a single-mode fiber (SMF) is difficult. Since light has two degrees of freedom, at each spatial location two (partially) independent speckle patterns are present, one in each polarization channel. Summing the images recorded in orthogonal polarization channels provides an alternative approach to speckle averaging that is simple to implement in an SMF. The number of images with (partially) independent speckle patterns can be further increased by modulating the polarization incident on the sample over orthogonal states. Two additional (partially) independent images can be recorded, giving four interference signals available for speckle averaging, which would increase the signal to noise ratio (SNR) by a factor of 2. However, the actual increase in SNR that can be realized may be less, since the speckle patterns in orthogonally polarized channels need not be completely independent due to the low order scattering nature of OCT signals [21].
V. Conclusion
In summary, inasmuch as collagen is present in many tissues, such as skin, bone and tendon, PS-OCT is important not only to measure birefringence, but also for accurate interpretation of OCT images. Single detector OCT systems can generate images that show structural properties by a reduction in tissue reflectivity, that are solely due to polarization effects. Furthermore, most fibrous structures in tissue (e.g., muscle, nerve fibers) are birefringent due to their anisotropy. Polarization diversity detection and polarization modulation in the sample arm could be interesting approaches to speckle averaging in SMF-based OCT systems. PS-OCT offers a non-contact technique for spatially resolved birefringence imaging that reveals structure not discernible with other diagnostic optical methods.
Acknowledgments
This work was supported by research grants from the Institute of Arthritis, Musculoskeletal and Skin Diseases and the National Center for Research Resources at the National Institutes of Health, Department of Energy, Office of Naval Research, the Whitaker Foundation and the Beckman Laser Institute Endowment
Biographies
Johannes F. de Boer, for photograph and biography, see this issue, p. 1167.
Shyam M. Srinivas, for photograph and biography, see this issue, p. 1141.

B. Hyle Park received the B.S. degree in physics from the California Institute of Technology, Pasadena, CA, in 1996. He is currently in his second year of graduate school in the Physics Department, University of California at Irvine.
His research interests are in optical coherence tomography, polarization sensitive optical coherence tomography, and optical Doppler tomography.

Tuan H. Pham received the B.S. degree in both electrical engineering and biological science from the University of California atIrvine in 1993. He is an M.D. and Ph.D. Candidate at the University of California, Irvine, with a Ph.D. in electrical engineering.
Zhongping Chen, for photograph and biography, see this issue, p. 1141.
Thomas E. Milner, for photograph and biography, see this issue, p. 1066.
J. Stuart Nelson, for photograph and biography, see this issue, p. 1066.
Contributor Information
Johannes F. de Boer, Beckman Laser Institute and Medical Clinic, University of California, Irvine, CA 92612 USA
Shyam M. Srinivas, Beckman Laser Institute and Medical Clinic, University of California, Irvine, CA 92612 USA
B. Hyle Park, Beckman Laser Institute and Medical Clinic, University of California, Irvine, CA 92612 USA.
Tuan H. Pham, Beckman Laser Institute and Medical Clinic, University of California, Irvine, CA 92612 USA
Zhongping Chen, Beckman Laser Institute and Medical Clinic, University of California, Irvine, CA 92612 USA.
Thomas E. Milner, Biomedical Engineering Program, University of Texas at Austin, Austin, TX 78712 USA
J. Stuart Nelson, Beckman Laser Institute and Medical Clinic, University of California, Irvine, CA 92612 USA.
References
- 1.Takada K, Yokohama I, Chida K, Noda J. New measurement system for fault location in optical waveguide devices based on an interferometric technique. Appl Opt. 1987;26:1603–1606. doi: 10.1364/AO.26.001603. [DOI] [PubMed] [Google Scholar]
- 2.Danielson BL, Whittenberg CD. Guided-wave reflectometry with micrometer resolution. Appl Opt. 1987;26:2836. doi: 10.1364/AO.26.002836. [DOI] [PubMed] [Google Scholar]
- 3.Huang D, Swanson EA, Lin CP, Schuman JS, Stinson WG, Chang W, Hee MR, Flotte T, Gregory K, Puliafito CA, Fujimoto JG. Optical coherence tomography. Science. 1991 Nov;254:1178–1181. doi: 10.1126/science.1957169. [DOI] [PMC free article] [PubMed] [Google Scholar]
- 4.Fercher AF, Mengedoht K, Werner W. Eye-length measurement by interferometry with partially coherent light. Opt Lett. 1988;13:186. doi: 10.1364/ol.13.000186. [DOI] [PubMed] [Google Scholar]
- 5.Schmitt JM, Yadlowsky M, Bonner RF. Subsurface imaging of living skin with optical coherence microscopy. Dermatol. 1995;191:93. doi: 10.1159/000246523. [DOI] [PubMed] [Google Scholar]
- 6.Gelikonov VM, Gelikonov GV, Kuranov RV, Pravdenko KI, Sergeev AM, Feldshtein FI, Khanin Ya I, Shabanov DV. Coherent optical tomography of microscopic inhomogeneities in biological tissues. JETP Lett. 1995 Jan;61(2):158–162. [Google Scholar]
- 7.Welzel J, Lankenau E, Birngruber R, Engelhardt R. Optical coherence tomography of the human skin. J Amer Acad Dermatol. 1997;37(6):958–963. doi: 10.1016/s0190-9622(97)70072-0. [DOI] [PubMed] [Google Scholar]
- 8.Tearney GJ, Brezinski ME, Bouma BE, Boppart SA, Pitris C, Southern JF, Fujimoto JG. In vivo endoscopic optical biopsy with optical cohernce tomography. Science. 1997 Jun;276:2037–2039. doi: 10.1126/science.276.5321.2037. [DOI] [PubMed] [Google Scholar]
- 9.Sergeev AM, Gelikonov VM, Gelikonov GV, Feldchtein FI, Kuranov RV, Gladkova ND. In vivo endoscopic oct imaging of precancer and cancer states of human mucosa. Opt Express. 1997 Dec;1(13):432–440. doi: 10.1364/oe.1.000432. [DOI] [PubMed] [Google Scholar]
- 10.Hee MR, Huang D, Swanson EA, Fujimoto JG. Polarization-sensitive low-coherence reflectometer for birefringence characterization and ranging. J Opt Soc Amer B. 1992 Jun;9(6):903–908. [Google Scholar]
- 11.de Boer JF, Milner TE, van Gemert MJC, Nelson JS. Two-dimensional birefringence imaging in biological tissue using polarization sensitive optical coherence tomography. Opt Lett. 1997 Jun;22(12):934–936. doi: 10.1364/ol.22.000934. [DOI] [PubMed] [Google Scholar]
- 12.Everett MJ, Schoenenberger K, Colston BW, Jr, Da Silva LB. Birefringence characterization of biological tissue by use of optical coherence tomography. Opt Lett. 1998 Feb;23(3):228–230. doi: 10.1364/ol.23.000228. [DOI] [PubMed] [Google Scholar]
- 13.de Boer JF, Srinivas SS, Malekafzali A, Chen Z, Stuart Nelson J. Imaging thermally damaged tissue by polarization sensitive optical coherence tomography. Opt Express. 1998 Sep;3(6):212–218. doi: 10.1364/oe.3.000212. [DOI] [PubMed] [Google Scholar]
- 14.Chen Z, Milner TE, Dave D, Stuart Nelson J. Optical doppler tomographic imaging of fluid flow velocity in highly scattering media. Opt Lett. 1997;22(64):64. doi: 10.1364/ol.22.000064. [DOI] [PubMed] [Google Scholar]
- 15.Sorin WV, Baney DM. A simple intensity noise reduction technique for optical low-coherence reflectometry. IEEE Photonics Tech Lett. 1992 Dec;4(12):1404–1406. [Google Scholar]
- 16.Schmitt JM, Xiang SH. Cross-polarized backscatter in optical coherence tomography of biological tissue. Opt Lett. 1998 Jul;23(13):1060–1062. doi: 10.1364/ol.23.001060. [DOI] [PubMed] [Google Scholar]
- 17.Mishchenko MI, Hovenier JW. Depolarization of light backscattered by randomly oriented nonspherical particles. Opt Lett. 1995 Jun;20(12):1356–1358. doi: 10.1364/ol.20.001356. [DOI] [PubMed] [Google Scholar]
- 18.de Boer JF, Milner TE, Stuart Nelson J. Determination of the depth resolved stokes parameters of light backscattered from turbid media using polarization sensitive optical coherence tomography. Opt Lett. 1999;5:300–302. doi: 10.1364/ol.24.000300. [DOI] [PubMed] [Google Scholar]
- 19.Xiang SH, Zhou L, Schmitt JM. Speckle noise reduction for optical coherence tomography. Proc SPIE. 1997;3196:79–88. [Google Scholar]
- 20.Schmitt JM. Array detection for speckle reduction in optical coherence microscopy. Phys Med Biol. 1997 Jul;42(7):1427–1439. doi: 10.1088/0031-9155/42/7/015. [DOI] [PubMed] [Google Scholar]
- 21.Schmitt JM, Xiang SH, Yung KM. Speckle in optical coherence tomography. J Biomed Opt. 1999;4:95–105. doi: 10.1117/1.429925. [DOI] [PubMed] [Google Scholar]