. 2014 Nov 4;3:e02999. doi: 10.7554/eLife.02999

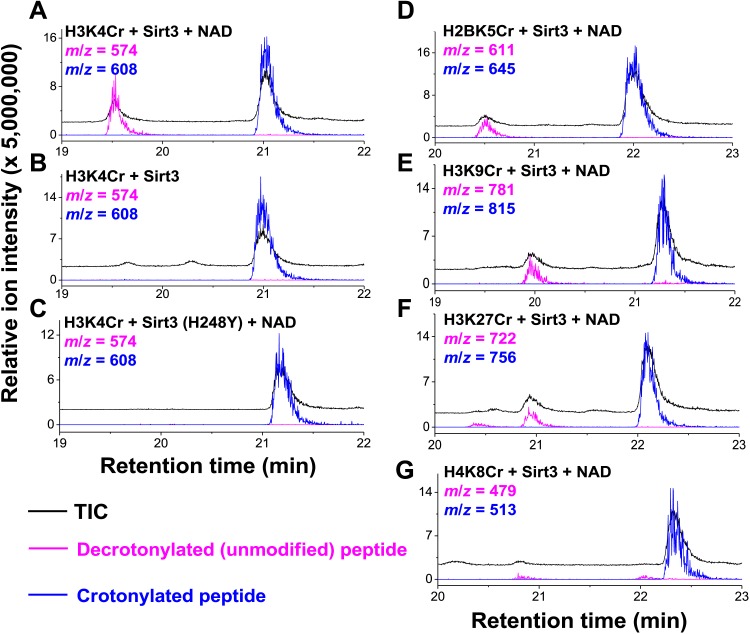
Figure 4. Sirt3 catalyzes the hydrolysis of crotonyl lysine in vitro.

(AC) The hydrolysis of the crotonylated peptides by Sirt3 was analyzed by liquid chromatography–mass spectrometry. The hydrolysis of H3K4Cr was observed with Sirt3 in the presence (A), but not absence of nicotinamide adenine dinucleotide (NAD) (B), or with the mutated Sirt3, H248Y (C). (DG) Sirt3 showed varied decrotonylation activities towards H2BK5Cr (D), H3K9Cr (E), H3K27Cr (F), and H4K8Cr (G) peptides. Black traces show total ion intensity for all ion species with m/z from 300 to 2000 (i.e., total ion counts, TIC); pink traces show ion intensity (5× magnified) for the masses of decrotonylated (unmodified) peptides; and blue traces show ion intensity (5× magnified) for the masses of crotonylated peptides.

DOI: http://dx.doi.org/10.7554/eLife.02999.011

Figure 4.

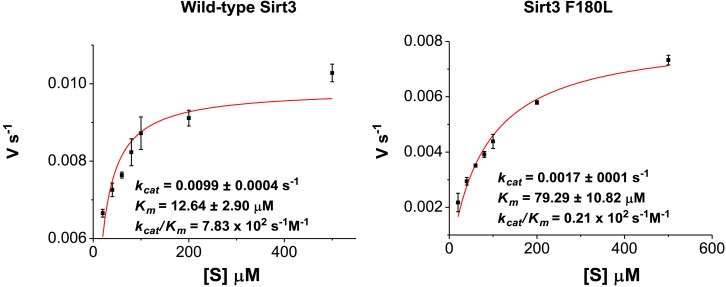
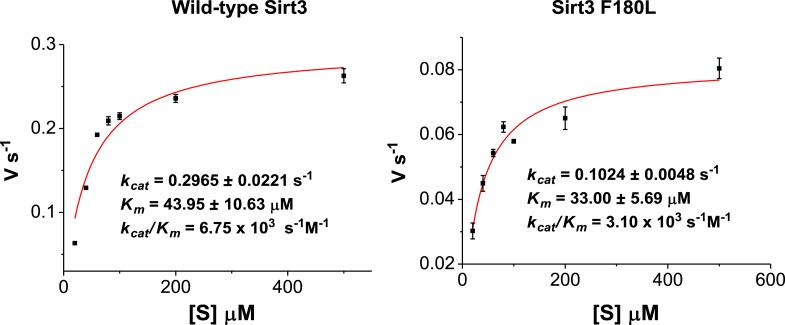
Figure 4—figure supplement 1. Michaelis–Menten plots showing the kinetics of Sirt3 and mutant Sirt3 (F180L) decrotonylation on H3K4Cr.

Figure 4—figure supplement 1.

The enzyme concentrations and reaction times were used as indicated in ‘Materials and methods’. For kinetic parameters, values are reported as mean ± s.e. (n=3).
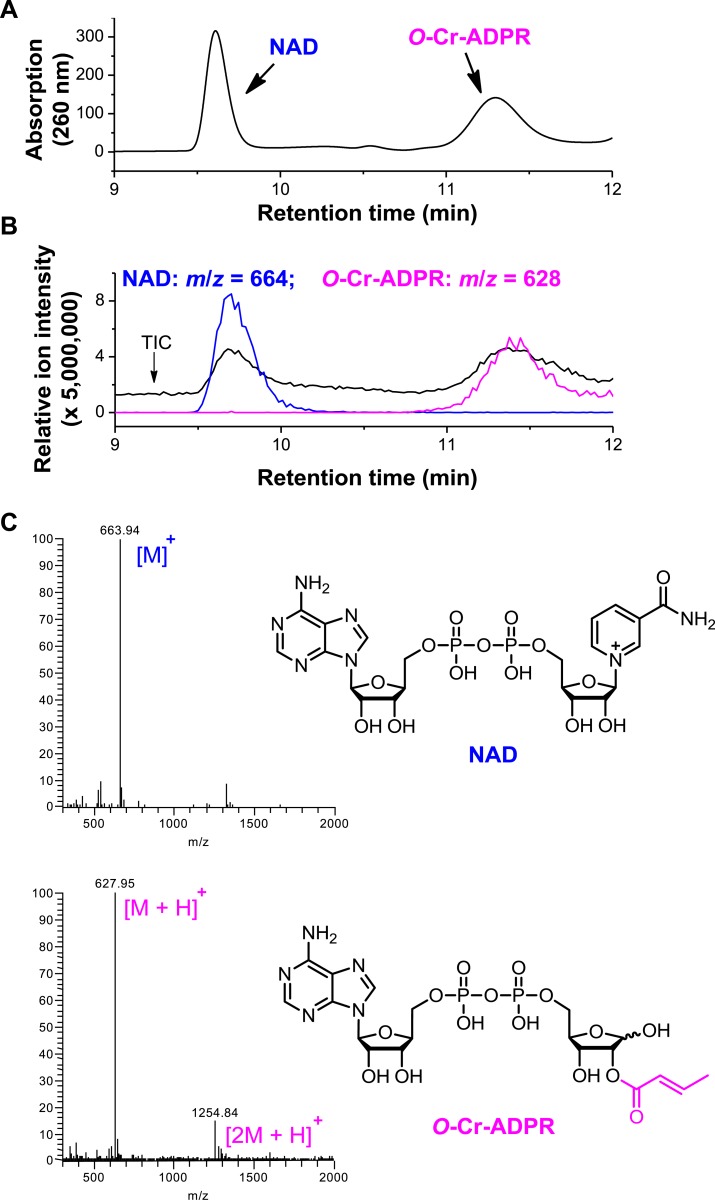
Figure 4—figure supplement 2. Detection of O-crotonyl-adenosine 5ʹ-diphosphoribose (O-Cr-ADPR) by liquid chromatography–mass spectrometry (LC-MS).

Figure 4—figure supplement 2.

The reaction mixture of Sirt3 catalyzed nicotinamide adenine dinucleotide (NAD) dependent decrotonylation of H3K4Cr peptide was analyzed by LC-MS. Partial chromatogram of the reaction mixture with UV (260 nm) (A) and mass detector (B). In (B), the black trace shows total ion intensity for all ion species with m/z from 300 to 2000 (i.e., total ion counts, TIC); blue trace shows ion intensity (5× magnified) for the mass of NAD (m/z = 664); and pink trace shows ion intensity (5× magnified) for the mass of O-Cr-ADPR (m/z = 628). (C) ESI-MS spectra of NAD and O-Cr-ADPR.
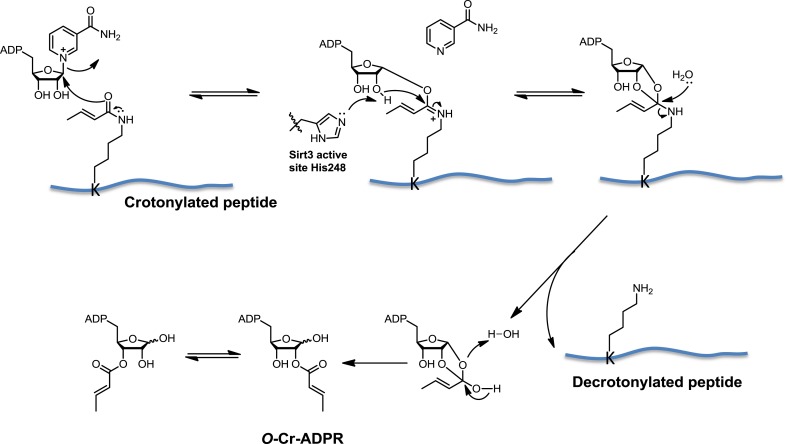
Figure 4—figure supplement 3. Proposed mechanism of Sirt3 catalyzed nicotinamide adenine dinucleotide dependent decrotonylation.

Figure 4—figure supplement 3.

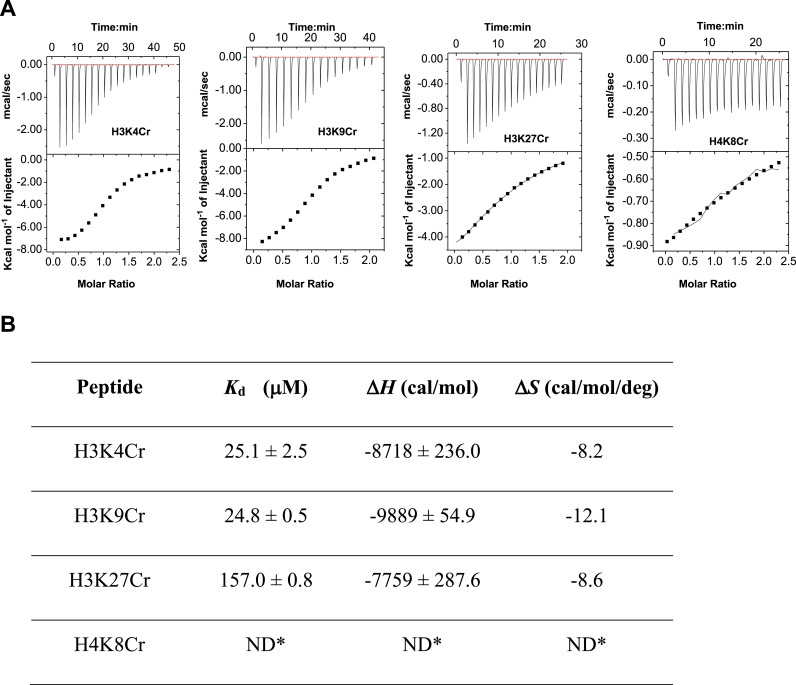
Figure 4—figure supplement 4. ITC measurement for the binding affinity of Sirt3 toward crotonylated histone peptides.

Figure 4—figure supplement 4.

(A) Isothermal titration calorimetry measurement for the binding affinities of Sirt3 towards H3K4Cr, H3K9Cr, H3K27Cr, and H4K8Cr. (B) A summary of dissociation constants (Kd), enthalpy changes (ΔH), and entropy changes (ΔS) of Sirt3 for the crotonylated peptides.
Figure 4—figure supplement 5. Decrotonylation activity of sirtuins in vitro. The hydrolysis of the H3K4Cr peptide by sirtuins was analyzed by liquid chromatography–mass spectrometry.

Figure 4—figure supplement 5.

(AC) Sirt1, Sirt2, and Sirt3 showed significant decrotonylation activities towards H3K4Cr. (D, E) Sirt5 and Sirt6 showed little decrotonylation activities towards H3K4Cr. Black traces show total ion intensity for all ion species with m/z from 300 to 2000 (i.e., total ion counts, TIC); pink traces show ion intensity (5× magnified) for masses of decrotonylated (unmodified) peptides; and blue traces show ion intensity (5× magnified) for masses of crotonylated peptides.
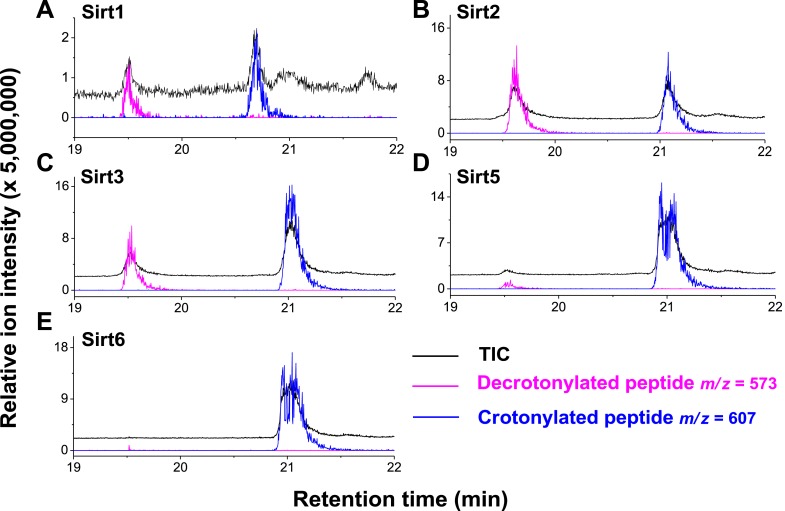
Figure 4—figure supplement 6. Michaelis–Menten plots showing the kinetics of Sirt3 and mutant Sirt3 (F180L) deacetylation on H3K4Ac.

Figure 4—figure supplement 6.

The enzyme concentrations and reaction times were used as indicated in ‘Materials and methods’. For kinetic parameters, values are reported as mean ± s.e. (n=3).