

Abstract
Distinguishing ulcerative colitis (UC) from Crohn’s disease (CD) is sometimes difficult in a clinical setting. The purpose of this study was to identify a series of independent serum markers capable of distinguishing between UC and CD. 140 UC and 174 CD patients hospitalized at The First Affiliated Hospital, College of Medicine, Zhejiang University were recruited into this study. A panel of serum markers was quantified for each patient and the Bayesian information criterion (BIC) was used to determine a discrimination model. The receiver operating characteristic (ROC) was used to evaluate the performance of the model, and the area under the ROC curve (AUC) was used to evaluate the accuracy of the model. Serum albumin (Alb), total cholesterol (TC), total calcium (TCa), platelet (Plt), glycyl proline dipeptidyl aminopeptidase (GPDA) and their ratios (Alb: Plt, Alb: GPDA, TCa: TC, and Plt: GPDA) were selected into the diagnosis model using BIC. The resulting CD/UC Index (CUI) is CUI = 1.901 + 0.425 Alb - 3.324 TC - 7.444 TCa + 0.018 Plt + 0.087 GPDA - 0.0007 Alb: Plt - 0.004 Alb: GPDA + 1.839 TC: TCa + 0.003 Plt: GPDA, with CUI > 0 incrementally favored a diagnosis of UC, while CUI < 0 corresponded to a higher likelihood of a diagnosis of CD. An average value of the AUC for the CUI model is 0.73 (95% confidence interval: 0.67-0.80). The CUI, derived from commonly available serum biomarkers, could try to differentiate UC from CD in patients with unclear clinical features as a new approach to diagnosis.
Keywords: Ulcerative colitis, Crohn’s disease, serum biomarkers, diagnostic model
Introduction
A diagnosis of inflammatory bowel disease (IBD) is traditionally based on a combination of clinical, endoscopic, histological, and radiological criteria. In clinical practice, it is often necessary to determine whether the intestinal inflammation is the result of ulcerative colitis (UC) or Crohn’s disease (CD). However, distinguishing between UC and CD is sometimes difficult owing to the unreliable or incomplete clinical history, ambiguous endoscopic and radiological findings, and inadequate biopsies. Biomarkers such as C-reactive protein (CRP) and the erythrocyte sedimentation rate (ESR) are usually used in the diagnosis of IBD [1,2]. However, the use of a single biomarker is often insufficient for a conclusive diagnosis of disease. Clinicians have long sought reliable serologic markers to predict IBD prognosis and response to therapy [3]. We believe that a combination of serum biomarkers, some of which are commonly used in the clinical workup, might be the most feasible approach. How to find a combinational model with these biomarkers and measure the quality of the model? It could be an interesting attempt to combine clinical findings and statistical methods. Therefore, we analyzed a series of serological markers in the serum of patients with UC and CD and integrated them into a statistically predictive model for diagnosis. The aim of our study was to derive and test a model based on independent serum markers to distinguish UC from CD.
Materials and methods
Patients
From February 2006 to February 2011, 140 UC and 174 CD new patients hospitalized at The First Affiliated Hospital, College of Medicine, Zhejiang University were recruited with written informed consent and all procedures were done in accordance with the Ethics Committee approval of Zhejiang University School of Medicine. UC and CD were diagnosed based on conventional radiological, endoscopic, and histological criteria. The locations of the disease for this patient were all in the colon, Patients with indeterminate colitis, severe hepatic or renal dysfunction, or a history of oral contraceptives, blood-lipid lowering drugs or calcium tablets were excluded. The symptoms of this patient in this study were serious according to the initial diagnosis of the outpatient department or emergency department, they needed to accept diagnosis and treatment in the inpatient department. As the patients were new cases, none of the patients admitted to this study had been on any anti-IBD therapies before hospitalization, which included 5-aminosalicylic acid, immunosuppressive agents, corticosteroid, monoclonal antibodies and so on.
Laboratory assessments
Peripheral venous blood samples were collected and a panel of serum biomarkers was quantified at the first hospitalization. The chosen serum markers reflect nutritional status, metabolic disorders and inflammatory changes associated with IBD [4-10]. The biomarkers tested included albumin (Alb), total cholesterol (TC), high-density lipoprotein cholesterol (HDLc), total calcium (TCa), fibrinogen (Fg), C-reactive protein (CRP), the erythrocyte sedimentation rate (ESR) and platelet count (Plt). Moreover, another serum marker, glycyl proline dipeptidyl aminopeptidase (GPDA), was measured because we found it to be associated with IBD when we performed a preliminary analysis of the data. The association between GPDA and IBD was further analyzed in this study.
Statistical analysis
We fit two logistic regression models to the disease status of our patient population. In the first model, only the traditional predictors (Alb, TC, HDLc, TCa, Fg, CRP, ESR, and Plt) and their two-way interactions were included. In the second model, the new predictor (GPDA) and the two-way interactions between GPDA and the traditional predictors were added. Those predictors and the interactions passing the Bayesian information criterion (BIC) were kept in the final models [11]. The predictors and the interactions in the final models will be referred to as ‘working predictors’.
To check the validity of the final fitted model, we estimated the dispersion parameter using residuals after model fitting (the dispersion parameter equals 1 implies that the model does not deviate from the logistic regression model), and presented the component and residual plots for all working predictors [12].
The final models can be used to predict the disease status (CD vs. UC). That is, for each patient for which there is information for the working predictors, one can predict the probability of affecting UC, and this patient is diagnosed as a UC patient if the predicted probability is greater than a threshold value.
The receiver operator characteristic (ROC) is commonly used to evaluate the performance of a diagnostic test, and the area under the ROC curve (AUC), or c-statistic, is a measure of evaluating the accuracy of a diagnostic test. To estimate the ROC curve, or the AUC, we randomly split all patients into two equal populations. One population was used as a training sample (consisting of half of the CD patients and half of the UC patients) and the other served as a test sample. Next, the regression parameters in the final models (the disease status regressed on the working predictors) were estimated based on the training sample, and the estimated parameters were used to predict the probability of affecting UC for each patient in the test sample. Finally, the ROC curve and the AUC were estimated using the predicted probabilities based on the diagnostic procedure described previously. To eliminate the variation due to random splitting of the sample, we repeated the above procedure for a large number of times, and the average value of the resulting ROCs (and AUCs) had a very small variation since the number of repetitions was large.
The confidence intervals and P-values are based on normal approximations of the corresponding estimates and Wald tests. A value of P less than 0.05 was considered statistically significant.
Results
Demographic and biological characteristics of IBD patients
One hundred forty UC patients (77 males, 63 females, male/female ratio, 1.22/1.00) with a mean age of 44.57 ± 15.57 years, and 174 CD patients (115 males, 59 females, male/female ratio, 1.95/1.00) with a mean age of 34.59 ± 15.18 years were recruited into this study. A comparison of each predictor and the disease status was evaluated without adjusting for any confounder (Table 1), and Alb, TC, HDLc, CRP were found to be significantly associated with disease status.
Table 1.
Single predictor association analysis results without adjusting for confounders
| Mean in CD patients | Mean in UC patients | Difference | 2.5% limit | 97.5% limit | t-statistic | P-value | Sig. level | |
| Alb (g/L) | 34.98 | 37.02 | 2.04 | -0.44 | -3.63 | 2.50 | 1.28e-2 | * |
| TC (mmol/L) | 3.07 | 3.54 | 0.47 | 0.26 | 0.68 | 4.36 | 1.80e-5 | *** |
| HDLc (mmol/L) | 0.92 | 1.02 | 0.10 | -0.02 | 0.18 | 2.47 | 1.39e-2 | * |
| TCa (mmol/L) | 2.12 | 2.13 | 0.02 | -0.03 | 0.06 | 0.73 | 0.47 | |
| Fg (g/L) | 3.96 | 3.68 | -0.27 | -0.57 | 0.02 | -1.83 | 6.89e-2 | |
| CRP (mg/L) | 44.85 | 27.9 | -16.95 | -26.22 | -7.68 | -3.6 | 3.70e-4 | *** |
| ESR (mm/H) | 30.06 | 27.45 | -2.61 | -7.96 | 2.74 | -0.96 | 0.34 | |
| Plt (× 109/L) | 304.82 | 281.31 | -23.5 | -50.97 | 3.96 | -1.68 | 9.33e-2 | |
| GPDA (U/L) | 45.21 | 45.01 | -0.2 | -4.91 | 4.51 | -0.08 | 0.93 |
Significance codes: 0 < ’***’ < 0.001 < ’**’ < 0.01 < ’*’ < 0.05.
Establishment of a model to distinguish UC from CD
We examined two diagnostic methods. One method involved the traditional predictors (null model) and the other included the additional predictor GPDA (alternative model). We used the BIC to select those predictors associated with disease status. The fitted null model and the fitted alternative model are summarized in Table 2, respectively. In the null model, the predictors Alb, TC, Plt, and the interaction Alb: Plt were selected using BIC. In the alternative model, the new predictor GPDA and an additional traditional predictor TCa and the interactions Alb: Plt, Alb: GPDA, TCa: TC, and Plt: GPDA were selected. The resulting CD/UC Index (CUI) is CUI = 1.901 + 0.425 Alb - 3.324 TC - 7.444 TCa + 0.018 Plt + 0.087 GPDA - 0.0007 Alb: Plt - 0.004 Alb: GPDA + 1.839 TC: TCa + 0.003 Plt: GPDA.
Table 2.
Summary of the null model (without GPDA) and the alternative model (with GPDA) for distinguishing between UC and CD
| Log odds ratio | Std. Error | z-value | P-value | Sig. level | |
|---|---|---|---|---|---|
| Null model | |||||
| (Intercept) | -7.142 | 1.940 | -3.681 | 2.32e-4 | *** |
| Alb (g/L) | 1.60e-1 | 5.43e-2 | 2.951 | 3.163e-3 | ** |
| TC (mmol/L) | 4.81e-1 | 1.50e-1 | 3.211 | 1.324e-3 | ** |
| Plt (× 109/L) | 1.65e-2 | 5.70e-3 | 2.896 | 3.783e-3 | ** |
| Alb: Plt | -5.11e-4 | 1.65e-4 | -3.098 | 1.946e-3 | ** |
| Alternative model | |||||
| (Intercept) | 1.90 | 5.13 | 0.37 | 0.71 | |
| Alb (g/L) | 4.25e-1 | 8.25e-2 | 5.15 | 2.6e -07 | *** |
| TC (mmol/L) | -3.32 | 1.53 | -2.17 | 3.00e-2 | * |
| Tca (mmol/L) | -7.44 | 2.48 | -3.00 | 2.67e-3 | ** |
| Plt (× 109/L) | 1.18e-2 | 6. 50e-3 | 1.82 | 6.87e-2 | |
| GPDA (U/L) | 8.73e-2 | 5.10e-2 | 1.71 | 8.72e-2 | |
| Alb: Plt | -6.98e-4 | 2.00e-4 | -3.49 | 4.80e-4 | *** |
| Alb: GPDA | -4.33e-3 | 1.15e-3 | -3.78 | 1.60e-4 | *** |
| TC: TCa | 1.84 | 7.30e-1 | 2.52 | 1.17e-2 | * |
| Plt: GPDA | 2.58e-4 | 8.81e-5 | 2.92 | 3.47e-2 | ** |
| (Intercept) | 1.90 | 5.13 | 0.37 | 0.71 | |
Significance codes: 0 < ’***’ < 0.001 < ’**’ < 0.01 < ’*’ < 0.05.
Judged from the fitted CUI densities, UC patients have a greater CUI than CD patients (Figure 1), with CUI > 0 incrementally favoring a diagnosis of UC, while CUI < 0 corresponded to a higher likelihood of a diagnosis of CD.
Figure 1.
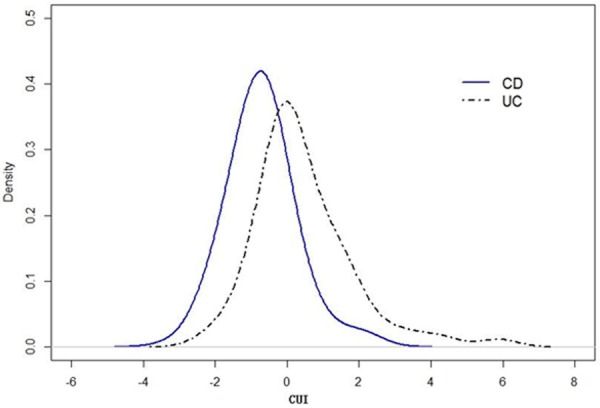
Estimated density functions of CUI for CD and UC patients.
Interaction effects among biological predictors
To further examine potential interactions, we conducted a stratified association analysis between disease type and GPDA, Plt, and TCa by adjusting for Alb, GPDA, and TC, respectively (Table 3). The results indicate that GPDA, Plt, and TCa are significantly associated with the disease status, while the marginal effects of these three predictors are not associated with the disease status (Table 1). This suggests that the interactions might play an important role.
Table 3.
Association between disease type and GPDA, Plt, and TCa by adjusting for Alb, GPDA, and TC, respectively
| Mean in CD patients | Mean in UC patients | Difference | 2.5% limit | 97.5% limit | t | P | |
|---|---|---|---|---|---|---|---|
| Association between GPDA and disease stratified by Alb | |||||||
| ≤ 1st quar. | 32.25 | 45.88 | 13.63 | -21.72 | -5.55 | -3.4 | 1.44e-3 |
| > 1st quar. ≤ 2nd quar. | 40.98 | 45.74 | 4.76 | -12.59 | 3.08 | -1.22 | 0.23 |
| > 2nd quar. ≤ 3rd quar. | 49.90 | 46.85 | -3.05 | -6.08 | 12.18 | 0.67 | 0.51 |
| > 3rd quar. | 64.67 | 42.32 | -22.35 | 11.03 | 33.66 | 3.95 | 2.07e-4 |
| Association between Plt and disease stratified by GPDA | |||||||
| ≤ 1st quar. | 328.56 | 264.03 | -64.53 | 20.45 | 108.6 | 2.92 | 4.68e-3 |
| > 1st quar. ≤ 2nd quar. | 336.43 | 280.54 | -55.89 | -0.33 | 112.1 | 1.98 | 5.13e-2 |
| > 2nd quar. ≤ 3rd quar. | 273.33 | 300.94 | 27.61 | -98.57 | 43.36 | -0.78 | 0.44 |
| > 3rd quar. | 270.15 | 283.12 | 12.97 | -62.16 | 36.22 | -0.53 | 0.60 |
| Association between Tca and disease stratified by TC | |||||||
| ≤ 1st quar. | 2.05 | 1.92 | -0.13 | 0.03 | 0.24 | 2.57 | 1.41e-2 |
| > 1st quar. ≤ 2nd quar. | 2.13 | 2.14 | 0.01 | -0.08 | 0.06 | -0.27 | 0.79 |
| > 2nd quar. ≤ 3rd quar. | 2.13 | 2.15 | 0.02 | -0.08 | 0.05 | -0.47 | 0.64 |
| > 3rd quar. | 2.21 | 2.23 | 0.02 | -0.10 | 0.06 | -0.52 | 0.61 |
Validity of the diagnostic model
To evaluate the effect of including the additional predictor, we compared the ROCs and AUCs of the two diagnosis models as follows. All patients were randomly split into two equally distributed groups, and the ROC and AUC were estimated using the previously described method. Based on 100 repetitions of bootstrapping, an average value of ROCs for the null model and the alternative model are depicted in Figure 2. An average value of the AUCs for the null model and the alternative model are 0.66 (95% confidence interval: 0.59-0.72) and 0.73 (95% confidence interval: 0.67-0.80), respectively, with a difference of 0.07 (95% confidence interval: 0.01-0.14) being significantly greater than 0 (P-value: 6.3e-3). In practice, we may diagnose an IBD patient with CUI > 0 as UC. This cut-point 0 yields a sensitivity of 0.55 and a specificity of 0.80 for an alternative model, a sensitivity of 0.46 and a specificity of 0.79 for the null model. An optimal cut-point can be chosen to balance the specificity and sensitivity by minimizing the total ‘cost’ of a decision. The associated costs are for true positive, false positive, true negative, and false negative [13].
Figure 2.
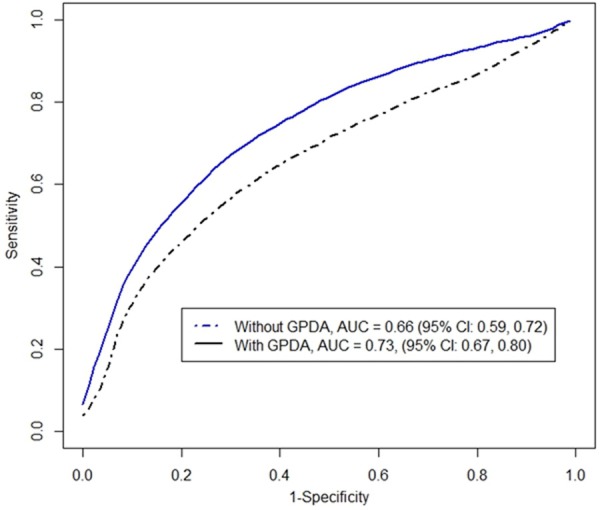
Average ROC curves for null model (without GPDA) and alternative model (with GPDA) based on 100 sample splitting.
Finally, we checked the validity of the alternative model. The estimated dispersion parameter is 1.05 (P-value: 0.24) which is quite close to 1, showing that the true model does not significantly deviate from the logistic regression model. The component and residual plots (Figure 3) also confirm linearity between the log odds ratio of disease and all working predictors.
Figure 3.
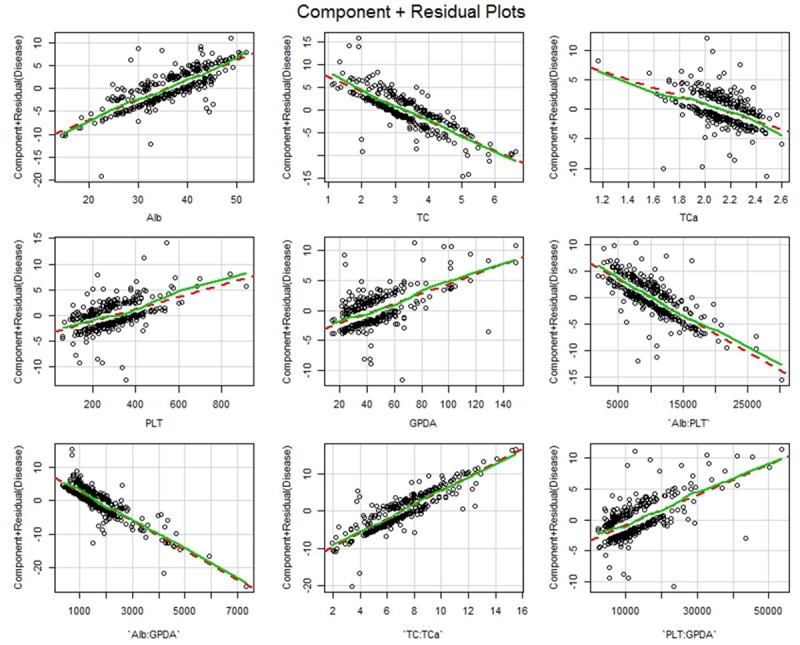
Component + Residual plots for working predictors and interactions in the alternative model.
Discussion
An assessment of patients with IBD is often complex and is based on clinical, endoscopic and histological findings. There are currently no internationally recognized criteria for the accurate and objective diagnosis of CD or UC [14]. The diagnosis of IBD is often missed or delayed because of the non-specific nature of both the intestinal and extra-intestinal symptoms and sometimes differential diagnosis between UC and CD can be difficult [3,14]. Therefore, the use of a diagnostic strategy using noninvasive biomarkers to aid in such a diagnosis is desirable. Biomarkers have the potential to avoid unnecessary invasive diagnostic evaluations that may result in discomfort and potential complications [15]. Some researchers have focused on the identification of serum biomarkers which have diagnostic value in discriminating IBD from non-IBD, and which can be used to distinguish UC from CD patients [16]. This has become a matter of increasing interest in recent years [16-18]. Such biomarkers would be of clinical value if they had high sensitivity and high specificity. However, no single biomarker has been proven to have these characteristics at present. Moreover, most biomarkers currently used are not disease-specific, but reflect generalized inflammation [19]. Since cost effectiveness and reliability are important requirements for effective diagnostic tests in clinical practice, we chose to use serum markers that are presently tested in this patient population as a part of their regular work-up. In clinical work, the physicians tend to like to analyze or determine an illness through the way of the combination of various indicators, but the diagnosis of the combination is just made by the experience of the physicians, so there is not too much on its superiority. Certainly, perhaps statistical methods can help us to overcome this instability of diagnosis, quantitative diagnosis could help operate and promote the practice, if the sensitivity and specificity of the diagnostic method are better, it would have great significance to patients and doctors. BIC is one of the most appropriate model-selection criteria which could weigh the complexity of the estimated model and fit the data to get the best excellence [11]. Therefore, in this study, we made an attempt to establish a statistical diagnostic model using the available biomarkers, and subsequently investigated its usefulness in the diagnosis of these diseases.
In this study, a male/female ratio of 1.22/1.00 was found in the UC patients, while a male/female ratio of 1.95/1.00 was found in the CD patients, the ratios were similar with the previous reports in China [20,21]. In the present studies, we generated a formula derived from a composite set of independent biomarkers reflecting nutritional status, metabolic disorders and inflammation in IBD. This analysis was comprised of five inexpensive laboratory tests (Alb, TC, Tca, Plt and GPDA) and four interactions (Alb: Plt, Alb: GPDA, TCa: TC, and Plt: GPDA). Those predictors and interactions associated with disease status were selected (and used in the CUI) using BIC. Before determining CUI, we compared the validity of the diagnostic model between the null model (without GPDA), and the alternative model (with GPDA), since, to our knowledge, a study examining the relationship between GPDA and IBD had not yet been reported. GPDA, widely distributed in human and animal tissues, was first described by Hapsu-Hava and Glenner in 1966 [22]. Serum GPDA activity is increased in patients with hepatobiliary diseases and hepatic cancer, but is decreased in gastric carcinoma [23-25]. After adding GPDA to our model, we found that the AUC for the alternative model was significantly greater compared to the null model. Therefore, the alternative model was more effective at distinguishing UC from CD. Furthermore, the relationship between serum GPDA and IBD and the possible mechanisms of their interaction deserves further research.
In addition to GPDA, our data showed that other serum biomarkers, reflecting changes in nutritional status, the presence of metabolic disorders and inflammation, were related to IBD [4-10]. Our data showed that serum CRP concentration is lower in patients with UC compared to Crohn’s disease [26]. In addition, we found that CRP was significantly higher in CD than in UC (Table 1). Nevertheless, we did not choose CRP as biomarker in our diagnostic model using BIC. Compared to CRP, ESR concentrations peak later and take longer to decrease, despite improvement of the patient’s clinical condition and decreased inflammation [27]. In our study, we did not find a significant difference in ESR values between UC and CD. Lipid abnormalities are frequent in IBD patients, especially HDLc and TC which are lower compared to healthy controls [28]. Our study shows that Crohn’s patients have significantly lower HDLc and TC than UC patients. Osteoporosis and major micronutrient deficiencies are highly prevalent in the IBD population and calcium levels are significantly lower in IBD [5,29]. Fg and Plt were found to be predictors of inflammation in IBD [30,31]. By conducting an evaluation of the aforementioned serum parameters, we employed CUI to distinguish UC from CD using biomarkers and their interactions selected by BIC.
What should we consider when utilizing CUI in clinical practice? The gold standard for determining UC from CD remains histological criteria, it is very difficult to diagnose IBD with histological results. However, CUI may be used as an auxiliary tool in the diagnosis of UC and CD, especially when encountering unclear clinical history, unusual endoscopic and radiological features, and ambiguous biopsies. As the number of the patients in this study was limited, we hope that the model could be further studied in different geographic or ethnic population, so that it will reflect the true clinical value of the model. However, we only used the serum biomarkers in this study, we hope that the demographic variables, for example age, would not influence the diagnostic value of the model in the future. Additionally, proteomics technologies are employed in order to monitor for differences in protein expression of IBD now, if some new protein biomarkers are used in clinical setting, they could be added in the CUI to strengthen the diagnostic value. In the future, it will be of interest to determine whether our observations are reliable in the clinical setting, and whether the CUI can be further refined.
Acknowledgements
The authors are grateful to Yi Liu and Jun Wang from the Department of Gastroenterology, The First Affiliated Hospital, College of Medicine, Zhejiang University, for helping collect material for this study. Supported by Zhejiang provincial natural science foundation of China (No. LY12H03011); Chinese medicine science and technology program of Zhejiang Province (No. 2012ZA081); Natural Science Foundation of Ningbo City (No. 2012A610244).
Disclosure of conflict of interest
None.
References
- 1.Vermeire S, Van Assche G, Rutgeerts P. C-reactive protein as a marker for inflammatory bowel disease. Inflamm Bowel Dis. 2004;10:661–5. doi: 10.1097/00054725-200409000-00026. [DOI] [PubMed] [Google Scholar]
- 2.Palmon R, Brown SJ, Abreu MT. What is the role and significance of serum and stool biomarkers in the diagnosis of IBD? Inflamm Bowel Dis. 2008;14(Suppl 2):S187–9. doi: 10.1002/ibd.20714. [DOI] [PubMed] [Google Scholar]
- 3.Mendoza JL, Abreu MT. Biological markers in inflammatory bowel disease: Practical consideration for clinicians. Gastroenterol Clin Biol. 2009;33(Suppl 3):S158–73. doi: 10.1016/S0399-8320(09)73151-3. [DOI] [PubMed] [Google Scholar]
- 4.Sappati Biyyani RS, Putka BS, Mullen KD. Dyslipidemia and lipoprotein profiles in patients with inflammatory bowel disease. J Clin Lipidol. 2010;4:478–82. doi: 10.1016/j.jacl.2010.08.021. [DOI] [PubMed] [Google Scholar]
- 5.Etzel JP, Larson MF, Anawalt BD, Collins J, Dominitz JA. Assessment and management of low bone density in inflammatory bowel disease and performance of professional society guidelines. Inflamm Bowel Dis. 2011;17:2122–9. doi: 10.1002/ibd.21601. [DOI] [PubMed] [Google Scholar]
- 6.Shen J, Ran ZH, Zhang Y, Cai Q, Yin HM, Zhou XT, Xiao SD. Biomarkers of altered coagulation and fibrinolysis as measures of disease activity in active inflammatory bowel disease: a gender-stratified, cohort analysis. Thromb Res. 2009;123:604–11. doi: 10.1016/j.thromres.2008.04.004. [DOI] [PubMed] [Google Scholar]
- 7.Poullis AP, Zar S, Sundaram KK, Moodie SJ, Risley P, Theodossi A, Mendall MA. A new, highly sensitive assay for C-reactive protein can aid the differentiation of inflammatory bowel disorders from constipation- and diarrhoea-predominant functional bowel disorders. Eur J Gastroenterol Hepatol. 2002;14:409–12. doi: 10.1097/00042737-200204000-00013. [DOI] [PubMed] [Google Scholar]
- 8.Bitton A, Peppercorn MA, Antonioli DA, Niles JL, Shah S, Bousvaros A, Ransil B, Wild G, Cohen A, Edwardes MD, Stevens AC. Clinical, biological, and histologic parameters as predictors of relapse in ulcerative colitis. Gastroenterology. 2001;120:13–20. doi: 10.1053/gast.2001.20912. [DOI] [PubMed] [Google Scholar]
- 9.Danese S, Motte Cd Cde L, Fiocchi C. Platelets in infl ammatory bowel disease: clinical, pathogenic, and therapeutic implications. Am J Gastroenterol. 2004;99:938–45. doi: 10.1111/j.1572-0241.2004.04129.x. [DOI] [PubMed] [Google Scholar]
- 10.Klinger MH. Platelets and inflammation. Anat Embryol (Berl) 1997;196:1–11. doi: 10.1007/s004290050075. [DOI] [PubMed] [Google Scholar]
- 11.Schwarz G. Estimating the dimension of a model. Ann Statist. 1978;6:461–4. [Google Scholar]
- 12.Fox J. Applied regression analysis and generalized linear models. 2nd edition. Thousand Oaks, CA: Sage; 2008. [Google Scholar]
- 13.Zhou X, Obuchowski NA, McClish DK. Statistical methods in diagnostic medicine. New York: John Wiley & Sons, Inc; 2002. [Google Scholar]
- 14.Mowat C, Cole A, Windsor A, Ahmad T, Arnott I, Driscoll R, Mitton S, Orchard T, Rutter M, Younge L, Lees C, Ho GT, Satsangi J, Bloom S IBD Section of the British Society of Gastroenterology. Guidelines for the management of inflammatory bowel disease in adults. Gut. 2011;60:571–607. doi: 10.1136/gut.2010.224154. [DOI] [PubMed] [Google Scholar]
- 15.Dubinsky MC, Ofman JJ, Urman M, Targan SR, Seidman EG. Clinical utility of serodiagnostic testing in suspected pediatric inflammatory bowel disease. Am J Gastroenterol. 2001;96:758–65. doi: 10.1111/j.1572-0241.2001.03618.x. [DOI] [PubMed] [Google Scholar]
- 16.Lewis JD. The utility of biomarkers in the diagnosis and therapy of inflammatory bowel disease. Gastroenterology. 2011;140:1817–26. e2. doi: 10.1053/j.gastro.2010.11.058. [DOI] [PMC free article] [PubMed] [Google Scholar]
- 17.Conrad K, Schmechta H, Klafki A, Lobeck G, Uhlig HH, Gerdi S, Henker J. Serological differentiation of inflammatory bowel diseases. Eur J Gastroenterol Hepatol. 2002;14:129–35. doi: 10.1097/00042737-200202000-00006. [DOI] [PubMed] [Google Scholar]
- 18.Konrad A, Lehrke M, Schachinger V, Seibold F, Stark R, Ochsenkühn T, Parhofer KG, Göke B, Broedl UC. Resistin is an inflammatory marker of inflammatory bowel disease in humans. Eur J Gastroenterol Hepatol. 2007;19:1070–4. doi: 10.1097/MEG.0b013e3282f16251. [DOI] [PubMed] [Google Scholar]
- 19.Iskandar HN, Ciorba MA. Biomarkers in inflammatory bowel disease: current practices and recent advances. Transl Res. 2012;159:313–25. doi: 10.1016/j.trsl.2012.01.001. [DOI] [PMC free article] [PubMed] [Google Scholar]
- 20.Wang Y, Ouyang Q. APDW 2004 Chinese IBD working group. Ulcerative colitis in China: retrospective analysis of 3100 hospitalized patients. J Gastroenterol Hepatol. 2007;22:1450–5. doi: 10.1111/j.1440-1746.2007.04873.x. [DOI] [PubMed] [Google Scholar]
- 21.APDW2004 Chinese IBD Working Group. Retrospective analysis of 515 cases of Crohn’s disease hospitalization in China: nationwide study from 1990 to 2003. J Gastroenterol Hepatol. 2006;21:1009–15. doi: 10.1111/j.1440-1746.2006.04140.x. [DOI] [PubMed] [Google Scholar]
- 22.Hopsu-Havu VK, Glenner GG. A new dipeptide naphthylamidase hydrolyzing glycyl-prolyl-beta-naphthlamide. Histochemie. 1966;7:197–201. doi: 10.1007/BF00577838. [DOI] [PubMed] [Google Scholar]
- 23.Hutchinson DR, Halliwell RP, Lockhart JD, Parke DV. Glycylprolyl-p-nitroanilidase in hepatobiliary disease. Clin Chim Acta. 1981;109:83–9. doi: 10.1016/0009-8981(81)90140-6. [DOI] [PubMed] [Google Scholar]
- 24.Kojima J, Kanatani M, Nakamura N, Kashiwagi T, Tohjoh F, Akiyama M. Serumand liver glycylproline dipeptidyl aminopeptidase activity in ratswith experimental hepatic cancer. Clin Chim Acta. 1980;107:105–10. doi: 10.1016/0009-8981(80)90419-2. [DOI] [PubMed] [Google Scholar]
- 25.Yoshii Y, Kasugai T, Kato T, Nagatsu T, Sakakibara S. Changes in serum dipeptidyl-aminopeptidase IV (glycylprolyl dipeptidyl-aminopeptidase) activity of patients with gastric carcinoma after surgical excision and the enzyme activity in the carcinoma tissue. Biochem Med. 1981;25:276–82. doi: 10.1016/0006-2944(81)90085-5. [DOI] [PubMed] [Google Scholar]
- 26.Fagan EA, Dyck RF, Maton PN, Hodgson HJ, Chadwick VS, Petrie A, Pepys MB. Serum levels of C-reactive protein in Crohn’s disease and ulcerative colitis. Eur J Clin Invest. 1982;12:351–9. doi: 10.1111/j.1365-2362.1982.tb02244.x. [DOI] [PubMed] [Google Scholar]
- 27.Vermeire S, Van Assche G, Rutgeerts P. Laboratory markers in IBD: useful, magic, or unnecessary toys? Gut. 2006;55:426–31. doi: 10.1136/gut.2005.069476. [DOI] [PMC free article] [PubMed] [Google Scholar]
- 28.Sappati Biyyani RS, Putka BS, Mullen KD. Dyslipidemia and lipoprotein profiles in patients with inflammatory bowel disease. J Clin Lipidol. 2010;4:478–82. doi: 10.1016/j.jacl.2010.08.021. [DOI] [PubMed] [Google Scholar]
- 29.Vagianos K, Bector S, McConnell J, Bernstein CN. Nutrition assessment of patients with inflammatory bowel disease. JPEN J Parenter Enteral Nutr. 2007;31:311–9. doi: 10.1177/0148607107031004311. [DOI] [PubMed] [Google Scholar]
- 30.Alkim H, Ayaz S, Alkim C, Ulker A, Sahin B. Continuous active state of coagulation system in patients with nonthrombotic inflammatory bowel disease. Clin Appl Thromb Hemost. 2011;17:600–4. doi: 10.1177/1076029611405034. [DOI] [PubMed] [Google Scholar]
- 31.Sawada K, Takahashi R, Saniabadi AR, Ohdo M, Shimoyama T. Elevated plasma cryofibrinogen in patients with active inflammatory bowel disease is morbigenous. World J Gastroenterol. 2006;12:1621–5. doi: 10.3748/wjg.v12.i10.1621. [DOI] [PMC free article] [PubMed] [Google Scholar]