

Abstract
Natriuretic peptides (NPs) are critical regulators of the cardiovascular system that are currently viewed as possible therapeutic targets for the treatment of heart disease. Recent work demonstrates potent NP effects on cardiac electrophysiology, including in the sinoatrial node (SAN) and atria. NPs elicit their effects via three NP receptors (NPR-A, NPR-B and NPR-C). Among these receptors, NPR-C is poorly understood. Accordingly, the goal of this study was to determine the effects of NPR-C ablation on cardiac structure and arrhythmogenesis. Cardiac structure and function were assessed in wild-type (NPR-C+/+) and NPR-C knockout (NPR-C−/−) mice using echocardiography, intracardiac programmed stimulation, patch clamping, high-resolution optical mapping, quantitative polymerase chain reaction and histology. These studies demonstrate that NPR-C−/− mice display SAN dysfunction, as indicated by a prolongation (30%) of corrected SAN recovery time, as well as an increased susceptibility to atrial fibrillation (6% in NPR-C+/+ vs. 47% in NPR-C−/−). There were no differences in SAN or atrial action potential morphology in NPR-C−/− mice; however, increased atrial arrhythmogenesis in NPR-C−/− mice was associated with reductions in SAN (20%) and atrial (15%) conduction velocity, as well as increases in expression and deposition of collagen in the atrial myocardium. No differences were seen in ventricular arrhythmogenesis or fibrosis in NPR-C−/− mice. This study demonstrates that loss of NPR-C results in SAN dysfunction and increased susceptibility to atrial arrhythmias in association with structural remodelling and fibrosis in the atrial myocardium. These findings indicate a critical protective role for NPR-C in the heart.
Key points
Natriuretic peptides (NPs) elicit their effects via multiple NP receptors (including NPR-A, NPR-B and NPR-C, with NPR-C being relatively poorly understood).
We have studied the effects of NPR-C ablation on cardiac structure, function and arrhythmogenesis using NPR-C knockout (NPR-C−/−) mice.
NPR-C−/− mice are characterized by sinoatrial node (SAN) dysfunction and a profound increase in susceptibility to atrial fibrillation.
Increased susceptibility to arrhythmias in NPR-C−/− mice was associated with slowed electrical conduction in the SAN as well as the right and left atria due to enhanced collagen expression and deposition in the atria (structural remodelling), but without changes in action potential morphology (electrical remodelling) in isolated SAN or atrial myocytes.
This study demonstrates a critical protective role for NPR-C in the heart.
Introduction
Natriuretic peptides (NPs), including atrial (ANP), B-type (BNP) and C-type (CNP) NPs, are a group of powerful cardioprotective hormones that play a critical role in the maintenance of cardiovascular homeostasis in normal conditions and in cardiovascular disease (Levin et al. 1998; Potter et al. 2006). In fact, due to their potent effects in the cardiovascular system, NPs are currently in use (nesiritide) (Cataliotti & Burnett, 2005; Lee & Burnett, 2007) or in development (CD-NP) (Lee et al. 2009; Rose, 2010) for the treatment of heart failure. Despite this, current understanding of the distinct roles of specific NP receptors (NPRs) in the heart is incomplete, which may partially explain the lack of clinical efficacy of some NPs currently in use (Burnett & Korinek, 2008; O'Connor et al. 2011).
There are three known NPRs denoted NPR-A, NPR-B and NPR-C (Lucas et al. 2000; Potter et al. 2006; Rose & Giles, 2008). Most attention has been given to NPR-A and NPR-B, which are well known particulate guanylyl cyclase (GC) receptors that mediate increases in cGMP upon receptor activation (Potter et al. 2006). Most physiological effects of NPs have been attributed to these receptors. Conversely, much less is known about NPR-C, which is not directly coupled to GC signalling. NPR-C was originally classified as a ‘clearance receptor’ with no signalling function (Maack et al. 1987); however, it is now known that NPR-C is able to activate inhibitory G proteins (Gi) and modulate adenylyl cyclase (AC) and phospholipase C signalling (Anand-Srivastava & Trachte, 1993; Anand-Srivastava, 2005). This coupling to Gi occurs via specific Gi-activator domains located within the 37 amino acid intracellular portion of NPR-C (Pagano & Anand-Srivastava, 2001; Zhou & Murthy, 2003). NPR-C is able to bind all NPs with comparable affinity (Anand-Srivastava & Trachte, 1993); thus, a more complete understanding of the role(s) of this receptor in the heart is of critical importance and may impact the future therapeutic use of NPs in heart disease.
We have shown that NPs have robust effects on cardiac electrophysiology and provided the first clear evidence that NPR-C can mediate some of these effects (Rose et al. 2003, 2004; Rose & Giles, 2008; Azer et al. 2012, 2014; Springer et al. 2012). Specifically, we have found that in the presence of acute β-adrenergic receptor activation, BNP and CNP can potently reduce heart rate (HR) by decreasing spontaneous action potential (AP) firing in the sinoatrial node (SAN) (Rose et al. 2004; Azer et al. 2012). This occurs in conjunction with a reduction in diastolic depolarization slope (DD slope) and L-type Ca2+ current in SAN myocytes. We have also demonstrated, using high-resolution optical mapping, that NPs can slow conduction in the SAN and atrial myocardium by activating NPR-C (Azer et al. 2014). These inhibitory effects of NPs on HR, SAN AP firing and SAN/atrial conduction are completely absent in NPR-C knockout mice (NPR-C−/−) (Azer et al. 2012, 2014). These observations conclusively demonstrate that NPR-C is an important mediator of electrophysiological effects of NPs in the heart, including in the SAN and atria.
Although our previous work demonstrates the involvement of NPR-C in mediating acute electrophysiological effects of NPs in the heart, the consequences of NPR-C ablation on cardiac structure and arrhythmogenesis have not been investigated. This constitutes a clear gap in our understanding of this receptor and of the physiology of NPs in the heart. Accordingly, the goal of the present study was to determine the consequences of the loss of NPR-C in the heart using NPR-C−/− mice. Our novel data demonstrate that NPR-C−/− mice are characterized by SAN dysfunction and increased susceptibility to atrial fibrillation (AF) in association with impaired electrical conduction and enhanced atrial fibrosis (structural remodelling). These findings indicate that NPR-C plays a critical protective role in the heart by preventing adverse structural remodelling due to fibrosis.
Methods
Animals
This study utilized male littermate wild-type (NPR-C+/+) and NPR-C−/− mice between the ages of 10 and 15 weeks. NPR-C−/− mice were initially obtained from the Jackson Laboratory (strain B6;C-Npr3lgj/J) and backcrossed into the C57Bl/6 line for more than 15 generations. This mouse contains a 36 base pair deletion that results in a truncated, non-functional NPR-C protein (Jaubert et al. 1999). All experimental procedures were approved by the Dalhousie University Committee for Laboratory Animals and conformed to the guidelines of the Canadian Council on Animal Care.
Assessment of cardiac structure, blood pressure and plasma atrial natriuretic peptide
Cardiac structure was assessed using transthoracic echocardiography on anaesthetized mice (1% isoflurane inhalation) using a high-resolution transducer and a Vivid 7 ultrasound machine (GE Healthcare). Structure and function were assessed by measuring two-dimensional M-mode images from the parasternal short axis at the level of the midpapillary muscle and the parasternal long axis. Blood pressure was measured in conscious restrained mice using a tail-cuff apparatus (IITC Life Sci, Woodland Hills, CA, USA). Plasma ANP levels were measured from blood samples obtained by cardiac puncture using a commercially available enzyme-linked immunosorbent assay kit (Ray Biotech Inc., Norcross, GA, USA) according to the manufacturer's directions.
In vivo electrophysiology and programmed stimulation
Mice were anaesthetized by isoflurane inhalation and subdermal needle electrodes (30 gauge) were placed around the heart in a lead II conformation. Surface ECG recordings were used to measure standard ECG parameters, including R-R interval, P wave duration, P-R interval, QRS duration and Q-T interval. The Q-T interval was corrected for HR using Bazett's formula [Q-Tc = Q-T/(R-R/100)1/2]. Body temperature was maintained at 37°C.
A 1.1 French octapolar electrophysiology catheter containing eight electrodes spaced 0.5 mm apart was used for intracardiac pacing experiments as we have described previously (Rose et al. 2011). Correct catheter placement was ensured by obtaining a sole ventricular signal in the distal lead and a predominant atrial signal in the proximal lead. All stimulation pulses were given at 0.4 mA for 2 ms, which enabled continuous capture and drive of cardiac conduction. SAN recovery time (SNRT) was measured by delivering a 12 stimulus drive train at a cycle length of 100 ms. SNRT is defined as the time between the last stimulus in the drive train and the occurrence of the first spontaneous sinus beat (P wave). SNRT was corrected for HR (cSNRT) by subtracting the prestimulus R-R interval from the measured SNRT. To determine atrial (AERP), atrioventricular node (AVERP) and ventricular (VERP) effective refractory periods an eight-stimulus drive train (S1) at a cycle length of 100 ms was followed by an extra stimulus (S2) at progressively shorter cycle lengths. Effective refractory periods were defined as the shortest S1–S2 interval allowing for capture in the region of interest.
Inducibility of AF and ventricular tachycardia (VT) were studied using burst pacing in the right atrium or right ventricle respectively (Fukui et al. 2013). We used three trains of 2 s burst pacing as follows: first 2 s burst was given at a cycle length of 40 ms with a pulse duration of 5 ms. After 3 min of stabilization a second 2 s burst was applied at a cycle length 20 ms with a pulse duration of 5 ms. After another 3 min of stabilization the final 2 s burst was given at a cycle length of 20 ms with a pulse duration of 10 ms. AF was defined as a rapid and irregular atrial rhythm (fibrillatory baseline in the ECG) with irregular R-R intervals lasting at least 1 s on the surface ECG. VT was defined as the occurrence of over 20 tachycardic ventricular beats on the surface ECG. All ECG data were acquired using a Gould ACQ-7700 amplifier and Ponemah Physiology Platform software (Data Sciences International, St. Paul, MN, USA) as we have described previously (Rose et al. 2011).
Patch clamping of sinoatrial node and atrial myocytes
The procedures for isolating single pacemaker myocytes from the SAN and atrial myocytes from the right atrium have been described previously (Hua et al. 2012; Springer et al. 2012) and were as follows. Mice were administered a 0.2 ml intraperitoneal injection of heparin (1000 IU ml–1) to prevent blood clotting. Following this, mice were anaesthetized by isoflurane inhalation and then killed by cervical dislocation. The heart was excised into Tyrode's solution (35°C) consisting of (in mm): 140 NaCl, 5.4 KCl, 1.2 KH2PO4, 1.0 MgCl2, 1.8 CaCl2, 5.55 glucose and 5 Hepes, with pH adjusted to 7.4 with NaOH. The SAN region of the heart was isolated by separating the atria from the ventricles, cutting open the superior and inferior venae cavae, and pinning the tissue so that the crista terminalis could be identified. The SAN area is located in the intercaval region adjacent to the crista terminalis. This SAN region was cut into strips, which were transferred and rinsed in a ‘low Ca2+/Mg2+-free’ solution containing (in mm): 140 NaCl, 5.4 KCl, 1.2 KH2PO4, 0.2 CaCl2, 50 taurine, 18.5 glucose, 5 Hepes and 1 mg ml–1 bovine serum albumin, with pH adjusted to 6.9 with NaOH. SAN tissue strips were digested in 5 ml of ‘low Ca2+/Mg2+-free’ solution containing collagenase (type II; Worthington Biochemical Corporation), elastase (Worthington Biochemical Corporation, Lakewood, NJ, USA) and protease (type XIV; Sigma Chemical Company, St. Louis, MO, USA) for 30 min. Then the tissue was transferred to 5 ml of modified KB solution containing (in mm): 100 potassium glutamate, 10 potassium aspartate, 25 KCl, 10 KH2PO4, 2 MgSO4, 20 taurine, 5 creatine, 0.5 EGTA, 20 glucose, 5 Hepes and 0.1% bovine serum albumin, with pH adjusted to 7.2 with KOH. The tissue was mechanically agitated using a wide bore pipette. This procedure yielded individual SAN myocytes with cellular automaticity that was recovered after readapting the cells to a physiological concentration of Ca2+. SAN myocytes were identified by their small spindle shape and ability to beat spontaneously in the recording chamber when superfused with normal Tyrode's solution. When patch clamped, SAN myocytes always displayed spontaneous APs. The same procedure was used to isolate right atrial myocytes from strips of tissue from the right atrial appendage. Atrial myocytes always had a stable resting membrane potential.
Spontaneous APs were recorded using the perforated patch clamp technique (Rae et al. 1991) on single SAN myocytes, while APs were stimulated in right atrial myocytes (Azer et al. 2012; Hua et al. 2012; Springer et al. 2012). APs were recorded at room temperature (22–23°C), which must be noted when comparing these data to in vivo HR measurements. For recording APs the recording chamber was superfused with a normal Tyrode's solution containing (in mm): 140 NaCl, 5 KCl, 1 MgCl2, 1 CaCl2, 10 Hepes and 5 glucose, with pH adjusted to 7.4 with NaOH. The pipette filling solution contained (in mm): 135 KCl, 0.1 CaCl2, 1 MgCl2, 5 NaCl, 10 EGTA, 4 Mg-ATP, 6.6 sodium phosphocreatine, 0.3 Na-GTP and 10 Hepes, with pH adjusted to 7.2 with KOH. Amphotericin B (200 μg ml–1) was added to this pipette solution to record APs with the perforated patch clamp technique.
Micropipettes were pulled from borosilicate glass (with filament, 1.5 mm OD, 0.75 mm ID; Sutter Instrument Company, Novato, CA, USA) using a Flaming/Brown pipette puller (model p-87; Sutter Instrument Company). The resistance of these pipettes was 4–8 MΩ when filled with recording solution. Micropipettes were positioned with a micromanipulator (Burleigh PCS-5000 system, Thorlabs, Newton, NJ, USA) mounted on the stage of an inverted microscope (Olympus IX71, Richmond Hill, ON, Canada). Seal resistance was 2–15 GΩ. For perforated patch clamp experiments access resistance was monitored for the development of capacitative transients upon sealing to the cell membrane with Amphotericin B in the pipette using an Axopatch 200 B amplifier (Molecular Devices, Sunnyvale, CA, USA). Typically, access resistance became less than 30 MΩ within 5 min of sealing on to the cell, which was sufficient for recording spontaneous APs in current clamp mode. Data were digitized using a Digidata 1440 and pCLAMP 10 software (Molecular Devices) and stored on a computer for subsequent analysis.
Spontaneous AP parameters in SAN myocytes, including the maximum diastolic potential, DD slope, the maximum AP upstroke velocity, the AP overshoot and AP duration at 50% repolarization (APD50) were analysed as described previously (Mangoni & Nargeot, 2001; Azer et al. 2012; Springer et al. 2012).
High-resolution optical mapping
To study patterns of electrical conduction in the SAN and atria we used high-resolution optical mapping in atrial preparations as we have done previously (Azer et al. 2014). To isolate our atrial preparation, mice were administered a 0.2 ml intraperitoneal injection of heparin (1000 IU ml–1) to prevent blood clotting and were then anaesthetized by isoflurane inhalation and cervically dislocated. Hearts were excised into Krebs solution (35°C) containing (in mm): 118 NaCl, 4.7 KCl, 1.2 KH2PO4, 12.2 MgSO4, 1 CaCl2, 25 NaHCO3, 11 glucose and bubbled with 95% O2/5% CO2 to maintain a pH of 7.4. The atria were dissected away from the ventricles and pinned in a dish. The superior and inferior vena cavae were cut open so that the crista terminalis could be visualized. The SAN area is located in the intercaval region in the right atrial posterior wall adjacent to the crista terminalis (Mangoni & Nargeot, 2001; Verheijck et al. 2001; Liu et al. 2007; Azer et al. 2012, 2014; Springer et al. 2012).
The atrial preparation was superfused continuously with Krebs solution (35°C) bubbled with 95% O2/5% CO2 and allowed to equilibrate for at least 30 min. During this time the preparation was treated with the voltage-sensitive dye di-4-ANEPPS (10 μm) for ∼15 min and blebbistatin (10 μm) was added to the superfusate to suppress contractile activity (Farman et al. 2008; Fedorov et al. 2010). Blebbistatin was present throughout the duration of the experiments to prevent motion artefacts during optical mapping. We have previously demonstrated that blebbistatin does not affect cycle length or activation pattern in similar optical mapping experiments (Azer et al. 2014). Some experiments were performed using atrial preparations in sinus rhythm so that the cycle length (i.e. beating rate) was free to change. In other studies we used a pacing electrode to pace atrial preparations at a fixed cycle length of 120 ms to study electrical conduction independently of changes in cycle length. The pacing electrode was placed near the opening of the superior vena cava.
Di-4-ANEPPS loaded atrial preparations were illuminated with light at a wavelength of 520–570 nm using an EXFO X-cite fluorescent light source (Lumen Dynamics, Mississauga, ON, Canada). Emitted light (590–640 nm) was captured using a high-speed EMCCD camera (Evolve 128; Photometrics, Tucson, AZ, USA).
Two experimental approaches were used in mapping studies. In some experiments we mapped conduction in the entire atrial preparation. In these studies the spatial resolution of each pixel was 77 × 77 μm and data were acquired at frame rates of ∼1000 frames s–1. In other studies we mapped conduction specifically in the right atrial posterior wall around the point of initial electrical excitation, which corresponds to activation of the SAN (Glukhov et al. 2010; Fedorov et al. 2012; Azer et al. 2014). In these experiments, spatial resolution was 45 × 45 μm per pixel and data were acquired at frame rates of ∼700 frames s–1. Magnification was constant during experiments at each of these spatial resolutions and no pixel binning was used. All optical data were acquired using Metamorph software (Molecular Devices).
Data were analysed using custom software written in Matlab. Pseudocolor electrical activation maps were generated from measurements of activation time at individual pixels as defined by assessment of dF/dtmax. In all cases background fluorescence was subtracted. Local conduction velocity (CV) was quantified specifically in the SAN (at the site of initial breakthrough), right atrial myocardium (within the right atrial appendage) and left atrial myocardium (within the left atrial appendage) using an established approach previously described (Morley et al. 1999; Nygren et al. 2004; Azer et al. 2014). Briefly, activation times at each pixel from a 7 × 7 pixel array were determined and fit to a plane using the least squares fit method. The direction on this plane that is increasing the fastest represents the direction that is perpendicular to the wavefront of electrical propagation and the maximum slope represents the inverse of the speed of conduction in that direction. Right and left atrial CV was determined from maps of the whole atrial preparation. With pixel dimensions of 77 × 77 μm in these measurements the area of the 7 × 7 pixel array was 539 × 539 μm. SAN CV was determined from mapping studies that focused specifically on the right atrial posterior wall (around the site of initial electrical activation in the SAN) with pixel dimensions of 45 × 45 μm. Thus, in these measurements, the area of the 7 × 7 pixel array was 315 × 315 μm, which is well within the anatomical area of the SAN (Liu et al. 2007). Thus, using this method, we computed maximum local CV vectors in the atrial region of interest. In some experiments we also generated optical AP data by measuring the change in fluorescence as a function of time at individual pixels within the SAN.
Quantitative polymerase chain reaction
Quantitative gene expression in SAN, right atrial appendage, left atrial appendage and left ventricular freewall samples was performed as we have described previously (Hua et al. 2012; Springer et al. 2012). We distinguished SAN samples from right atrium samples based on the distinct expression of HCN4 in these two regions, as we have done previously (Hua et al. 2012; Springer et al. 2012). Specifically, we confirmed that our SAN samples highly expressed HCN4 whereas our right atrial samples expressed very low levels of HCN4 (data not shown). In some cases, heart tissues were isolated from wild-type and NPR-C−/− mice at the end of in vivo electrophysiology studies while in other cases tissues were taken from mice that were not used in other experiments in this study. No differences were observed between these two cases and data were combined. Intron spanning primers were designed for NPR-A (Npr1), NPR-B (Npr2), NPR-C (Npr3), collagen I (Col1a) and Collagen III (Col3a) as well as GAPDH (reference gene) and tested using Amplify 3. Following synthesis (Sigma Genosys, St. Louis, MO, USA) primers were reconstituted to 100 nm in nuclease free water and stored at –20°C. Primer sequences were as follows:
Npr1:
Forward 5′-CGAAGCTTCCAAGGTGTGACAGG-3′
Reverse 5′-GACACAGCCATCAGCTCCTGGG-3′
Amplification product 152 base pairs.
Npr2:
Forward 5′-GGGGACTTTCAGCCCGCAGC-3′
Reverse 5′-GTGGAGTTTTATCACAGGATGGGTCG-3′
Amplification product 150 base pairs.
Npr3:
Forward 5′-CGAGCGAGTGGTGATCATGTGTG-3′
Reverse 5′-CTCCACGAGCCATCTCCGTAGG-3′
Amplification product 147 base pairs.
Col1a:
Forward 5’-GCGGACTCTGTTGCTGCTTGC-3’
Reverse 5’-GACCTGCGGGACCCCTTTGT-3’
Amplification product 124 base pairs.
Col3a:
Forward 5’- AGATCCGGGTCCTCCTGGCATTC-3’
Reverse 5’- CTGGTCCCGGATAGCCACCCAT-3’
Amplification product 193 base pairs.
GAPDH:
Forward 5’-GTGCCAGCCTCGTCCCG-3’
Reverse 5’-CCATGTAGTTGAGGTCAATGAAGGG-3’
Amplification product 151 base pairs.
RNA was extracted in PureZOL™ RNA isolation reagent according to kit instructions (Aurum total RNA fatty and fibrous tissue kit; BioRad, Mississauga, ON, Canada). Tissue was eluted in 30–40 μl of elution buffer from the spin column. RNA concentrations were determined using a Qubit fluorometer (Invitrogen, Burlington, ON, Canada) and first strand synthesis reactions were performed using the iScript cDNA synthesis kit (BioRad) according to kit directives with 0.5 μg RNA template. A260/A280 readings were also performed to evaluate the purity of RNA extractions before first strand synthesis. Lack of genomic DNA contamination was verified by reverse transcription–polymerase chain reaction (RT-PCR) using a no-RT control.
RT-quantitative PCR using BRYT green dye (Promega, Madison, WI, USA) was used to assess gene expression. Following RNA extraction cDNA was synthesized and 20 μl BRYT reactions were performed with 1 μl cDNA template. Reactions were carried out using a CFX96 Real-Time PCR machine (BioRad). Amplification conditions were as follows: 95°C for 2 min to activate Taq polymerase, 35 cycles of denaturation at 95°C for 30 s, annealing using a gradient from 53 to 61°C for 30 s and extension at 72°C or 1.5 min. Melt curve analysis was performed from 65 to 95°C in 0.5°C increments. Single amplicons with appropriate melting temperatures and sizes were detected. Data were expressed in the form 2−ΔCT × 100 vs. GAPDH for all tissue samples. CT values >32 were eliminated due to lack of reproducibility (Marionneau et al. 2005). Primers were used at a concentration of 10 nm.
Collagen staining
To assess collagen deposition we used picrosirius red (collagen) and fast green (healthy myocardium) staining (Feridooni et al. 2011) of paraffin-embedded sections (5 μm) through the right and left atrial appendages and the left ventricular freewall. The level of fibrosis was quantified using ImageJ software.
Statistical analysis
All data are presented as means ± SEM. Data were analysed using a Student's t test, one-way or two-way ANOVA with Tukey's post-hoc test, or Fisher's exact test as indicated in each figure and table legend. P < 0.05 was considered significant.
Results
Initial studies assessed cardiac structure and function in NPR-C+/+ and age-matched, littermate NPR-C−/− mice by echocardiography. M-mode images from the short axis (Fig.1A and B) and long axis (Fig.1C and D) were used to assess atrial and ventricular structure and function (findings summarized in Table1). These data demonstrate that NPR-C−/− mice displayed no differences in right atrial area (2.7 ± 0.2 vs. 3.2 ± 0.2 mm2; P = 0.171), left atrial area (3.3 ± 0.2 vs. 3.7 ± 0.1 mm2; P = 0.394), left atrial diameter (0.7 ± 0.1 vs. 1.0 ± 0.2 mm; P = 0.652) or left atrial/aortic root ratio (0.55 ± 0.1 vs. 0.79 ± 0.2; P = 0.257) indicating no changes in atrial size. As further illustrated in Table1, NPR-C−/− mice had some modest alterations in left ventricular structure. Specifically, interventricular septum and left ventricular posterior wall thicknesses were smaller (P < 0.05) during systole and diastole in NPR-C−/− mice in association with an increase in left ventricular internal diameter during systole (P < 0.05), but not diastole (P = 0.205). Despite these modest differences, ejection fraction (73 ± 1% in NPR-C+/+ vs. 71 ± 2% in NPR-C−/−; P = 0.264) and fractional shortening (37 ± 1 in NPR-C+/+ vs. 33 ± 2% in NPR-C−/−; P = 0.09) were not different in NPR-C−/− mice.
Figure 1.
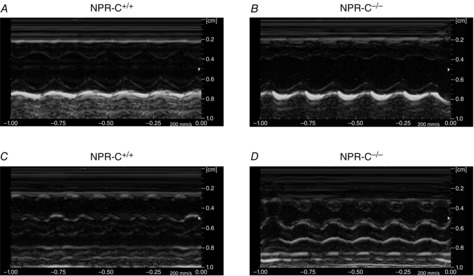
M-mode images of hearts from wild-type and NPR-C knockout mice
A and B, parasternal short axis view of the heart at the level of the midpapillary muscle in NPR-C+/+ and NPR-C−/− mice. C and D, parasternal long axis view of the heart in NPR-C+/+ and NPR-C−/− mice. Refer to Table1 for a summary of echocardiography measurements. NPR, natriuretic peptide receptor.
Table 1.
Echocardiographic measurements in NPR-C+/+ and NPR-C−/− mice
| NPR-C+/+ | NPR-C−/− | P value | |
|---|---|---|---|
| RA area (mm2) | 2.7 ± 0.2 | 3.2 ± 0.2 | 0.171 |
| LA area (mm2) | 3.3 ± 0.2 | 3.7 ± 0.1 | 0.394 |
| LA diameter (mm) | 0.7 ± 0.1 | 1.0 ± 0.2 | 0.652 |
| Aortic diameter (mm) | 1.2 ± 0.04 | 1.2 ± 0.06 | 0.535 |
| LA/aorta | 0.55 ± 0.1 | 0.79 ± 0.2 | 0.257 |
| IVSd (mm) | 0.8 ± 0.02 | 0.7 ± 0.05* | 0.048 |
| IVSs (mm) | 1.3 ± 0.1 | 1.0 ± 0.1* | <0.001 |
| LVPWd (mm) | 0.7 ± 0.02 | 0.6 ± 0.02* | 0.028 |
| LVPWs (mm) | 1.2 ± 0.02 | 1.0 ± 0.04* | 0.005 |
| LVIDd (mm) | 3.6 ± 0.1 | 3.4 ± 0.1 | 0.235 |
| LVIDs (mm) | 2.3 ± 0.01 | 2.7 ± 0.01* | 0.001 |
| EF (%) | 73 ± 1 | 71 ± 2 | 0.264 |
| FS (%) | 37 ± 1 | 33 ± 2 | 0.09 |
Data are means ± SEM; n = 14 mice in each group. *P < 0.05 vs. NPR-C+/+ by Student's t test. Abbreviations: EF, ejection fraction; FS, fractional shortening; IVS, interventricular septum thickness; LA area, left atrial area; LA diameter, left atrial diameter; LA/Ao, left atrial/aortic root ratio; LVID, left ventricular internal diameter; LVPW, left ventricular posterior wall thickness; RA area, right atrial area.
IVS, LVID and LVPW measurements are presented during diastole (d) and systole (s).
NPs are important regulators of blood pressure (Potter et al. 2006); therefore, we next measured blood pressure non-invasively in conscious restrained NPR-C+/+ and NPR-C−/− mice using a tail-cuff apparatus. These data demonstrate no differences in systolic (P = 0.323), diastolic (P = 0.534) or mean arterial (P = 0.453) pressures between genotypes (Table2). We also measured circulating levels of ANP in the plasma of NPR-C+/+ and NPR-C−/− mice by enzyme-linked immunosorbent assay and found that there were no differences (P = 0.751; Table2) between genotypes. These findings suggest that any changes in cardiac structure and/or function in NPR-C−/− mice are not due to alterations in blood pressure or circulating levels of NPs.
Table 2.
Blood pressure and circulating ANP levels in NPR-C+/+ and NPR-C−/− mice
| NPR-C+/+ | NPR-C−/− | P value | |
|---|---|---|---|
| Systolic pressure (mmHg) | 126.2 ± 1.8 | 129.7 ± 3.1 | 0.323 |
| Diastolic pressure (mmHg) | 90.3 ± 4.6 | 93.7 ± 4.1 | 0.534 |
| Mean arterial pressure (mmHg) | 102.0 ± 3.6 | 105.6 ± 3.7 | 0.453 |
| Plasma ANP (pg ml–1) | 37.4 ± 10.2 | 32.6 ± 12.3 | 0.751 |
Abbreviations: ANP, atrial natriuretic peptide; NPR, natriuretic peptide receptor.
Data analysed by Student's t test; n = 7 NPR-C+/+ mice and 9 NPR-C−/− mice for blood pressure measurements; n = 11 NPR-C+/+ mice and 10 NPR-C−/− mice for plasma ANP measurements.
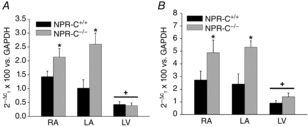
To determine if loss of NPR-C leads to compensatory changes in the expression of the other NPRs we measured the mRNA expression of NPR-A and NPR-B in the SAN, right atrium, left atrium and left ventricle of NPR-C+/+ and NPR-C−/− hearts. These measurements (Fig.2A and B) illustrate that there are no differences in expression of NPR-A (P = 0.10) or NPR-B (P = 0.11) in the hearts of NPR-C−/− mice.
Figure 2.
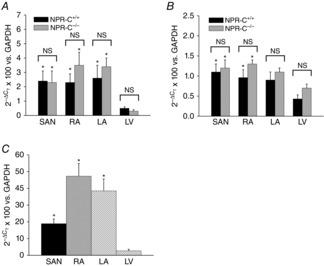
Quantitative mRNA expression of NPRs in the heart
Expression of NPR-A (A), and NPR-B (B), was assessed specifically in the SAN, RA, LA and LV of NPR-C+/+ and NPR-C−/− mice. *P < 0.05 vs. LV within genotype; n = 8 for each genotype. Data analysed by two-way ANOVA with Tukey's post-hoc test. C, expression of NPR-C in the SAN, RA, LA and LV of wild-type mice. *P < 0.05 vs. LV by one-way ANOVA with Tukey's post-hoc text; n = 8 for each region of the heart. LA, left atrium; LV, left ventricle; NPR, natriuretic peptide receptor; NS, not significant; RA, right atrium; SAN, sinoatrial node.
Our recent work has documented potent acute effects of NPs on electrophysiological responses in the heart, including in the SAN and atrial myocardium. Furthermore, our studies have shown that NPR-C can contribute to these effects in specific physiological conditions (Azer et al. 2012, 2014; Springer et al. 2012). Accordingly, we next measured surface ECGs in conjunction with intracardiac programmed stimulation in anaesthetized NPR-C+/+ and NPR-C−/− mice (data summarized in Table3). Baseline HR was not different (P = 0.228) in NPR-C−/− mice (587 ± 12 beats min–1) compared to NPR-C+/+ mice (568 ± 9 beats min–1). Similarly, no differences were observed in ECG intervals, including P wave duration, P-R interval, QRS duration and Q-T interval (Table3) between NPR-C+/+ and NPR-C−/− mice.
Table 3.
ECG intervals and intracardiac ECG parameters in anaesthetized NPR-C+/+ and NPR-C−/− mice
| NPR-C+/+ | NPR-C−/− | P value | |
|---|---|---|---|
| Heart rate (beats min–1) | 568 ± 9 | 587 ± 12 | 0.228 |
| R-R interval (ms) | 106.1 ± 1.6 | 103.1 ± 2.1 | 0.438 |
| P wave duration (ms) | 14.1 ± 0.4 | 13.0 ± 0.3 | 0.117 |
| P-R interval (ms) | 37.6 ± 0.7 | 38.6 ± 0.6 | 0.268 |
| QRS duration (ms) | 11.7 ± 0.4 | 12.7 ± 0.4 | 0.189 |
| Q-T interval (ms) | 40.5 ± 0.9 | 38.7 ± 0.9 | 0.284 |
| Q-Tc interval (ms) | 124.4 ± 2.5 | 120.5 ± 2.2 | 0.393 |
| cSNRT100 (ms) | 36.1 ± 2.0 | 47.1 ± 5.2* | <0.001 |
| AERP (ms) | 32.8 ± 1.4 | 41.0 ± 2.6* | 0.011 |
| AVERP (ms) | 49.5 ± 3.3 | 51.0 ± 1.9 | 0.066 |
| VERP (ms) | 48.5 ± 4.7 | 46.2 ± 5.8 | 0.768 |
Data are means ± SEM; n = 20 NPR-C+/+ mice and 16 NPR-C−/− mice for all measurements except VERP where n = 8 NPR-C+/+ mice and 9 NPR-C−/− mice. *P < 0.05 vs. NPR-C+/+ by Student's t test. Abbreviations: AERP, atrial effective refractory period; AVERP, atrioventricular node effective refractory period; cSNRT, corrected sinoatrial node recovery time; NPR, natriuretic peptide receptor; VERP, ventricular effective refractory period. P-R interval was measured from the start of the P wave to the peak of the QRS complex. Q-T interval was measured from the start of the QRS complex to the end of the T wave. Q-Tc, HR corrected Q-T interval.
SAN function was assessed directly in NPR-C−/− mice by measuring cSNRT (Narula et al. 1972) using intracardiac programmed stimulation in the right atrium (Fig.3; Table3). Interestingly, despite no differences in baseline HR in NPR-C−/− mice, cSNRT (measured at a cycle length of 100 ms) was prolonged (P < 0.05) in NPR-C−/− mice (47.1 ± 5.2 ms) compared to NPR-C+/+ mice (36.1 ± 2.0 ms), indicating an impairment in SAN function. AERP was also prolonged (P < 0.05) in NPR-C−/− mice compared to wild-types (41.0 ± 2.6 vs. 32.8 ± 1.4 ms; Table3). In contrast, no differences were found in the AVERP (P = 0.07) or VERP between genotypes (P = 0.768; Table3).
Figure 3.
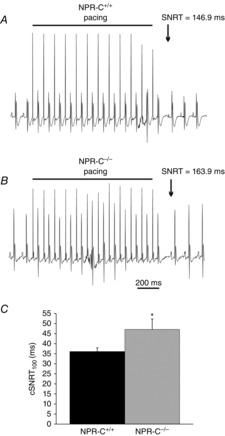
Assessment of SNRT in wild-type and NPR-C knockout mice
A and B, representative ECG recordings during intracardiac programmed stimulation in NPR-C+/+ and NPR-C−/− mice. The pacing protocol consists of 12 stimulated beats in the right atrium at a cycle length of 100 ms. SNRT (arrows) is measured as the latency to the first spontaneous P wave following the last paced beat. C, summary of cSNRT in NPR-C+/+ and NPR-C−/− mice. *P < 0.05 vs. NPR-C+/+ by Student's t test; n = 20 NPR-C+/+ mice and 16 NPR-C−/− mice. NPR, natriuretic peptide receptor; cSNRT, corrected sinoatrial node recovery time; SNRT, sinoatrial recovery time.
The inducibility of AF was assessed in NPR-C+/+ and NPR-C−/− mice during burst pacing in the right atria (Fig.4). Strikingly, NPR-C−/− mice showed a profound increase (P < 0.05) in susceptibility to AF (seven of 15 mice; 47%) in comparison to NPR-C+/+ littermates (one of 17 mice; 6%). Figure4A illustrates a body surface ECG recording from an NPR-C+/+ mouse in which no AF was induced following burst pacing. Rather, this mouse remained in normal sinus rhythm following pacing. Figure4B–D illustrates body surface, atrial and ventricular ECGs and demonstrates induction of AF following burst pacing in NPR-C−/− mice. Specifically, the body surface and ventricular ECGs are characterized by a disorganized and fibrillatory baseline and R-R intervals of variable duration that show no specific pattern. Similarly, the atrial electrogram is fibrillatory and highly disorganized following burst pacing in NPR-C−/− mice. The single NPR-C+/+ mouse that we were able to induce into AF was in this arrhythmia for 4.5 s before reverting back to sinus rhythm. For NPR-C−/− mice the duration of induced AF was not normally distributed and ranged from 1.1 to 116.5 s (mean duration was 19.7 s and the median duration was 30.1 s). We did not observe any occurrences of spontaneous AF (or other arrhythmias) in anaesthetized mice of either genotype during these experiments.
Figure 4.
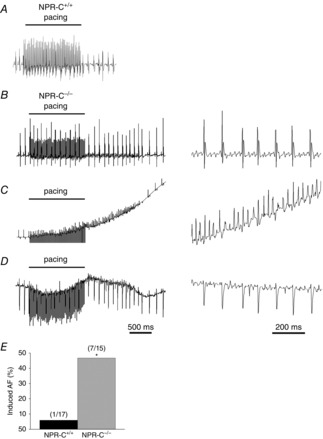
Susceptibility to AF in wild-type and NPR-C knockout mice
A, representative surface ECG recording during burst pacing the right atrium in an NPR-C+/+ mouse. In this example, no arrhythmias were observed and the mouse remained in normal sinus rhythm following pacing. B–D, Representative body surface (B), intracardiac atrial (C) and intracardiac ventricular (D) ECGs showing the induction of AF in an NPR-C−/− mouse following burst pacing. B–D, ECGs on the left illustrate baseline ECGs followed by burst pacing and the ensuing response to burst pacing. In this example, the mouse entered a period of AF and then reverted back to sinus rhythm spontaneously. The ECGs on the right in (B–D) illustrate a portion of the corresponding recording on the left during AF with an expanded time scale. Note that the signal during burst pacing has been truncated for presentation purposes in (C). E, summary of susceptibility to induced AF in NPR-C+/+ and NPR-C−/− mice. Numbers in parentheses indicate the number of animals that entered AF following burst pacing. *P < 0.05 vs. NPR-C+/+ by Fisher's exact test; n = 17 NPR-C+/+ mice and 15 NPR-C−/− mice. AF, atrial fibrillation; NPR, natriuretic peptide receptor.
In contrast to susceptibility to atrial arrhythmias, susceptibility to VT was not different between genotypes as we did not observe any occurrence of VT during burst pacing in the right ventricles of NPR-C+/+ or NPR-C−/− mice (n = 7 mice of each genotype). To determine if the absence of ventricular arrhythmias in NPR-C−/− mice is associated with a difference in expression of NPR-C in the ventricles compared to the supraventricular tissues we measured the mRNA expression of NPR-C in SAN, right atrium, left atrium and left ventricle in wild-type mice. These data (Fig.2C) demonstrate that NPR-C is more highly expressed (P < 0.05) in the SAN, right atrium and left atrium compared to the left ventricle.
Prolongation of cSNRT in NPR-C−/− mice suggests that SAN function is impaired in these animals, despite the lack of a difference in baseline HR. To investigate this further, we directly assessed intrinsic SAN function in vivo by measuring HR during autonomic nervous system blockade with atropine (1 mg kg−1) and propranolol (10 mg kg−1; Fig.5), as we have done previously (Rose et al. 2007b, 2011). Consistent with the ECG data presented in Table3, there was no difference (P = 0.478) in HR between genotypes before autonomic blockade (Fig. 5C). As expected (Rose et al. 2007b, 2011), combined intraperitoneal injection of atropine and propranolol resulted in a decline in HR over the course of 30 min; however, consistent with our measurements of cSNRT, HR was lower (P < 0.05) in NPR-C−/− mice at all time points following autonomic blockade (Fig.5C). Thirty minutes after autonomic blockade HR was 470 ± 6 beats min–1 in NPR-C+/+ mice and 400 ± 10 beats min–1 in NPR-C−/− mice. These findings further support the conclusion that intrinsic SAN function is impaired in NPR-C−/− mice.
Figure 5.
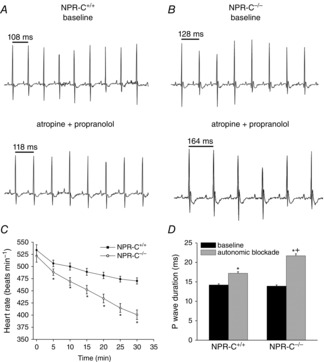
Effects of autonomic nervous system blockade on heart rate and P wave duration in anaesthetized wild-type and NPR-C knockout mice
A and B, representative ECG recordings in baseline conditions and following a combined intraperitoneal injection of atropine (1 mg kg−1) and propranolol (10 mg kg−1) to block the autonomic nervous system. C, summary of the effects of atropine and propranolol (injected at time = 0 min) on heart rate in NPR-C+/+ and NPR-C−/− mice. *P < 0.05 vs. NPR-C+/+ by Student's t test. D, summary of P wave duration at baseline and 30 min after injection of atropine and propranolol in NPR-C+/+ and NPR-C−/− mice. *P < 0.05 vs. baseline; +P < 0.05 vs. NPR-C+/+; data analysed by two-way ANOVA with Tukey's post-hoc test; n = 24 NPR-C+/+ mice and 19 NPR-C−/− mice for autonomic blockade studies. NPR, natriuretic peptide receptor.
Given the high susceptibility of NPR-C−/− mice to AF, we also quantified P wave duration (an indicator of atrial conduction time) following autonomic blockade (Fig.5D). Although there were no differences in P wave duration at baseline (14.2 ± 0.3 ms in NPR-C+/+ vs. 13.9 ± 0.3 in NPR-C−/−; P = 0.623) autonomic blockade resulted in a greater (P < 0.05) prolongation of P wave duration in NPR-C−/− mice (21.7 ± 0.5 ms) compared to NPR-C+/+ mice (17.2 ± 0.4 ms). This indicates that following autonomic blockade atrial conduction was slower in NPR-C−/− mice.
Impaired SAN function and atrial arrhythmogenesis could be associated with changes in AP morphology (i.e. electrical remodelling) in SAN and atrial myocytes. To investigate this possibility APs were recorded in isolated SAN and right atrial myocytes from NPR-C+/+ and NPR-C−/− mice (Fig.6A and E; Table4). There were no differences in cell capacitance in SAN (32.6 ± 1.5 pF in NPR-C+/+ vs. 31.7 ± 1.2 pF in NPR-C−/−; P = 0.783) or atrial (53.8 ± 2.4 pF in NPR-C+/+ vs. 49.6 ± 4.0 pF in NPR-C−/−; P = 0.660) myocytes indicating that myocyte size was not altered in the hearts of NPR-C−/− mice. These data demonstrate that there were no differences in AP firing frequency (Fig.6B; P = 0.937) or any other AP parameter, including DD slope (Fig.6C; P = 0.563) or AP duration at 50% repolarization (APD50; Fig.6D; P = 0.888) in NPR-C−/− SAN myocytes. Similarly, atrial AP morphology was unaltered and there were no differences in APD50 (Fig.6F; P = 0.138) or APD90 (Fig.6G; P = 0.359) in NPR-C−/− atrial myocytes compared to NPR-C+/+ atrial myocytes. These data demonstrate that SAN dysfunction and atrial arrhythmogenesis in NPR-C−/− mice are not due to electrical remodelling in SAN or atrial myocytes.
Figure 6.
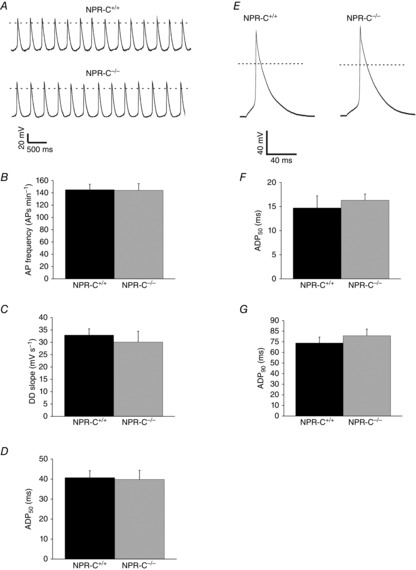
AP morphology in isolated SAN and right atrial myocytes from wild-type and NPR-C knockout mice
A, representative spontaneous APs from SAN myocytes from NPR-C+/+ and NPR-C−/− mice. Dotted line is at 0 mV. Summary data illustrate AP frequency (B), DD slope (C), and APD50 (D), in SAN myocytes from NPR-C+/+ and NPR-C−/− SAN myocytes. There were no significant differences in AP parameters in NPR-C−/− SAN myocytes (data analysed by Student's t test; n = 10 NPR-C+/+ and 7 NPR-C−/− SAN myocytes). E, representative stimulated APs from right atrial myocytes from NPR-C+/+ and NPR-C−/− mice. Summary data illustrate APD50 (F) and APD90 (G), in atrial myocytes from NPR-C+/+ and NPR-C−/− SAN myocytes. There were no significant differences in AP parameters in NPR-C−/− SAN myocytes (data analysed by Student's t test; n = 16 NPR-C+/+ and 15 NPR-C−/− atrial myocytes). Refer to Table4 for additional AP parameters. AP, action potential; APD, action potential duration; DD slope, slope of diastolic depolarization; NPR, natriuretic peptide receptor; SAN, sinoatrial node.
Table 4.
AP parameters in SAN and atrial myocytes from NPR-C+/+ and NPR-C−/− mice
| NPR-C+/+ | NPR-C−/− | P value | |
|---|---|---|---|
| SAN myocytes | |||
| n | 10 | 7 | |
| Capacitance (pF) | 32.6 ± 1.5 | 31.7 ± 1.2 | 0.783 |
| AP frequency (APs min–1) | 145 ± 9 | 144 ± 11 | 0.937 |
| MDP (mV) | –67.5 ± 1.1 | –66.7 ± 1.2 | 0.661 |
| DD slope (mV s–1) | 32.9 ± 2.6 | 30.1 ± 4.4 | 0.563 |
| Vmax (V s–1) | 19.5 ± 4.4 | 22.6 ± 6.7 | 0.501 |
| OS (mV) | 8.6 ± 1.8 | 9.4 ± 1.3 | 0.327 |
| APD50 (ms) | 40.7 ± 3.5 | 39.8 ± 4.6 | 0.888 |
| APD90 (ms) | 105.2 ± 10.5 | 115.9 ± 14.4 | 0.562 |
| Atrial myocytes | |||
| n | 16 | 15 | |
| Capacitance (pF) | 53.8 ± 2.4 | 49.6 ± 4.0 | 0.660 |
| RMP (mV) | –78.3 ± 1.2 | –79.9 ± 1.0 | 0.30 |
| Vmax (V s–1) | 120.3 ± 6.3 | 114.1 ± 8.4 | 0.554 |
| OS (mV) | 51.6 ± 3.4 | 47.4 ± 2.8 | 0.350 |
| APD50 (ms) | 14.7 ± 2.5 | 16.3 ± 1.3 | 0.138 |
| APD90 (ms) | 68.8 ± 5.6 | 75.7 ± 6.3 | 0.359 |
Abbreviations: AP, action potential; APD50, AP duration at 50% repolarization; APD90, AP duration at 90% repolarization; DD slope, diastolic depolarization slope; MDP, maximum diastolic potential; NPR-C, natriuretic peptide receptor C; OS, overshoot; RMP, resting membrane potential; SAN, sinoatrial node; Vmax, maximum AP upstroke velocity. There were no significant differences in any AP parameters in SAN or atrial myocytes between genotypes. Data analysed by Student's t test.
Next, we used high-resolution optical mapping to investigate whether SAN dysfunction and increased susceptibility to atrial arrhythmias in NPR-C−/− mice are associated with alterations in electrical conduction in these regions of the myocardium. We have recently demonstrated that electrical conduction in the SAN and atrial myocardium can be precisely measured in mouse atrial preparations using this approach (Azer et al. 2014). Representative activation maps for whole atrial preparations from NPR-C+/+ and NPR-C−/− hearts are illustrated in Fig.7A. In these experiments atrial preparations were mapped from the epicardial side of the heart and the right atrium is on the left side of the image. These activation maps demonstrate that, as expected, the first electrical breakthrough occurs in the right atrial posterior wall, which corresponds to the initial point of excitation in the SAN (Azer et al. 2014). From this site conduction propagates into the right and left atrial appendages. These activation maps demonstrate that conduction time throughout the atrial preparation is longer in NPR-C−/− hearts (note the larger number of isochrones with less space between adjacent isochrones in the NPR-C−/− map).
Figure 7.
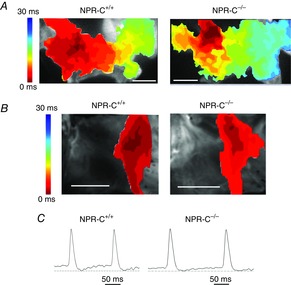
Patterns of electrical conduction in the sinoatrial node and atria of wild-type and NPR-C knockout hearts
A, representative colour maps showing activation patterns in whole atrial preparations from NPR-C+/+ and NPR-C−/− mice. The right atrial appendage is on the left side of the image. Red colour indicates earliest activation time (ms) within the right atrial posterior wall. Scale bars are 2 mm. Time interval between isochrones is 1 ms. B, representative colour maps showing activation patterns specifically around the point of initial activation in the sinoatrial node within the right atrial posterior wall. In these images the right side of the heart is on the right side of the image. Scale bars are 2 mm. C, representative spontaneous optical sinoatrial node action potentials from the region of initial electrical activation as mapped in (B). Dashed horizontal lines are shown through the maximum diastolic potential. NPR, natriuretic peptide receptor.
Activation maps from the right atrial posterior wall around the point of initial electrical excitation (i.e. the SAN region) are shown in Fig.7B. Mapping of the right atrial posterior wall was done from the endocardial side of the atrial preparation. We confirmed that this corresponds to the SAN region by measuring optical APs from the area around the site of initial activation. As expected for the SAN (Mangoni & Nargeot, 2008; Fedorov et al. 2012; Azer et al. 2014), these optical APs always showed clear DD phases between successive APs (Fig.7C). Once again, these activation maps demonstrate that conduction time was slower in NPR-C−/− hearts.
Initially, we quantified cycle length in atrial preparations in sinus rhythm (Fig.8A). These measurements show that cycle length was prolonged (P < 0.05) in NPR-C−/− hearts (187.1 ± 14.5 ms) in comparison to NPR-C+/+ hearts (146.7 ± 8.3 ms) further supporting the conclusion that SAN function is impaired in NPR-C−/− mice. This is also evident from the optical APs presented in Fig.7C, which show that the diastolic period between successive APs is longer in the NPR-C−/− heart. We calculated local CVs in the SAN and atria (see Methods) in atrial preparations in sinus rhythm using methods we have described previously (Azer et al. 2014). SAN CV was 4.8 ± 0.2 cm s–1 in NPR-C+/+ hearts vs. 3.8 ± 0.3 cm s–1 in NPR-C−/− hearts (P < 0.05; Fig.8B). Right atrial CV was 34.1 ± 1.3 cm s–1 in NPR-C+/+ hearts vs. 29.1 ± 1.5 cm s–1 in NPR-C−/− hearts (P < 0.05; Fig.8C). Left atrial CVs were very similar to those measured in the right atria and were also similarly reduced (P < 0.05) in NPR-C−/− hearts (Fig.8D). As expected, SAN CVs are much slower than atrial CVs (Verheijck et al. 2001; Nygren et al. 2004; Fedorov et al. 2006; Azer et al. 2014). To account for the possibility of rate-dependent effects on CV, we also measured SAN, right atrial and left atrial CVs in atrial preparations externally paced at a cycle length of 120 ms. Similar to atrial preparations in sinus rhythm, SAN, right atrial and left atrial CVs were lower (P < 0.05) in paced NPR-C−/− hearts (Fig.8E–G). Together, these experiments demonstrate that electrical conduction in the SAN and atrial myocardium is slowed in NPR-C−/− mice.
Figure 8.
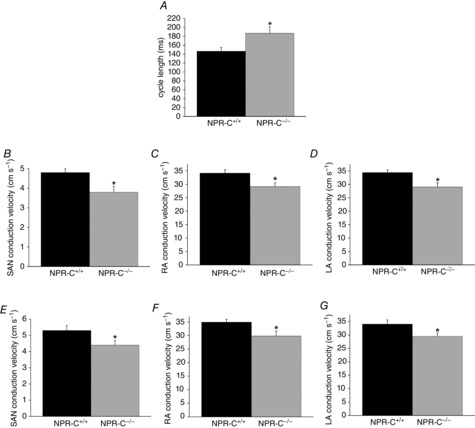
Summary of SAN and atrial conduction velocities in wild-type and NPR-C knockout hearts
A, cycle length in NPR-C+/+ and NPR-C−/− atrial preparations in sinus rhythm. B–D, SAN, RA and LA conduction velocities in NPR-C+/+ and NPR-C−/− hearts in sinus rhythm. E–G, SAN, RA and LA conduction velocities in NPR-C+/+ and NPR-C−/− atrial preparations paced at a cycle length of 120 ms. *P < 0.05 vs. NPR-C+/+ by Student's t test; n = 5–7 hearts in each genotype. LA, left atrial; NPR, natriuretic peptide receptor; RA, right atrial; SAN, sinoatrial node.
NPs are known to have potent antifibrotic effects in the heart (Potter et al. 2006; Calvieri et al. 2012) and alterations in collagen deposition can affect electrical conduction and susceptibility to arrhythmias (Rohr, 2009; Yue et al. 2011). Based on this, and the absence of alterations in AP morphology in SAN or atrial myocytes, we hypothesized that the increased susceptibility to atrial arrhythmias and slowed conduction in the SAN and atria of NPR-C−/− mice may be associated with an increase in atrial fibrosis. To test this hypothesis, we performed quantitative PCR experiments and histological analyses to determine if collagen expression and deposition are altered in the atria, as well as the left ventricle, of NPR-C−/− mice. Figure9A and B demonstrate that the mRNA expression of collagen I and collagen III are increased (P < 0.05) in the right and left atria of NPR-C−/− mice. In contrast, and consistent with an absence of ventricular arrhythmias in NPR-C−/− mice, there was no difference in ventricular expression of collagen I (P = 0.841) or collagen III (P = 0.125) in the left ventricles of NPR-C+/+ and NPR-C−/− mice.
Figure 9.
Quantitative mRNA expression of collagen I and collagen III in the hearts of wild-type and NPR-C knockout mice
Quantitative mRNA expression is shown for collagen I (A) and collagen III (B) relative to GAPDH in the RA, LA and LV of NPR-C+/+ and NPR-C−/− mice. *P < 0.05 vs. NPR-C+/+ within each region; +P < 0.05 vs. RA and LA within genotype. There was no difference in expression of collagen I (P = 0.996) or collagen III (P = 0.998) between RA and LA within genotype; n = 5 NPR-C+/+ hearts and 6 NPR-C−/− hearts. Data analysed by two-way ANOVA with Tukey's post-hoc test. LA, left atrium; LV, left ventricle; NPR, natriuretic peptide receptor; RA, right atrium.
In agreement with these gene expression data, picrosirius red staining of collagen (Fig.10) illustrates a clear increase in interstitial fibrosis in the right and left atria of NPR-C−/− hearts in comparison to wild-type littermates, whereas ventricular fibrosis was similar between genotypes. The extent of fibrosis was quantified from these histological images (Fig.10C) and found to be ∼6-fold greater (P < 0.05) in the right and left atria of NPR-C−/− mice. In contrast, there was no difference (P = 0.785) in ventricular fibrosis between genotypes. There were also no differences (P = 0.898) in extent of fibrosis between right and left atria within each genotype. Together, these findings demonstrate that the atria of NPR-C−/− mice are characterized by structural remodelling and enhanced fibrosis, which may explain the increased susceptibility to atrial arrhythmias in these mice.
Figure 10.
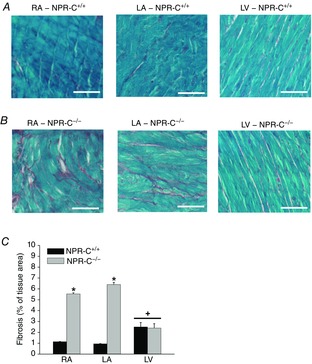
Patterns of interstitial fibrosis in the hearts of wild-type and NPR-C knockout mice
A, representative images illustrating patterns of interstitial collagen deposition (red colour) in the RA, LA and LV in NPR-C+/+ hearts. Scale bars are 50 μm. B, representative images illustrating patterns of interstitial collagen deposition (red colour) in the RA, LA and LV in NPR-C−/− hearts. Scale bars are 50 μm. C, quantification of fibrosis from histological sections in the RA and LA and the LV. *P < 0.05 vs. NPR-C+/+ within each region of the heart; +P < 0.05 vs. RA and LA within genotype. There was no difference in LV fibrosis between genotypes (P = 0.758). There was also no difference in percentage fibrosis between RA and LA within genotypes (P = 0.220). Data analysed by two-way ANOVA with Tukey's post-hoc test; n = 5 NPR-C+/+ and 5 NPR-C−/− heart for RA and LA; n = 4 NPR-C+/+ and 4 NPR-C−/− hearts for LV. LA, left atrium; LV, left ventricle; NPR, natriuretic peptide receptor; RA, right atrium.
Discussion
The role of NPR-C in the heart has been poorly understood; however, the present study greatly enhances our understanding of the role of this receptor as a critical regulator of cardiac structure, function and arrhythmogenesis. Our experiments demonstrate that mice lacking NPR-C are characterized by SAN dysfunction and increased susceptibility to AF in association with atrial fibrosis and impaired electrical conduction in the SAN and atrial myocardium. In contrast, despite some modest changes in ventricular structure (as determined by echocardiography), we observed no differences in VERP or susceptibility to ventricular arrhythmias in NPR-C−/− mice, indicating that the loss of NPR-C mainly affects arrhythmogenesis in the supraventricular tissues. Consistent with this conclusion, there was also no difference in expression of collagens or patterns of interstitial fibrosis in the left ventricles of NPR-C+/+ and NPR-C−/− mice. The lack of a ventricular phenotype in NPR-C−/− mice may be due to the finding that NPR-C is expressed at much higher levels in the supraventricular tissues than in the ventricles. Importantly, we also demonstrate that the expression of NPR-A and NPR-B throughout the heart (SAN, right and left atria, left ventricle) is not altered in NPR-C−/− mice, which is consistent with previous work (Springer et al. 2012) as well as a previous study that assessed NPR-A and NPR-B expression using semiquantitative binding assays (Matsukawa et al. 1999). We also observed no differences in circulating ANP levels between wild-type and NPR-C−/− mice. These findings strongly suggest that the phenotype we have described is due specifically to the loss of NPR-C and is not associated with compensatory changes in expression of other NPRs or changes in circulating NP levels.
It was notable that despite a clear prolongation in cSNRT we found no differences in HR in NPR-C−/− mice in basal conditions. Rather, differences in HR were only observed following autonomic blockade. This finding suggests that the autonomic nervous system is compensating for a lower intrinsic firing rate in the SAN in NPR-C−/− mice, a phenomenon that has been observed in previous studies (Dobrzynski et al. 2007; Rose et al. 2007b; Tellez et al. 2011). Similar observations were made for P wave duration, which is a reliable indicator of atrial conduction, in NPR-C−/− mice before and after autonomic blockade. P wave duration is known to be prolonged during autonomic blockade (Cheema et al. 1995) and our data show that the magnitude of this prolongation is greater in NPR-C−/− mice indicating a slowing of atrial conduction. Greater prolongation of P wave duration during autonomic blockade is consistent with the enhanced susceptibility to atrial arrhythmias in NPR-C−/− mice (Stafford et al. 1991). Our measures of cSNRT were obtained following pacing of the heart for 12 beats at a fixed cycle length of 120 ms. We have previously used this approach to assess cSNRT in mice (Rose et al. 2011); however, it should be noted that this pacing duration is shorter than some other studies have reported (Berul et al. 1996). Nevertheless, all of our measures of intrinsic SAN function consistently and conclusively demonstrate an impairment in NPR-C−/− mice.
To better assess the mechanistic basis for impaired SAN function and enhanced susceptibility to AF in NPR-C−/− mice we used high-resolution optical mapping of atrial preparations. This approach enabled us to assess properties of electrical conduction in the SAN and atrial myocardium. These experiments demonstrate that conduction is slowed in both the SAN and the atria of NPR-C−/− mice. This is probably a critical contributor to the increased incidence of AF observed in these mice because a slowing of conduction will decrease the wavelength of re-entry (i.e. the product of the refractory period and the CV), which is thought to be a major mechanism for re-entry in AF (Jalife et al. 2002; Nattel, 2002). Assessment of collagen expression and deposition revealed enhanced fibrosis in the atria of NPR-C−/− mice. Fibrosis is known to increase the incidence of SAN dysfunction and AF by slowing conduction and causing fragmentation of propagating wavefronts, which can lead to multiple re-entry circuits (Camelliti et al. 2005; Zlochiver et al. 2008; Rohr, 2009; Krogh-Madsen et al. 2012; Wolf et al. 2013).
Another key determinant of the wavelength of re-entry is the refractory period, which can be affected by changes in AP duration due to underlying alterations in ion channel function (Nattel, 2002). Similarly, impairments in SAN function and HR can be associated with alterations in spontaneous AP morphology. We assessed these possibilities directly by recording APs in isolated SAN and right atrial myocytes. These data demonstrate no differences in AP firing in NPR-C−/− mice. We have also previously measured L-type Ca2+ currents (ICa,L) and/or hyperpolarization activated currents (If) in SAN and atrial myocytes from NPR-C−/− mice (Azer et al. 2012; Springer et al. 2012). From these previous studies, there is no evidence of any differences in these ionic currents in SAN or atrial myocytes isolated from NPR-C−/− mice. Furthermore, AERP (measured during intracardiac programmed stimulation) was actually increased in NPR-C−/− mice in the present study, which would be expected to increase the wavelength of re-entry. These observations indicate that the increased susceptibility to AF and the occurrence of SAN dysfunction in NPR-C−/− mice is not due to ion channel (i.e. electrical) remodelling in the myocytes. This was somewhat surprising as changes in sinus node recovery time are often associated with alterations in intrinsic electrical function in SAN myocytes; however, it is now appreciated that fibrosis can also profoundly interfere with normal SAN activity (Wolf et al. 2013). Similarly, it is well known that fibrosis can be a major factor in the susceptibility to AF (Burstein & Nattel, 2008; Rohr, 2009). Thus, when considered collectively, our data demonstrate that SAN dysfunction and AF occur in NPR-C−/− mice due to structural remodelling and enhanced fibrosis in the atria rather than changes in ion channel function in SAN or atrial myocytes.
The finding that arrhythmias in NPR-C−/− mice are primarily associated with fibrosis, and not electrical remodelling, suggests that NPs act upon NPR-C in cardiac fibroblasts to regulate extracellular matrix deposition. Consistent with this, NPs are known to have potent antifibrotic and antiproliferative effects on fibroblasts in the heart (Calvieri et al. 2012). Although, these effects have been largely attributed to NPR-A or NPR-B and subsequent changes in cGMP signalling (Tsuruda et al. 2002; Horio et al. 2003; Kapoun et al. 2004; Kawakami et al. 2004); there is evidence that NPR-C can also play a direct role in these processes (Huntley et al. 2006). We have also demonstrated NPR-C-mediated effects of NPs on non-selective cation currents in cardiac fibroblasts (Rose et al. 2007a) although it is presently unknown whether NPR-C-mediated effects on these ion channels in fibroblasts is linked to collagen deposition. Taken together, these findings strongly implicate a direct signalling role for NPR-C in the regulation of cardiac structure and extracellular matrix deposition, particularly in the supraventricular tissues. Nevertheless, it is possible that the loss of NPR-C may also result in altered NP effects mediated by the NPR-A and NPR-B receptors. We have demonstrated that the expression of NPR-A and NPR-B is not altered in the atria of NPR-C−/− mice. Furthermore, we found no alterations in circulating ANP levels, which is in agreement with a previous study that also measured circulating NP levels in NPR-C−/− mice (Matsukawa et al. 1999). It should be noted; however, that this previous study observed an increase in the half-life of ANP in these mice (Matsukawa et al. 1999). Thus, it is possible that NPR-C ablation could result in an enhancement of local NP signalling via the GC-linked NPR-A and NPR-B receptors. In this context, it is important to note that lower concentrations of NPs may preferentially bind NPR-C, while higher concentrations can result in activation of all three NPRs (Becker et al. 2014). Similarly, in the normal heart, the overall effects of NPs can be mediated by the simultaneous activation of the GC-linked receptors and NPR-C, which activate distinct signalling pathways that can each contribute to the overall effect of NPs (Azer et al. 2012). In contrast, NPs would only signal via NPR-A and NPR-B in NPR-C−/− hearts, which may result in distinct effects of NPs and could be a contributing factor to the phenotype of NPR-C−/− mice described in the present study. Clearly, NPR signalling in the heart is complex; however, when considered in the context of our previous work (Azer et al. 2012, 2014; Springer et al. 2012), the present study strongly suggests that the phenotype we have observed in NPR-C−/− mice is due mainly to a loss of direct NPR-C-mediated effects of NPs in the myocardium.
NPs are known to exert some of their antifibrotic effects by opposing the actions of profibrotic compounds such as angiotensin II and transforming growth factor β in cardiac fibroblasts (Kapoun et al. 2004; Soeki et al. 2005; Li et al. 2008; Parthasarathy et al. 2013). The antifibrotic effects of NPs are also thought to involve alterations in activity or expression of matrix metalloproteinases and tissue inhibitors of metalloproteinases, proteins that play a critical role in the maintenance of the extracellular matrix (Kassiri & Khokha, 2005), in fibroblasts (Tsuruda et al. 2002; Kapoun et al. 2004; Parthasarathy et al. 2013). It is presently unknown whether any of these effects specifically involve NPR-C or whether expression of these proteins is altered in NPR-C−/− mice. These possibilities will be investigated in future studies.
In the present study we found no differences in blood pressure between NPR-C+/+ and NPR-C−/− mice, which further supports our conclusion that the increased occurrence of atrial arrhythmias in NPR-C−/− mice is due to direct effects of NPR-C within the heart. Interestingly, one other study reported that blood pressure is modestly reduced (∼8 mmHg) in a distinct NPR-C−/− mouse (Matsukawa et al. 1999). The reason for this difference is not clear and this previous study did not assess cardiac structure or electrophysiological properties in their NPR-C−/− mouse. Nevertheless, it seems reasonable to conclude that changes (or lack thereof) in blood pressure are not responsible for enhanced fibrosis and structural remodelling in the NPR-C−/− heart.
NPR-C receptors are normally homodimers (Potter et al. 2006) and there is some evidence that the GC-linked NPRs may form heterodimers with each other (Chinkers & Wilson, 1992). As the NPR-C knockout mouse used in this study produces a non-functional mutant NPR-C protein (Jaubert et al. 1999) some consideration should be given to the possibility that this mutated NPR-C could dimerize with NPR-A or NPR-B and act in a dominant-negative manner. This possibility is highly unlikely. Our recent work shows that some of the acute effects of NPs on HR and ECG intervals (in the intact heart) as well as on AP morphology and ion currents (isolated SAN and atrial myocytes) are mediated by the NPR-A or NPR-B receptors and that these effects are indistinguishable in wild-type and NPR-C−/− mice (Azer et al. 2012; Springer et al. 2012). This, in combination with our data demonstrating that the expression of NPR-A and NPR-B are unaltered in our NPR-C−/− mice indicates that the GC-linked NPRs are functioning normally in our NPR-C−/− mice and that the phenotype we have observed is attributable to the loss of NPR-C signalling in the heart.
Interest in the use of NPs for the treatment of cardiovascular disease remains high as these hormones are viewed as powerful cardioprotective compounds. Recombinant BNP (i.e. nesiritide) and ANP (i.e. carperitide) are currently approved for use in North America and Japan, respectively (Cataliotti & Burnett, 2005; Potter et al. 2006; Lee & Burnett, 2007). In addition, current efforts to develop synthetic chimeric NPs, such as CD-NP (Lee et al. 2009; Rose, 2010), for the treatment of heart failure are ongoing. Although the beneficial effects of these NPs are mainly thought to be related to changes in cGMP signalling downstream of NPR-A and NPR-B, each of these peptides is also able to bind to NPR-C. Our work strongly implicates a critical protective role for NPR-C in the heart and this should be taken into account when designing synthetic NPs for therapeutic use and when interpreting their physiological effects.
In conclusion, we have shown that loss of NPR-C in mice results in the development of SAN dysfunction and increased susceptibility to atrial arrhythmias in association with impaired electrical conduction and atrial fibrosis. In contrast, no changes in susceptibility to ventricular arrhythmias were observed. These observations provide critical new insight into the role of this NP receptor and demonstrate that NPR-C is a powerful protective receptor in the heart. These findings could have implications for the future use of NPs in the treatment of cardiovascular disease.
Glossary
Abbreviations
- AERP
atrial effective refractory period
- AF
atrial fibrillation
- AC
adenylyl cyclase
- ANP
atrial natriuretic peptide
- AP
action potential
- APD
action potential duration
- BNP
B-type natriuretic peptide
- cSNRT
corrected sinoatrial node recovery time
- CV
conduction velocity
- DD slope
slope of diastolic depolarization
- GC
guanylyl cyclase
- Gi
inhibitory G protein
- HR
heart rate
- ICa,L
L-type Ca2+ current
- If
hyperpolarization activated current
- NPs
natriuretic peptides
- NPR
natriuretic peptide receptor
- SAN
sinoatrial node
- SNRT
sinoatrial node recovery time
- VERP
ventricular effective refractory period
- VT
ventricular tachycardia
Additional information
Competing interests
None.
Author contributions
All experiments were performed at Dalhousie University. The conception and design of experiments were performed by E.E.E., K.V. and R.A.R. The collection, analysis and interpretation of data have been done by E.E.E., K.V., R.H., H.J.J., M.M., I.P., O.B., R.H., M.M., S.R., G.R. and R.A.R. Drafting of the article or revising it critically for important intellectual content was done by E.E.E., K.V., R.H., H.J.J., M.M., I.P. and R.A.R. All authors approved the final version for publication.
Funding
This work was supported by operating grants from the Canadian Institutes of Health Research (MOP 93718) and the Heart and Stroke Foundation of Nova Scotia to R.A.R. who holds New Investigator Awards from the Canadian Institutes of Health Research and the Heart and Stroke Foundation of Canada. E.E.E. and R.H. are each supported by Fellowships from the Heart and Stroke Foundation of Canada.
References
- Anand-Srivastava MB. Natriuretic peptide receptor-C signaling and regulation. Peptides. 2005;26:1044–1059. doi: 10.1016/j.peptides.2004.09.023. [DOI] [PubMed] [Google Scholar]
- Anand-Srivastava MB. Trachte GJ. Atrial natriuretic factor receptors and signal transduction mechanisms. Pharmacol Rev. 1993;45:455–497. [PubMed] [Google Scholar]
- Azer J, Hua R, Vella K. Rose RA. Natriuretic peptides regulate heart rate and sinoatrial node function by activating multiple natriuretic peptide receptors. J Mol Cell Cardiol. 2012;53:715–724. doi: 10.1016/j.yjmcc.2012.08.020. [DOI] [PubMed] [Google Scholar]
- Azer J, Hua R, Krishnaswamy PS. Rose RA. Effects of natriuretic peptides on electrical conduction in the sinoatrial node and atrial myocardium of the heart. J Physiol. 2014;592:1025–1045. doi: 10.1113/jphysiol.2013.265405. [DOI] [PMC free article] [PubMed] [Google Scholar]
- Becker JR, Chatterjee S, Robinson TY, Bennett JS, Panakova D, Galindo CL, Zhong L, Shin JT, Coy SM, Kelly AE, Roden DM, Lim CC. MacRae CA. Differential activation of natriuretic peptide receptors modulates cardiomyocyte proliferation during development. Development. 2014;141:335–345. doi: 10.1242/dev.100370. [DOI] [PMC free article] [PubMed] [Google Scholar]
- Berul CI, Aronovitz MJ, Wang PJ. Mendelsohn ME. In vivo cardiac electrophysiology studies in the mouse. Circulation. 1996;94:2641–2648. doi: 10.1161/01.cir.94.10.2641. [DOI] [PubMed] [Google Scholar]
- Burnett JC., Jr Korinek J( The tumultuous journey of nesiritide: past, present, and future. Circ Heart Fail. 2008;1:6–8. doi: 10.1161/CIRCHEARTFAILURE.108.776294. [DOI] [PMC free article] [PubMed] [Google Scholar]
- Burstein B. Nattel S. Atrial fibrosis: mechanisms and clinical relevance in atrial fibrillation. J Am Coll Cardiol. 2008;51:802–809. doi: 10.1016/j.jacc.2007.09.064. [DOI] [PubMed] [Google Scholar]
- Calvieri C, Rubattu S. Volpe M. Molecular mechanisms underlying cardiac antihypertrophic and antifibrotic effects of natriuretic peptides. J Mol Med (Berl) 2012;90:5–13. doi: 10.1007/s00109-011-0801-z. [DOI] [PubMed] [Google Scholar]
- Camelliti P, Borg TK. Kohl P. Structural and functional characterisation of cardiac fibroblasts. Cardiovasc Res. 2005;65:40–51. doi: 10.1016/j.cardiores.2004.08.020. [DOI] [PubMed] [Google Scholar]
- Cataliotti A. Burnett JC., Jr Natriuretic peptides: novel therapeutic targets in heart failure. J Investig Med. 2005;53:378–384. doi: 10.2310/6650.2005.53711. [DOI] [PubMed] [Google Scholar]
- Cheema AN, Ahmed MW, Kadish AH. Goldberger JJ. Effects of autonomic stimulation and blockade on signal-averaged P wave duration. J Am Coll Cardiol. 1995;26:497–502. doi: 10.1016/0735-1097(95)80028-f. [DOI] [PubMed] [Google Scholar]
- Chinkers M. Wilson EM. Ligand-independent oligomerization of natriuretic peptide receptors. Identification of heteromeric receptors and a dominant negative mutant. J Biol Chem. 1992;267:18589–18597. [PubMed] [Google Scholar]
- Dobrzynski H, Boyett MR. Anderson RH. New insights into pacemaker activity: promoting understanding of sick sinus syndrome. Circulation. 2007;115:1921–1932. doi: 10.1161/CIRCULATIONAHA.106.616011. [DOI] [PubMed] [Google Scholar]
- Farman GP, Tachampa K, Mateja R, Cazorla O, Lacampagne A. de Tombe PP. Blebbistatin: use as inhibitor of muscle contraction. Pflugers Arch. 2008;455:995–1005. doi: 10.1007/s00424-007-0375-3. [DOI] [PubMed] [Google Scholar]
- Fedorov VV, Hucker WJ, Dobrzynski H, Rosenshtraukh LV. Efimov IR. Postganglionic nerve stimulation induces temporal inhibition of excitability in rabbit sinoatrial node. Am J Physiol Heart Circ Physiol. 2006;291:H612–623. doi: 10.1152/ajpheart.00022.2006. [DOI] [PubMed] [Google Scholar]
- Fedorov VV, Chang R, Glukhov AV, Kostecki G, Janks D, Schuessler RB. Efimov IR. Complex interactions between the sinoatrial node and atrium during reentrant arrhythmias in the canine heart. Circulation. 2010;122:782–789. doi: 10.1161/CIRCULATIONAHA.109.935288. [DOI] [PMC free article] [PubMed] [Google Scholar]
- Fedorov VV, Glukhov AV. Chang R. Conduction barriers and pathways of the sinoatrial pacemaker complex: their role in normal rhythm and atrial arrhythmias. Am J Physiol Heart Circ Physiol. 2012;302:H1773–H1783. doi: 10.1152/ajpheart.00892.2011. [DOI] [PubMed] [Google Scholar]
- Feridooni T, Hotchkiss A, Remley-Carr S, Saga Y. Pasumarthi KB. Cardiomyocyte specific ablation of p53 is not sufficient to block doxorubicin induced cardiac fibrosis and associated cytoskeletal changes. PLoS One. 2011;6:e22801. doi: 10.1371/journal.pone.0022801. [DOI] [PMC free article] [PubMed] [Google Scholar]
- Fukui A, Takahashi N, Nakada C, Masaki T, Kume O, Shinohara T, Teshima Y, Hara M. Saikawa T. Role of leptin signaling in the pathogenesis of angiotensin II-mediated atrial fibrosis and fibrillation. Circ Arrhythm Electrophysiol. 2013;6:402–409. doi: 10.1161/CIRCEP.111.000104. [DOI] [PubMed] [Google Scholar]
- Glukhov AV, Fedorov VV, Anderson ME, Mohler PJ. Efimov IR. Functional anatomy of the murine sinus node: high-resolution optical mapping of ankyrin-B heterozygous mice. Am J Physiol Heart Circ Physiol. 2010;299:H482–H491. doi: 10.1152/ajpheart.00756.2009. [DOI] [PMC free article] [PubMed] [Google Scholar]
- Horio T, Tokudome T, Maki T, Yoshihara F, Suga S, Nishikimi T, Kojima M, Kawano Y. Kangawa K. Gene expression, secretion, and autocrine action of C-type natriuretic peptide in cultured adult rat cardiac fibroblasts. Endocrinology. 2003;144:2279–2284. doi: 10.1210/en.2003-0128. [DOI] [PubMed] [Google Scholar]
- Hua R, Adamczyk A, Robbins C, Ray G. Rose RA. Distinct patterns of constitutive phosphodiesterase activity in mouse sinoatrial node and atrial myocardium. PLoS One. 2012;7:e47652. doi: 10.1371/journal.pone.0047652. [DOI] [PMC free article] [PubMed] [Google Scholar]
- Huntley BK, Sandberg SM, Noser JA, Cataliotti A, Redfield MM, Matsuda Y. Burnett JC., Jr BNP-induced activation of cGMP in human cardiac fibroblasts: interactions with fibronectin and natriuretic peptide receptors. J Cell Physiol. 2006;209:943–949. doi: 10.1002/jcp.20793. [DOI] [PubMed] [Google Scholar]
- Jalife J, Berenfeld O. Mansour M. Mother rotors and fibrillatory conduction: a mechanism of atrial fibrillation. Cardiovasc Res. 2002;54:204–216. doi: 10.1016/s0008-6363(02)00223-7. [DOI] [PubMed] [Google Scholar]
- Jaubert J, Jaubert F, Martin N, Washburn LL, Lee BK, Eicher EM. Guenet JL. Three new allelic mouse mutations that cause skeletal overgrowth involve the natriuretic peptide receptor C gene (Npr3) Proc Natl Acad Sci USA. 1999;96:10278–10283. doi: 10.1073/pnas.96.18.10278. [DOI] [PMC free article] [PubMed] [Google Scholar]
- Kapoun AM, Liang F, O'Young G, Damm DL, Quon D, White RT, Munson K, Lam A, Schreiner GF. Protter AA. B-type natriuretic peptide exerts broad functional opposition to transforming growth factor-beta in primary human cardiac fibroblasts: fibrosis, myofibroblast conversion, proliferation, and inflammation. Circ Res. 2004;94:453–461. doi: 10.1161/01.RES.0000117070.86556.9F. [DOI] [PubMed] [Google Scholar]
- Kassiri Z. Khokha R. Myocardial extra-cellular matrix and its regulation by metalloproteinases and their inhibitors. Thromb Haemost. 2005;93:212–219. doi: 10.1160/TH04-08-0522. [DOI] [PubMed] [Google Scholar]
- Kawakami R, Saito Y, Kishimoto I, Harada M, Kuwahara K, Takahashi N, Nakagawa Y, Nakanishi M, Tanimoto K, Usami S, Yasuno S, Kinoshita H, Chusho H, Tamura N, Ogawa Y. Nakao K. Overexpression of brain natriuretic peptide facilitates neutrophil infiltration and cardiac matrix metalloproteinase-9 expression after acute myocardial infarction. Circulation. 2004;110:3306–3312. doi: 10.1161/01.CIR.0000147829.78357.C5. [DOI] [PubMed] [Google Scholar]
- Krogh-Madsen T, Abbott GW. Christini DJ. Effects of electrical and structural remodeling on atrial fibrillation maintenance: a simulation study. PLoS Comput Biol. 2012;8:e1002390. doi: 10.1371/journal.pcbi.1002390. [DOI] [PMC free article] [PubMed] [Google Scholar]
- Lee CY. Burnett JC., Jr Natriuretic peptides and therapeutic applications. Heart Fail Rev. 2007;12:131–142. doi: 10.1007/s10741-007-9016-3. [DOI] [PubMed] [Google Scholar]
- Lee CY, Lieu H. Burnett JC., Jr Designer natriuretic peptides. J Investig Med. 2009;57:18–21. doi: 10.231/JIM.0b013e3181946fb2. [DOI] [PMC free article] [PubMed] [Google Scholar]
- Levin ER, Gardner DG. Samson WK. Natriuretic peptides. N Engl J Med. 1998;339:321–328. doi: 10.1056/NEJM199807303390507. [DOI] [PubMed] [Google Scholar]
- Li P, Wang D, Lucas J, Oparil S, Xing D, Cao X, Novak L, Renfrow MB. Chen YF. Atrial natriuretic peptide inhibits transforming growth factor beta-induced Smad signaling and myofibroblast transformation in mouse cardiac fibroblasts. Circ Res. 2008;102:185–192. doi: 10.1161/CIRCRESAHA.107.157677. [DOI] [PubMed] [Google Scholar]
- Liu J, Dobrzynski H, Yanni J, Boyett MR. Lei M. Organisation of the mouse sinoatrial node: structure and expression of HCN channels. Cardiovasc Res. 2007;73:729–738. doi: 10.1016/j.cardiores.2006.11.016. [DOI] [PubMed] [Google Scholar]
- Lucas KA, Pitari GM, Kazerounian S, Ruiz-Stewart I, Park J, Schulz S, Chepenik KP. Waldman SA. Guanylyl cyclases and signaling by cyclic GMP. Pharmacol Rev. 2000;52:375–414. [PubMed] [Google Scholar]
- Maack T, Suzuki M, Almeida FA, Nussenzveig D, Scarborough RM, McEnroe GA. Lewicki JA. Physiological role of silent receptors of atrial natriuretic factor. Science. 1987;238:675–678. doi: 10.1126/science.2823385. [DOI] [PubMed] [Google Scholar]
- Mangoni ME. Nargeot J. Properties of the hyperpolarization-activated current (If) in isolated mouse sinoatrial cells. Cardiovasc Res. 2001;52:51–64. doi: 10.1016/s0008-6363(01)00370-4. [DOI] [PubMed] [Google Scholar]
- Mangoni ME. Nargeot J. Genesis and regulation of the heart automaticity. Physiol Rev. 2008;88:919–982. doi: 10.1152/physrev.00018.2007. [DOI] [PubMed] [Google Scholar]
- Marionneau C, Couette B, Liu J, Li H, Mangoni ME, Nargeot J, Lei M, Escande D. Demolombe S. Specific pattern of ionic channel gene expression associated with pacemaker activity in the mouse heart. J Physiol. 2005;562:223–234. doi: 10.1113/jphysiol.2004.074047. [DOI] [PMC free article] [PubMed] [Google Scholar]
- Matsukawa N, Grzesik WJ, Takahashi N, Pandey KN, Pang S, Yamauchi M. Smithies O. The natriuretic peptide clearance receptor locally modulates the physiological effects of the natriuretic peptide system. Proc Natl Acad Sci USA. 1999;96:7403–7408. doi: 10.1073/pnas.96.13.7403. [DOI] [PMC free article] [PubMed] [Google Scholar]
- Morley GE, Vaidya D, Samie FH, Lo C, Delmar M. Jalife J. Characterization of conduction in the ventricles of normal and heterozygous Cx43 knockout mice using optical mapping. J Cardiovasc Electrophysiol. 1999;10:1361–1375. doi: 10.1111/j.1540-8167.1999.tb00192.x. [DOI] [PubMed] [Google Scholar]
- Narula OS, Samet P. Javier RP. Significance of the sinus-node recovery time. Circulation. 1972;45:140–158. doi: 10.1161/01.cir.45.1.140. [DOI] [PubMed] [Google Scholar]
- Nattel S( New ideas about atrial fibrillation 50 years on. Nature. 2002;415:219–226. doi: 10.1038/415219a. [DOI] [PubMed] [Google Scholar]
- Nygren A, Lomax AE. Giles WR. Heterogeneity of action potential durations in isolated mouse left and right atria recorded using voltage-sensitive dye mapping. Am J Physiol Heart Circ Physiol. 2004;287:H2634–H2643. doi: 10.1152/ajpheart.00380.2004. [DOI] [PubMed] [Google Scholar]
- O'Connor CM, Starling RC, Hernandez AF, Armstrong PW, Dickstein K, Hasselblad V, Heizer GM, Komajda M, Massie BM, McMurray JJ, Nieminen MS, Reist CJ, Rouleau JL, Swedberg K, Adams KF, Jr, Anker SD, Atar D, Battler A, Botero R, Bohidar NR, Butler J, Clausell N, Corbalan R, Costanzo MR, Dahlstrom U, Deckelbaum LI, Diaz R, Dunlap ME, Ezekowitz JA, Feldman D, Felker GM, Fonarow GC, Gennevois D, Gottlieb SS, Hill JA, Hollander JE, Howlett JG, Hudson MP, Kociol RD, Krum H, Laucevicius A, Levy WC, Mendez GF, Metra M, Mittal S, Oh BH, Pereira NL, Ponikowski P, Tang WH, Tanomsup S, Teerlink JR, Triposkiadis F, Troughton RW, Voors AA, Whellan DJ, Zannad F. Califf RM. Effect of nesiritide in patients with acute decompensated heart failure. N Engl J Med. 2011;365:32–43. doi: 10.1056/NEJMoa1100171. [DOI] [PubMed] [Google Scholar]
- Pagano M. Anand-Srivastava MB. Cytoplasmic domain of natriuretic peptide receptor C constitutes Gi activator sequences that inhibit adenylyl cyclase activity. J Biol Chem. 2001;276:22064–22070. doi: 10.1074/jbc.M101587200. [DOI] [PubMed] [Google Scholar]
- Parthasarathy A, Gopi V, Umadevi S, Simna A, Sheik MJ, Divya H. Vellaichamy E. Suppression of atrial natriuretic peptide/natriuretic peptide receptor-A-mediated signaling upregulates angiotensin-II-induced collagen synthesis in adult cardiac fibroblasts. Mol Cell Biochem. 2013;378:217–228. doi: 10.1007/s11010-013-1612-z. [DOI] [PubMed] [Google Scholar]
- Potter LR, Abbey-Hosch S. Dickey DM. Natriuretic peptides, their receptors, and cyclic guanosine monophosphate-dependent signaling functions. Endocr Rev. 2006;27:47–72. doi: 10.1210/er.2005-0014. [DOI] [PubMed] [Google Scholar]
- Rae J, Cooper K, Gates P. Watsky M. Low access resistance perforated patch recordings using amphotericin B. J Neurosci Methods. 1991;37:15–26. doi: 10.1016/0165-0270(91)90017-t. [DOI] [PubMed] [Google Scholar]
- Rohr S( Myofibroblasts in diseased hearts: new players in cardiac arrhythmias? Heart Rhythm. 2009;6:848–856. doi: 10.1016/j.hrthm.2009.02.038. [DOI] [PubMed] [Google Scholar]
- Rose RA( CD-NP, a chimeric natriuretic peptide for the treatment of heart failure. Curr Opin Investig Drugs. 2010;11:349–356. [PubMed] [Google Scholar]
- Rose RA. Giles WR. Natriuretic peptide C receptor signalling in the heart and vasculature. J Physiol. 2008;586:353–366. doi: 10.1113/jphysiol.2007.144253. [DOI] [PMC free article] [PubMed] [Google Scholar]
- Rose RA, Lomax AE. Giles WR. Inhibition of L-type Ca2+ current by C-type natriuretic peptide in bullfrog atrial myocytes: an NPR-C-mediated effect. Am J Physiol Heart Circ Physiol. 2003;285:H2454–H2462. doi: 10.1152/ajpheart.00388.2003. [DOI] [PubMed] [Google Scholar]
- Rose RA, Lomax AE, Kondo CS, Anand-Srivastava MB. Giles WR. Effects of C-type natriuretic peptide on ionic currents in mouse sinoatrial node: a role for the NPR-C receptor. Am J Physiol Heart Circ Physiol. 2004;286:H1970–H1977. doi: 10.1152/ajpheart.00893.2003. [DOI] [PubMed] [Google Scholar]
- Rose RA, Hatano N, Ohya S, Imaizumi Y. Giles WR. C-type natriuretic peptide activates a non-selective cation current in acutely isolated rat cardiac fibroblasts via natriuretic peptide C receptor-mediated signalling. J Physiol. 2007a;580:255–274. doi: 10.1113/jphysiol.2006.120832. [DOI] [PMC free article] [PubMed] [Google Scholar]
- Rose RA, Kabir MG. Backx PH. Altered heart rate and sinoatrial node function in mice lacking the cAMP regulator phosphoinositide 3-kinase-gamma. Circ Res. 2007b;101:1274–1282. doi: 10.1161/CIRCRESAHA.107.158428. [DOI] [PubMed] [Google Scholar]
- Rose RA, Sellan M, Simpson JA, Izaddoustdar F, Cifelli C, Panama BK, Davis M, Zhao D, Markhani M, Murphy GG, Striessnig J, Liu PP, Heximer SP. Backx PH. Iron overload decreases CaV1.3-dependent L-type Ca2+ currents leading to bradycardia, altered electrical conduction, and atrial fibrillation. Circ Arrhythm Electrophysiol. 2011;4:733–742. doi: 10.1161/CIRCEP.110.960401. [DOI] [PMC free article] [PubMed] [Google Scholar]
- Soeki T, Kishimoto I, Okumura H, Tokudome T, Horio T, Mori K. Kangawa K. C-type natriuretic peptide, a novel antifibrotic and antihypertrophic agent, prevents cardiac remodeling after myocardial infarction. J Am Coll Cardiol. 2005;45:608–616. doi: 10.1016/j.jacc.2004.10.067. [DOI] [PubMed] [Google Scholar]
- Springer J, Azer J, Hua R, Robbins C, Adamczyk A, McBoyle S, Bissell MB. Rose RA. The natriuretic peptides BNP and CNP increase heart rate and electrical conduction by stimulating ionic currents in the sinoatrial node and atrial myocardium following activation of guanylyl cyclase-linked natriuretic peptide receptors. J Mol Cell Cardiol. 2012;52:1122–1134. doi: 10.1016/j.yjmcc.2012.01.018. [DOI] [PubMed] [Google Scholar]
- Stafford PJ, Turner I. Vincent R. Quantitative analysis of signal-averaged P waves in idiopathic paroxysmal atrial fibrillation. Am J Cardiol. 1991;68:751–755. doi: 10.1016/0002-9149(91)90648-5. [DOI] [PubMed] [Google Scholar]
- Tellez JO, McZewski M, Yanni J, Sutyagin P, Mackiewicz U, Atkinson A, Inada S, Beresewicz A, Billeter R, Dobrzynski H. Boyett MR. Ageing-dependent remodelling of ion channel and Ca2+ clock genes underlying sinoatrial node pacemaking. Exp Physiol. 2011;96:1163–1178. doi: 10.1113/expphysiol.2011.057752. [DOI] [PubMed] [Google Scholar]
- Tsuruda T, Boerrigter G, Huntley BK, Noser JA, Cataliotti A, Costello-Boerrigter LC, Chen HH. Burnett JC., Jr Brain natriuretic Peptide is produced in cardiac fibroblasts and induces matrix metalloproteinases. Circ Res. 2002;91:1127–1134. doi: 10.1161/01.res.0000046234.73401.70. [DOI] [PubMed] [Google Scholar]
- Verheijck EE, van Kempen MJ, Veereschild M, Lurvink J, Jongsma HJ. Bouman LN. Electrophysiological features of the mouse sinoatrial node in relation to connexin distribution. Cardiovasc Res. 2001;52:40–50. doi: 10.1016/s0008-6363(01)00364-9. [DOI] [PubMed] [Google Scholar]
- Wolf RM, Glynn P, Hashemi S, Zarei K, Mitchell CC, Anderson ME, Mohler PJ. Hund TJ. Atrial fibrillation and sinus node dysfunction in human ankyrin-B syndrome: a computational analysis. Am J Physiol Heart Circ Physiol. 2013;304:H1253–H1266. doi: 10.1152/ajpheart.00734.2012. [DOI] [PMC free article] [PubMed] [Google Scholar]
- Yue L, Xie J. Nattel S. Molecular determinants of cardiac fibroblast electrical function and therapeutic implications for atrial fibrillation. Cardiovasc Res. 2011;89:744–753. doi: 10.1093/cvr/cvq329. [DOI] [PMC free article] [PubMed] [Google Scholar]
- Zhou H. Murthy KS. Identification of the G protein-activating sequence of the single-transmembrane natriuretic peptide receptor C (NPR-C) Am J Physiol Cell Physiol. 2003;284:C1255–C1261. doi: 10.1152/ajpcell.00520.2002. [DOI] [PubMed] [Google Scholar]
- Zlochiver S, Munoz V, Vikstrom KL, Taffet SM, Berenfeld O. Jalife J. Electrotonic myofibroblast-to-myocyte coupling increases propensity to reentrant arrhythmias in two-dimensional cardiac monolayers. Biophys J. 2008;95:4469–4480. doi: 10.1529/biophysj.108.136473. [DOI] [PMC free article] [PubMed] [Google Scholar]