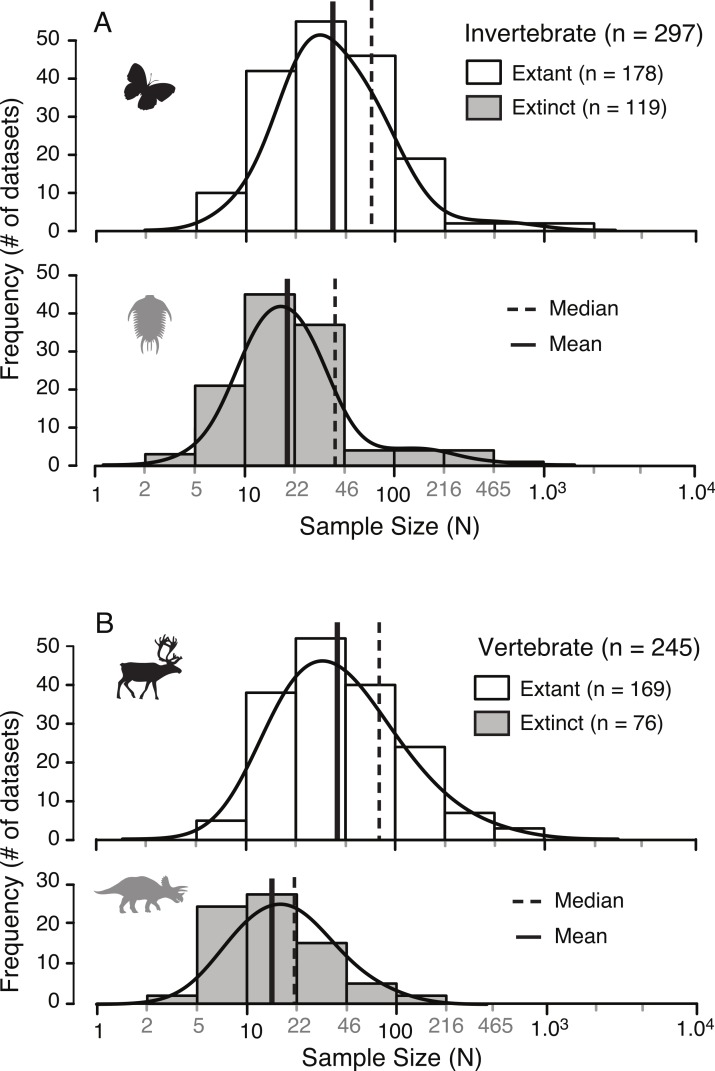
Figure 3. Distribution of sample sizes in published studies of intraspecies allometry.
Distribution of 542 sample sizes in published studies examining intraspecies allometry, or ontogenetic trajectories, in invertebrates (A) and vertebrates (B). Solid vertical lines indicate the median, and dotted vertical lines indicate the mean.

