

Abstract
Transcranial direct current stimulation (tDCS) modulates glutamatergic neurotransmission and can be utilized as a novel treatment intervention for a multitude of populations. However, the exact mechanism by which tDCS modulates the brain’s neural architecture, from the micro to macro scales, have yet to be illuminated. Using a within-subjects design, resting-state functional magnetic resonance imaging (rs-fMRI) and proton magnetic resonance spectroscopy (1H-MRS) were performed immediately before and after the administration of anodal tDCS over right parietal cortex. Group independent component analysis (ICA) was used to decompose fMRI scans into 75 brain networks, from which 12 resting-state networks were identified that had significant voxel-wise functional connectivity to anatomical regions of interest. 1H-MRS was used to obtain estimates of combined glutamate and glutamine (Glx) concentrations from bilateral intraparietal sulcus. Paired sample t-tests showed significantly increased Glx under the anodal electrode, but not in homologous regions of the contralateral hemisphere. Increases of within-network connectivity were observed within the superior parietal, inferior parietal, left frontal-parietal, salience and cerebellar intrinsic networks, and decreases in connectivity were observed in the anterior cingulate and the basal ganglia (p < 0.05, FDR-corrected). Individual differences in Glx concentrations predicted network connectivity in most of these networks. The observed relationships between glutamatergic neurotransmission and network connectivity may be used to guide future tDCS protocols that aim to target and alter neuroplastic mechanisms in healthy individuals as well as those with psychiatric and neurologic disorders.
Keywords: Transcranial direct current stimulation (tDCS), resting-state functional magnetic resonance imaging (rs-fMRI), magnetic resonance spectroscopy (MRS), independent component analysis (ICA), functional network connectivity (FNC), glutamine-glutamate (Glx), parietal lobe
1. Introduction
Neuroplasticity is essential for brain development and adaptation as it enables the nervous system to reorganize neural pathways based on new experiences. Research is underway to examine ways to harness neuroplasticity in order to promote healing and recovery (see Peled, 2004; 2005; Spedding et al., 2003; and Kays et al., 2012 for review). Transcranial direct current stimulation (tDCS) is a non-invasive brain stimulation technique that modulates the excitability of functional brain networks (Polania et al., 2011; Keeser et al., 2011; Sehm et al., 2012; Peña-Gómez et al., 2012). It is thought to increase the spontaneous firing of cortical neurons near the anodal electrode (with positive polarity) while decreasing it near the cathode (with negative polarity) (Nitsche and Paulus, 2000; Dieckhöfer et al, 2006). By modulating the excitability of glutamatergic pyramidal neurons in the underlying cortex (Radman et al, 2009), tDCS influences neurophysiological mechanisms responsible for neuroplasticity. These mechanisms involve the potentiation of synaptic glutamatergic receptors (Liebetanz et al, 2002; Nitsche and Paulus, 2005), and decreased neurotransmission of γ-aminobutyric acid interneurons (GABA) (Nitsche et al, 2004; Stagg et al, 2009; 2011; also see Medeiros et al, 2012 for review).
In particular, NMDA and AMPA receptors are essential to synaptic plasticity by influencing long-term potentiation and depression (LTP and LTD) across structurally-connected brain regions (Bliss & Collingridge, 1993). These synaptic and neuronal pathways consolidate into stable and long-lasting functional brain networks (Fricke et al, 2011; Venkatakrishnan et al, 2011, 2012). However, the effects of tDCS on glutamate levels and its relation to large-scale network connectivity have yet to be fully elucidated; that is, there must be a better understanding of how tDCS interacts across different scales within the brain’s neural architecture by combining different, yet complementary, imaging modalities (see Hunter et al., 2013 for a review), which was the primary objective of the present study.
1.1. tDCS-Induced Effects on Neurometabolites
Proton magnetic resonance spectroscopy (1H-MRS) enables quantification of certain neurometabolites within a localized region of the brain (Gruettier, 2001; Steen et al., 2005). This method has been used to examine the effects of tDCS on specific neurometabolites. To date, anodal tDCS has been associated with increases in combined glutamine and glutamate (Glx) (Stagg et al., 2009; Clark et al., 2011) and myoinositol concentrations (Rango et al., 2008). Concordantly, reductions have been found in GABA concentration with anodal tDCS (Stagg et al., 2009). Consistent with these findings, the activation of metabotropic glutamate receptors, in conjunction with stable long-range intrinsic membrane oscillations, has been shown to entrain local and distributed GABAergic interneurons (Whittington et al., 1995). Together, the observed changes in glutamatergic and GABAergic activity may translate to subsequent alterations in both local and distributed processing—influenced by both excitatory and inhibitory signaling pathways—in functional brain networks.
1.2. tDCS-Induced Effects on Network-Based Connectivity
Functional magnetic resonance imaging (fMRI) is a noninvasive technique for acquiring dynamic changes in blood oxygenation, measured as the blood-oxygenation-level dependent (BOLD) signal. While at rest, spontaneous fluctuations in the BOLD signal (0.10–0.15 Hz) show high correlations across structurally connected and functionally related brain regions (Biswal et al., 1995; Skudlarski et al., 2008; see Fox et al., 2007 for review). These fluctuations reflect a stable, intrinsic organization of the brain that maintains and reinforces established synaptic connections that support cognitive and behavioral functions (see Fox et al., 2007 & Van den Heuvel and Pol, 2010 for reviews). The most commonly observed intrinsic network is the default-mode network (DMN), which links precuneus and posterior cingulate cortex (PCC) with bilateral inferior parietal and medial frontal cortices, with the highest activations observed in the posterior regions (Raichle, 2001; Greicius et al., 2003). Independent component analysis (ICA) can be used to decompose resting-state fMRI (rs-fMRI) signals into functionally related “groups” of voxels that comprise functionally connected brain networks (Erhardt et al., 2011). The strength of ICA is its ability to resolve data into maximally independent sources, thereby revealing the dynamics of intrinsic networks (McKeown, 1997; Calhoun et al., 2001; Beckmann et al., 2005; Calhoun et al., 2011; 2012).
A recent study of anodal (2.0 mA) tDCS over the dorsolateral prefrontal cortex (DLPFC), with the cathode placed over contralateral supraorbital area, resulted in increased intrinsic functional connectivity within the frontal node of the DMN and the left frontal-parietal network (Keeser et al., 2011). Similarly, Peña-Gómez et al. (2012) found that this same tDCS montage produced a redistribution of ICA-generated functional network connectivity (FNC), a measure of the temporal relationship among ICA components. Increase FNC between networks that overlapped with the site of stimulation and with superior parietal networks (comprising task-related circuits) was observed; whereas a decrease in FNC was found between networks that comprise the DMN (Peña-Gómez et al., 2012). These results suggest that anodal tDCS over DLPFC may enhance the flexible balance between brain networks by enhancing network connectivity for cognitive demands while reducing its anti-correlated DMN activity.
Furthermore, a recent rs-fMRI study placed the anode over the right angular gyrus, with the cathode over contralateral supraorbital region (Clemens et al., 2012). Increases in ICA-generated functional connectivity in the cerebellum, medial occipital, sensorimotor, right frontal parietal, and superior frontal gyrus were observed, while decreases were found in the right putamen and lateral occipital areas. Furthermore, active tDCS has also contributed to both inter-hemispheric (Sehm et al., 2012; 2013; Park et al., 2013) and corticostriatal functional connectivity (Polania et al., 2012; Clemens et al., 2014). Overall, studies that combine fMRI and tDCS show widespread changes in functional connectivity at both local and distant brain regions relative to the area of stimulation (Polania et al., 2011; Keeser et al., 201; Amadi et al., 2014).
1.3. Established Relationships Between Imaging Modalities
In order to examine the relationship between neurotransmission (either excitatory or inhibitory) and the variability of functional brain responses, there are a number of studies that combined 1H-MRS with fMRI hemodynamic responses (Donahue et al., 2010; Muthukumaraswamy et al., 2012; Falkenberg et al., 2012), task-related negative BOLD responses (Walter et al., 2009; Northoff et al., 2007), resting-state functional connectivity (Horn et al., 2010; Kapogiannis et al., 2013) and effective connectivity (Duncan et al., 2011). The results from these multi-modal imaging studies demonstrate that increases in glutamate concentrations predict increases in BOLD activity, whereas increases in GABA predict decreases in BOLD activity. For instance, increases in glutamatergic concentrations in the precuneus predicted increases in ICA-generated intrinsic network connectivity within the precuneus node of the DMN, while decreases in GABA predicted overall increases in DMN activity (Kapogiannis et al., 2012).
1.4. Study Objectives & Rationale
In summary, tDCS may alter changes in the BOLD signal by modulating neuronal and glial metabolic demands, perhaps related to the glutamate/glutamine cycle (Bonvento et al., 2002). Furthermore, given that Glx was increased by tDCS in our previous study (Clark et al., 2011), and that there is a strong relationship between glutamate and functional connectivity in other studies that have not used tDCS (Horn et al., 2010; Kapogiannis et al., 2013), the objective of the current study was to examine whether tDCS-evoked changes in Glx may predict variation in functional connectivity within and between both local and distributed intrinsic brain networks.
To preferentially modulate excitatory signaling in large-scale functional connectivity, the present study positioned the anode over the right superior parietal cortex, with an extracephalic cathode tDCS montage. By removing the direct influence of the cathode on cortical activity, this montage allows for a more precise evaluation of anodal tDCS on cortical excitability. The parietal cortex is an essential network hub that supports many different attentional processes, including endogenous attentional control and spatial orienting of attention (Corbetta et al., 2008; Vandenberghe and Gillebert, 2009). Moreover, recent tDCS studies have shown that right parietal stimulation produces significant increases in visual-spatial processing (Sparing et al., 2009), covert visual orienting (Bologini et al., 2010), learning in a complex visual detection task (Clark et al., 2012), attentional selection (Moos et al., 2012) and perceived position (Wright & Krekelberg, 2013).
1.5. Hypotheses
Based on the literature summarized above, we hypothesized that tDCS would increase functional connectivity within networks located near the right parietal cortex (the targeted area of anodal stimulation), while decreasing functional connectivity within networks in the medial regions of the DMN (Keeser et al., 2011; Peña-Gómez et al., 2012), which could be tested using ICA to assess the network connectivity before and after tDCS. We also hypothesized that tDCS would increase FNC between network pairs that contain circuits supporting attention-related functions, as tDCS to this region has been found to enhance attentive cognitive functions. Given that previous studies found that anodal tDCS enhanced the balance between brain networks, partly by decreasing FNC between DMN and subcortical functional circuits (Peña-Gómez et al. 2012; Polania et al., 2012; Clemens et al., 2014), we also hypothesized that FNC between the DMN and subcortical networks would be decreased after tDCS. Lastly, given that tDCS enhances voxel-wise functional connectivity via glutamatergic signaling pathways, we expected that tDCS-related increases in Glx post-tDCS would relate to increases within and between networks.
2. Results
2.1. Group Independent Component Analysis
Following Allen et al. (2011), a high-dimensional model-order ICA was performed using Group ICA fMRI Toolbox (GIFTv3.0a; http://mialab.mrn.org/software/gift/). Prior to the first and second PCA data reductions (1st at c = 100; final at c = 75), which were computed on each subjects’ dataset before doing the group PCA, the time-series at each voxel were scaled to percent signal change using the intensity normalization function in GIFT. This option was selected based on a recent study which showed that this pre-processing method maximizes the detectability of individual differences in functional connectivity measures at the group-level (Khullar et al., 2011; Erhardt et al., 2011). The infomax ICA algorithm, which incorporates nonlinearities in the transfer function to capture higher-order moments in the BOLD resting-state fluctuations (Bell and Sejnowski, 1995), was then used to detect the independent source components in the data. ICA was repeated 15 times using ICASSO toolbox in order to estimate the algorithmic and statistical reliability of the ICA decomposition (Himberg, Hyvärinen, and Esposito, 2004). Back-reconstruction was then run using group ICA (GICA3), with component spatial maps of functional connectivity scaled to represent the original data units in percent signal change.
2.2. Identified Networks of Interest
All 12 networks are displayed in Figure 1. Three networks were identified with aggregate spatial maps that overlapped with parietal regions near the area of stimulation and 1H-MRS voxels. These parietal networks included a bilateral superior parietal lobule (SPL) network, a bilateral inferior parietal network and a bilateral superior parietal sulcus (SPS) network. When taken together, 3 networks captured the full extent of the DMN along the anterior-posterior and inferior-superior axes (Raichle et al., 2001; Allen et al., 2011): a precuneus network, a PCC and bilateral angular gyrus network, and an ACC network. Three additional networks were identified with distributed spatial maps that overlapped with well-known attention-related networks, which included a left-lateralized frontal-parietal network, which showed the highest activation in the parietal regions and a smaller cluster in the right posterior parietal (k=241) and PCC (k=299) cortices. There was also a right-lateralized frontal-parietal network, which showed the highest voxel-wise functional connectivity in the right lateral frontal regions. A network that displayed the highest functional connectivity in bilateral insulae and dorsal ACC, comprising the well-known “salience” network was also included (Seeley et al., 2007; Menon et al., 2010; Bonnelle et al., 2012; Ham et al., 2013; Uddin et al., 2013). There was one frontal component, which comprised bilateral anterior prefrontal cortex (PFC), with additional voxels observed in the thalamus (k=160). Lastly, two sub-cortical networks were found: one represented by the putamen and palladium—labeled the basal ganglia network (BG), and the other consisted of the left cerebellum.
Figure 1. ICA-generated spatial maps of the 13 networks of interest.
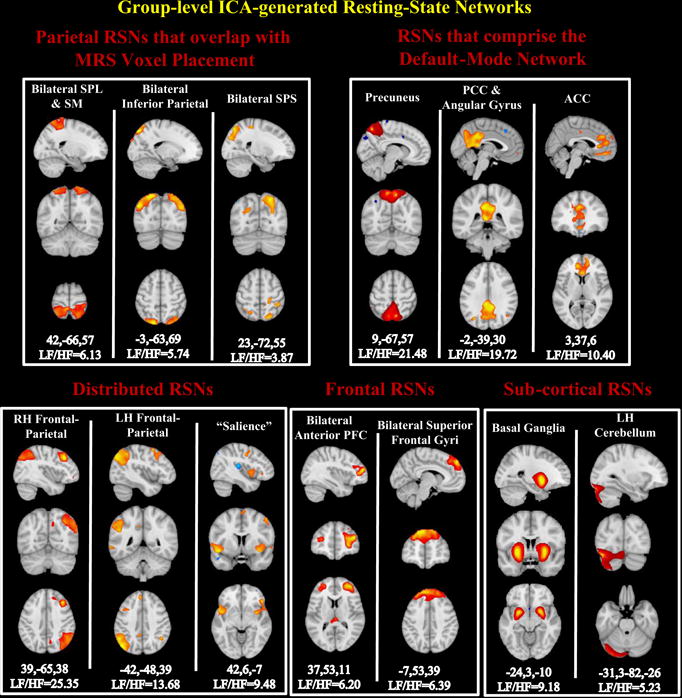
Spatial maps are plotted as Z-scores, Z > 3.0 and are displayed at the slice showing highest network connectivity. The (x,y,z) MNI coordinates are labeled underneath each component as well as the low-frequency to high-frequency power ratio (LF/HF) for each network. Higher values indicate more power in lower frequency. Color bars correspond to the range of connectivity values derived from a one-sample t-test. Abbreviations: RH, right hemisphere; LH, left hemisphere; PCC, posterior cingulate cortex; ACC, anterior cingulate cortex; SPL, superior parietal lobule; SM, sensorimotor; SPS, superior parietal sulcus.
2.3. Changes in Neurometabolite Concentrations
As reported in the larger sample in Clark et al., 2011, paired-sample t-tests showed that there was a statistically significant increase in the Glx obtained in the right parietal cortex after anodal stimulation, t(8) = 2.61, p = 0.03, but not the left, t(8) = 1.41, p = 0.20.
2.4. Paired T-Tests of Voxel-Wise Functional Connectivity Before and After tDCS
Table 1 displays summary statistics for all the statistically significant cluster- and peak-level differences. For the bilateral SPL network, the right-hemisphere premotor cortex exhibited one of the largest significant increases in functional connectivity (see Table 1 and Figure 2). For the bilateral inferior parietal network, the largest increases were primarily observed in the left hemisphere with only a trend-level increase in the right IPS (p = 0.06, FDR-corrected; see Table 1). The ACC network also exhibited robust decreases in functional connectivity after tDCS in ACC proper and medial frontal gyrus (see Table 1 and Figure 3). No significant differences were observed in the other 3 networks/nodes that comprise the DMN.
Table 1.
Summary Statistics for paired-sample T-tests on component spatial maps, comparing before and after tDCS.
| Component | Direction of Effect | Peak-level
|
Cluster-level
|
||
|---|---|---|---|---|---|
| Component Sub-regions | T-score* | X Y Z (MNI) | # of voxels | FDR p-value | |
| Parietal (local tDCS) RSNs | |||||
|
| |||||
| Bilateral SPL Network | |||||
|
| |||||
| RH SPL and Precentral-Motor | Post > Pre | 16.74 | 36 −30 72 | 11 | 0.04 |
|
| |||||
| Bilateral Inferior Parietal | |||||
|
| |||||
| LH IPS | Post > Pre | 20.28 | −39 −75 36 | 14 | 0.04 |
| LH lateral IPS | Post > Pre | 17.93 | −27 −78 45 | 15 | 0.04 |
| RH IPS | Post > Pre | 3.66 (u.c.) | 24 −84 45 | 16 | 0.06 |
|
| |||||
| Node within DMN | |||||
|
| |||||
| ACC Network | |||||
|
| |||||
| RH ACC | Post < Pre | 16.5 | 12 39 6 | 47 | <0.001 |
| RH medial frontal gyrus | Post < Pre | 10.74 | 12 57 18 | 19 | 0.005 |
|
| |||||
| Distributed RSNs | |||||
|
| |||||
| LH Frontal-Parietal | |||||
| LH Superior Division of LOC | Post > Pre | 10.24 | −42 −66 45 | 28 | 0.002 |
| LH Inf. Parietal | Post > Pre | 19.9 | −63 −45 36 | 20 | 0.006 |
|
| |||||
| “Salience” Network | |||||
|
| |||||
| Right IFG& Ins | Post > Pre | 12.98 | 48 27 0 | 23 | 0.09 |
|
| |||||
| Frontal RSN | |||||
|
| |||||
| Bilateral Anterior PFC Network | |||||
|
| |||||
| RH aPFC & SFG | Post > Pre | 10.41 | 27 48 36 | 54 | <0.001 |
| LH MFG | Post > Pre | 13.05 | −36 42 18 | 14 | 0.01 |
|
| |||||
| Sub-cortical RSNs | |||||
|
| |||||
| BG Network | |||||
|
| |||||
| RH Putamen (dorsal) | Post < Pre | 21.62 | 27 −9 −12 | 242 | <0.001 |
| LH Putamen (rostral) | Post < Pre | 18.17 | −21 0 −15 | 323 | <0.001 |
|
| |||||
| LH Cerebellum Network | |||||
|
| |||||
| LH Crus I | Post > Pre | 9.61 | −39 −81 −24 | 19 | 0.003 |
| LH Crus II | Post > Pre | 9.59 | −21 −90 −27 | 14 | 0.005 |
All Peak-level differences were thresholded using p<0.05 (FWE-corrected), unless noted otherwise.
Figure 2. Statistical parametric maps for the superior parietal lobule network.
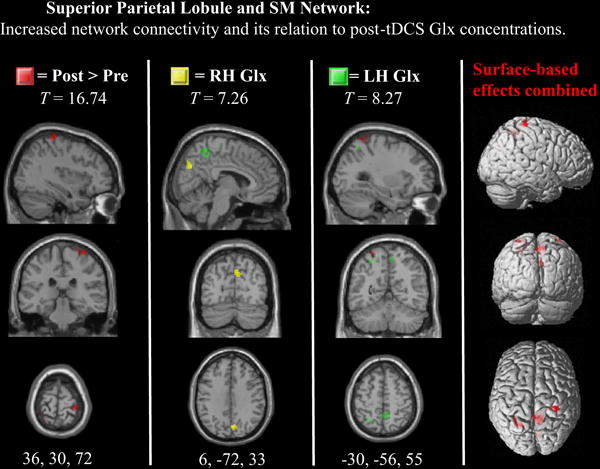
Differences after tDCS are displayed in red. Voxels exhibiting significant relationships with post-tDCS RH Glx measures are displayed in yellow and LH Glx measures in green (note the Glx relations in precuneus).
Figure 3. Statistical parametric maps for the anterior cingulate network.
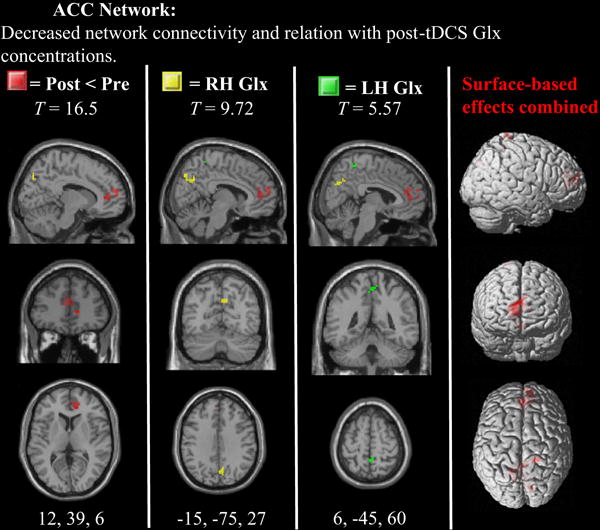
Statistically significant differences after tDCS are displayed in red. Voxels exhibiting significant relationships with post-tDCS RH Glx measures are displayed in yellow (note the Glx relations in precuneus).
Of the three distributed intrinsic networks, the left frontal-parietal network exhibited the largest increases in functional connectivity, specifically in the left inferior parietal lobe, extending to the upper division of lateral occipital cortex (see Table 1 and supplemental material Figure 1). For the “salience” network, increases in functional connectivity were observed in the right insula, extending to the IFG (see Table 1 and supplemental material Figure 2). No statistically significant differences were observed in the right frontal-parietal network; however, given the hypothesized increases in this network, SPMs for both pre- and post-tDCS voxel-wise functional connectivity are displayed in supplemental material Figure 3. Results show widespread, albeit sub-threshold differences, in the right IFG (p = 0.004, uncorrected) and right lateral posterior parietal cortex (p = 0.059, uncorrected).
For intrinsic networks comprised primarily of frontal regions, only the bilateral anterior PFC network displayed significantly increased functional connectivity after tDCS, specifically within left MFG and right anterior PFC and superior frontal gyrus. Both subcortical intrinsic networks displayed significant differences: the BG displayed the largest decreases, specifically in bilateral putamen. The left cerebellum network exhibited increases within Crus I and II (see Table 1).
2.5. Relationships Between Within-Network Functional Connectivity and Glx
2.5.1. Pre-tDCS Measures
All statistically significant relationships between Glx and voxel-wise functional connectivity are displayed in Table 2. As reported in studies by others, all relationships between Glx and functional connectivity were positive; that is, greater Glx predicted greater within-network functional connectivity. Within the MRS-mask in the salience network, right Glx predicted right SPL functional connectivity. No other significant relationships were observed in the pre-tDCS measures; however, given the previously observed relationships between glutamate and functional connectivity within the precuneus (Kapogiannis et al., 2013), we imposed an even less stringent significance threshold (p < 0.004, uncorrected) and found relationships between Glx and functional connectivity in the ipsilateral region of the precuneus network (p < 0.003, uncorrected)
Table 2.
Summary of relationships between left and right hemisphere Glx concentrations and “within” network functional connectivity.
| GLX and ICA-spatial Map Correlations: | PRE TDCS | POST TDCS | ||||||
|---|---|---|---|---|---|---|---|---|
|
| ||||||||
| Components of Interest: | t-score | Type of mask | Glx Hem | Peak Voxel | t-score | Type of mask | Glx Hem | Peak Voxel |
| Component Sub-regions | ||||||||
| Parietal RSNs (local tDCS) | ||||||||
|
| ||||||||
| Bilateral SPL Network | ||||||||
|
| ||||||||
| RH Precuneus | — | — | — | — | 7.26 | MRS | RH | 6 −72 33 |
| RH Precuneus | — | — | — | — | 20.62** | MRS | LH | 9 −45 51 |
| LH SPL | — | — | — | — | 8.27 | MRS | LH | −30 −57 54 |
|
| ||||||||
| Bilateral SPS Network | ||||||||
|
| ||||||||
| LH SPS | — | — | — | — | 10.27** | MRS | RH | −12 −42 60 |
|
| ||||||||
| DMN: | ||||||||
|
| ||||||||
| Precuneus Network | ||||||||
|
| ||||||||
| LH Precun | 4.73 (uc) | MRS | LH | −24 −60 63 | 8.64 | MRS | LH | −3 −72 39 |
| RH Precuneus | 3.92 (uc) | MRS | RH | 33 −48 63 | — | — | — | — |
|
| ||||||||
| ACC Network | ||||||||
|
| ||||||||
| LH Precuneus | — | — | — | — | 9.72 | MRS | RH | −15 −75 27 |
| RH Precuneus | — | — | — | — | 6.84 | MRS | RH | 9 −63 33 |
| RH Precuneus | — | — | — | — | 5.57 | MRS | LH | 6 −45 60 |
| RH medial frotnal gyrus | — | — | — | — | 5.75 | Network | RH | 12 45 24 |
|
| ||||||||
| Distributed RSNs: | ||||||||
|
| ||||||||
| Left Frontal-Parietal Network | ||||||||
|
| ||||||||
| LH Precuneus | — | — | — | — | 10.74** | MRS | LH | −9 −63 30 |
| RH Inferior Parieta | — | — | — | — | 6.08 | Network | RH | 48 −63 39 |
|
| ||||||||
| “Salience” Network | ||||||||
|
| ||||||||
| RH SPL | 9.6 | MRS | RH | 33 −51 69 | — | — | — | — |
| LH precuneus | — | — | — | — | 8.35** | MRS | RH | −24 −81 27 |
|
| ||||||||
| Frontal RSN: | ||||||||
|
| ||||||||
| Bilateral Superior Frontal Gyrus | ||||||||
|
| ||||||||
| RH SPL | — | — | — | — | 5.38 | MRS | RH | 18 −54 72 |
| RH Frontal eye-fields | — | — | — | — | 6.67** | Network | RH | 30 33 51 |
|
| ||||||||
| Subcortical RSNs: | ||||||||
|
| ||||||||
| BG Network | ||||||||
|
| ||||||||
| LH Precun | — | — | — | — | 12.16** | MRS | LH | 6 −72 42 |
All reported T-scores correspond to a p-value < 0.001, uncorrected
Corresponds to a T-score p<0.05 (voxel-wise FWE-corrected).
2.5.2. Post-tDCS measures
The strongest post-tDCS relationships were observed between left Glx and functional connectivity in the right precuneus within the bilateral SPL network (See Figure 2). Within the precuneus network, only left Glx predicted functional connectivity in the left precuneus (See Table 2). Within the ACC network, right Glx predicted functional connectivity in the right precuneus. Furthermore, when the network-mask was applied, right Glx predicted right medial frontal functional connectivity only (see Table 2 and Figure 3).
Significant relationships were observed between left Glx and inferior-parietal functional connectivity in the left frontal-parietal network (see Table 2). In addition, given the cluster of significant functional connectivity in the right parietal cortex within this network (k=241)—i.e., the targeted region of stimulation—an additional mask was computed from this cluster. A significant relationship was observed between right Glx and right inferior parietal functional connectivity in the left frontal-parietal network (see Table 2).
For the salience network, right Glx predicted left inferior parietal functional connectivity. Lastly, the BG network displayed the second largest effects, where left Glx predicted left precuneus functional connectivity within this network.
2.6. Paired T-Tests on FNC
Group means and SDs for the FNC pairs of interest are displayed in Table 3 (the full FNC map is displayed in supplementary material, Fig. 5). For the parietal networks, there was a significant increase in FNC between the left frontal-parietal and bilateral inferior parietal networks, as expected. For the networks that comprise the DMN, the FNC between the ACC and precuneus networks displayed the largest increase in FNC.
Table 3.
Summary statistics for paired-sample t-tests on selected FNC pairs and Pearson correlations between Glx and FNC before and after tDCS.
| FNC Pairs | Pre-tDCS | Post-tDCS | T-score | Pre Glx & FNC | Post Glx and FNC |
|---|---|---|---|---|---|
| Among Parietal nodes (local to anodal tDCS): | |||||
|
| |||||
| RH frontal-Parietal & Lh frontal-Parietal | 0.52 (0.28) | 0.56 (0.24) | 0.35 | 0.70* (LH) | — |
| RH frontal-Parietal & Precuneus | 0.24 (0.16) | 0.18 (0.40) | −0.46 | — | — |
| Lh frontal-Parietal & Bilateral SPS | −0.27 (0.28) | 0.02 (0.25) | 2.15* | — | — |
| Lh frontal-Parietal & Bilateral Inf. Parietal | 0.10 (0.39) | 0.29 (0.39) | 2.02* | — | — |
| Bilateral SPL & Precuneus | 0.29 (0.45) | 0.19 (0.43) | −0.72 | — | 0.76* (LH) |
| Bilateral SPL & Bilateral Inf. Parietal | 0.27 (0.28) | 0.19 (0.33) | −0.48 | — | — |
| Bilateral SPS & Precuneus | 0.40 (0.28) | 0.33 (0.29) | −0.47 | — | — |
| Bilateral SPS & Bilateral Inf. Parietal | 0.20 (0.34) | 0.42 (0.17) | 1.64 | — | — |
|
| |||||
| Nodes that comprise DMN: | |||||
|
| |||||
| ACC & PCC | 0.54 (0.21) | 0.51 (0.26) | 0.34 | — | — |
| ACC & Precuneus | −0.05 (0.28) | 0.30 (0.19) | 2.44* | — | — |
|
| |||||
| Nodes that comprise distributed networks: | |||||
|
| |||||
| Superior Frontal Gyrus & Bilateral SPL | 0.27 (0.33) | 0.04 (0.43) | −2.76* | — | 0.65* (LH) |
| Bilateral aPFC & Bilateral Inf. Parietal | −0.28 (0.30) | −0.15 (0.27) | 1.48 | — | 0.77* (LH) |
| Salience & ACC | −0.24 (0.32) | 0.07 (0.33) | 2.02* | — | 0.69* (RH) |
| Salience & BG | 0.23 (0.25) | 0.25 (0.25) | 0.15 | −0.84* (LH) | −0.74* (RH) |
|
| |||||
| Among cerebellum network: | |||||
|
| |||||
| Bilateral SPL | 0.53 (0.24) | 0.55 (0.19) | 0.23 | — | — |
| Bilateral Inf. Parietal | 0.14 (0.30) | 0.30 (0.25) | 1.65 | 0.66* (LH) | — |
| Bilateral SPS | 0.21 (0.37) | 0.31 (0.23) | 1.25 | — | — |
| Precuneus | 0.53 (0.37) | 0.72 (0.16) | 1.76* | 0.71* (LH) | — |
| PCC | 0.14 (0.25) | 0.30 (0.23) | 1.3 | — | — |
| LH frontal-Parietal | −0.06 (0.29) | 0.15 (0.33) | 2.01* | — | — |
| RH frontal-Parietal | 0.23 (0.25) | 0.35 (0.22) | 1.52 | 0.76* (LH) | — |
| BG | 0.34 (0.18) | 0.02 (0.52) | −1.75* | — | — |
All FNC pairs are displayed as Fisher Z.
p<0.05 (uc). LH, left hemisphere; RH, right hemisphere; Inf, inferior.
For FNC between nodes that comprise distributed networks, there was a decrease in FNC between the salience and ACC networks, from being significantly anti-correlated to zero-correlation after tDCS (see Table 3). For the FNC among subcortical networks and all other structurally connected brain regions, there was a significant increase in FNC between the cerebellum and the precuneus network, and between the cerebellum and the left frontalparietal network. There was also a decrease in FNC between the cerebellum and the BG network (see Table 3).
2.7. Relationships Between Glx and FNC
2.7.1. Post-tDCS Measures
All statistically significant correlations between Glx estimates and FNC are displayed in Table 3. The strongest post-tDCS Glx relationship was observed between left Glx and FNC between the bilateral SPL and precuneus networks. Left Glx was also correlated with FNC between bilateral inferior parietal and bilateral anterior PFC networks. Interestingly, right Glx was positively correlated with FNC between the salience and ACC networks, while it was negatively correlated with FNC between the salience and BG networks.
3. Discussion
By combining 1H-MRS and rs-fMRI, the present study investigated how tDCS interacts with different levels of the brain’s neural architecture. The observed after-effects of tDCS included increases in Glx in right parietal cortex, underneath the site of anodal stimulation, which predicted increases in network connectivity in the precuneus for several different networks. This may indicate that the precuneus acts as an intermediate node that modulates glutamatergic signaling in other pathways, including bilateral SPL, ACC, salience, left frontal-parietal, and BG networks. As discussed below, cross-hemispheric connectivity, specifically within the bilateral inferior parietal network, may be more readily influenced by inhibitory signaling pathways. While the majority of the results support our hypotheses, we also encountered additional, unexpected findings, discussed below in terms of their potential systems-level contributions to behavior, which may inform future hypotheses for the most optimal cortical targets for enhancing cognitive functions in healthy and clinical populations.
3.1. Hypothesized Increases in Parietal Network Connectivity
As expected, tDCS increased functional connectivity within the right hemisphere of the bilateral SPL network; however, the premotor location of this effect was somewhat unexpected. Anatomical studies have confirmed that most of the parietal afferent connections to the dorsal premotor cortex originate from SPL (see Wise et al., 1997 for review). It is therefore possible that parietal stimulation specifically increased the synchronization of these afferent signaling pathways from superior parietal to premotor cortices. This increase may translate to an enchantment of attention to visual processing and the execution of movements (Rushworth et al., 2001; Molenberghs et al., 2007; Moos et al., 2012).
With regard to the bilateral SPL network’s relation to glutamatergic activity, right and left Glx concentrations predicted increased functional connectivity in the right precuneus only. This relationship was the strongest in comparison to the other networks, which indicates that tDCS-induced alterations in glutamatergic signaling are localized within the area of stimulation, but also extends to nearby, structurally connected brain regions. The precuneus in particular is thought to be a central core in the cortical anatomical network (Powers et al., 2013), which exhibits heterogeneous functional connectivity with the default-mode, motor, visual, and attentional systems (White et al., 2010; Allen et al., 2011). Given that left Glx also predicted functional connectivity in the right precuneus and the left SPL, which exceeded the FWE-corrected threshold, it is possible that this brain structure acts as an intermediate node that modulates inter-hemispheric communication via micro-scale alterations in glutamatergic neurotransmission. Indeed, we also observed that only after tDCS, left Glx was positively correlated with the FNC between the bilateral SPL and precuneus network, further demonstrating that tDCS may influence the degree to which two networks communicate between each other via glutamatergic processing.
3.1.1. Increased Inter-Hemispheric Network Connectivity in the Parietal Lobe
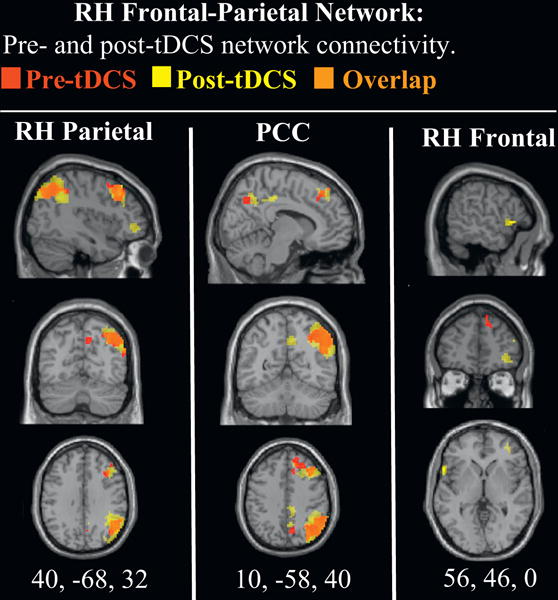
The present study found that anodal stimulation produced a redistribution of parietal inter-hemispheric functional connectivity. This is an important finding because tDCS-induced increases in inter-hemispheric functional connectivity are thought to be largely dependent on the contributions of the cathode electrode (Sehm et al., 2012; 2013; Park et al., 2013). In the present study, network connectivity was increased predominantly in the left lateral inferior parietal regions of the bilateral inferior parietal and the left frontal-parietal networks. The enhancement of functional connectivity in the left hemisphere by right hemisphere excitatory stimulation is consistent with the role of transcallosal excitation (Yazgan et al., 1995; see Bloom & Hynd, 2005 for review).
However, given that Glx did not predict functional connectivity within the bilateral inferior parietal network, the observed tDCS-induced increases in cross-hemispheric network connectivity may be more readily influenced by other neurotransmitter pathways, such as GABA. Inferior parietal structures are thought to have an inhibitory influence on one another through transcallosal fiber connections (Kinsbourne, 1993; Sparing et al., 2009). Thus, the current results for the bilateral inferior parietal network should be considered in line with the recent TMS and tDCS studies that targeted the inferior parietal lobe (e.g., Dambeck et al., 2006; Bologini et al., 2010; Moos et al., 2012), which were all in support of the inhibitory hemispheric rivalry hypothesis (Kinsbourne, 1993). In this view, the two hemispheres have a mutual, reciprocal inhibitory influence on one another. It predicts that stimulation over the parietal cortex should result in trans-hemispheric release of inhibition to the contralateral hemisphere that will in turn result in hyperactivity in the ipsilateral hemisphere (see Fecteau et al., 2006 for review). Thus, during stimulation, the right hemisphere would exert more of an inhibitory influence on the left via GABAergic signaling. Indeed, it has been found that inhibitory network oscillations occur in response to the activation of metabotropic glutamate receptors, which may have implications on large-scale functional connectivity and ultimately cognition (Whittington et al., 1995). For the present study, however, it remains unclear which micro-scale signaling pathways drove the enhancement of within- and between-network connectivity between the bilateral inferior parietal and left frontal-parietal networks. Given that V1 BOLD signal variations have been linked to baseline GABA levels (Donahue et al., 2007), further research is needed address any involvement of GABAergic signaling pathways that may influence network connectivity between inferior parietal networks.
3.2. Expected Decreases Within Nodes of the DMN
As expected, tDCS produced a significant decrease in functional connectivity within the ACC network, which was specifically observed in the right medial frontal gyrus. This finding is consistent with the general hypothesis that tDCS may enhance the flexible balance between putative functional brain networks by suppressing functional connectivity within the DMN. In addition, bilateral Glx concentrations predicted bilateral precuneus and right medial frontal gyrus functional connectivity within the ACC network, which highlights the potential role of glutamatergic signaling in decreasing functional connectivity in more distant brain regions (Enzi et al., 2012). To this end, we also observed that the FNC between the ACC and precuneus was significantly increased after tDCS. This finding is of interest given the concurrent decrease in ACC functional connectivity, which suggests that parietal stimulation may reduce attention directed to the ACC (e.g., internal visceral signals), while enhancing more attentive (tonic monitoring) states with the environment via enhanced communication with precuneus network (Lin et al., 2011; Vogt and Derbyshire, 2009).
3.3. Expected Increases in the Distributed Salience Network
Prior to the administration of tDCS, there was a statistically significant relationship between right Glx and right SPL functional connectivity within the salience network. This association is consistent with the hypothesis that tonic excitatory neurotransmission is necessary in order to readily engage other networks when attending to stimuli (Eichler et al., 2008). This is indeed consistent with salience network’s active role in switching between the default-mode and task-related states of brain connectivity (Seeley et al., 2007; Menon and Uddin, 2010; Bonnelle et al., 2012; Ham et al., 2013).
After anodal stimulation, increased functional connectivity in the right insula extending contiguously to IFG were also observed. Together, the increased functional connectivity in the right insula and IFG may establish an enhancement of the casual outflow from the right insula and IFG to other nodes that anchor the salience network for further attentional engagement. Across stimulus modalities, the right anterior insula plays a causal role in enabling the recruitment of contextually relevant brain regions (Sridharan et al. 2008)—thereby activating task-related networks and deactivating the DMN. Thus, by enhancing the network activity within right anterior insula and IFG, parietal stimulation may improve cognitive performance by enhancing the initial phase of information processing, specifically as it relates to integrating external stimuli with internal homeostatic context (Seeley et al., 2007; Singer et al., 2009; Menon and Uddin, 2010; Seth et al., 2011).
3.3.1 Increased Functional Connectivity in Frontal Networks
Functional connectivity was significantly increased after tDCS within the bilateral anterior PFC network, specifically in right BA10. This brain region is consistently engaged when subjects are instructed to learn new behavioral routines (Koechlin et al., 2002; Strange et al., 2001) and when the amount of uncertainty (i.e., entropy) is increased in regard to multiple options that subjects are simultaneously tracking (Yoshida & Ishii, 2006). After tDCS, the FNC between this network and the bilateral inferior parietal network was significantly correlated with left Glx concentrations. Taken together, tDCS may contribute to learning as it relates to maintaining and switching back and forth between multiple behavioral alternatives in search of optimal behavior (Koechlin et al., 2002; Yoshida & Ishii, 2006; Andersson et al., 2009). However, this hypothesis has to be investigated in the context of problem-solving before and after tDCS.
3.4. Expected Decreases in the Basal Ganglia
Anodal tDCS decreased functional connectivity in bilateral putamen. This finding is consistent with the previously observed intrinsic connectivity between the putamen and parietal cortex (Martino et al., 2008; Cao et al., 2009). To this end, given that the putamen consists primarily of spiny neurons which receive direct input from glutamatergic signaling, tDCS may also influence the inhibitory medium spiny neurons in this brain structure (Garcia et al., 2010; Girault, 2012). However, the putamen and the cortex have no monosynaptic anatomical connections, and so further research is needed to identify the mediating structures and signaling pathways by which tDCS operates.
Furthermore, it has been previously shown that anodal tDCS over M1 (cathode contralateral frontopolar region) resulted in a reduction in functional connectivity between the left caudate nucleus and the PCC node of the DMN (Polania et al., 2012). The authors suggested that this reduction, or “switch” in activation patterns, was due to the motor-related loop being activated by tDCS. To this end, given the Glx relationships with FNC between the BG and salience networks, further research is needed to test the extent that these two networks engage and disengage one another and whether a “switch” in hemispheric reactivity influences hierarchical attention-processing.
3.5. Exploratory Analysis of the Cerebellum
The cerebellum plays an important role in the planning, initiation, stability, organization, and long-term memory of movements (Schmahmann, 1998; Imamizu et al., 2000; Schmahmann et al., 2006; Miall et al., 2007). Parietal stimulation increased network connectivity in left Crus 1 and 2, with no observed relationships with Glx. In a previous rs-fMRI study, the human cerebellum was analyzed using both lobular anatomically-driven and self-organizing map-driven approaches (Bernard et al., 2012). This study found that subdivisions of Crus I and II were correlated with distinct regions of prefrontal, temporal and parietal cortices; furthermore, subdivisions of Crus I contained multiple smaller functional clusters that may reflect the heterogeneity of cognitive processing. Thus, it may be the case that tDCS over the parietal lobe enhanced intra-cerebellar processing, which may further enhance local processing of information related to cognition.
Moreover, the FNC between the cerebellum and precuneus and FNC between the cerebellum and left frontal-parietal networks were all significantly increased after stimulation. Given that there are no monosynaptic connections between the cerebrum and cerebellum (Buckner et al., 2011), the current FNC results provide further evidence for the cerebellum’s indirect influence on intrinsically coupled cerebral association areas, such as the parietal cortex (Habas et al. 2009; O’Reilly et al. 2010). Furthermore, given that the cerebellum exerts an overall inhibitory tone over the cortex during rest—specifically with M1 (Galea et al., 2009), the observed increases in FNC might result from a complex relationship between GABAergic and glutamatergic signaling.
Stimulation also resulted in a significant decrease in FNC between the BG and cerebellum networks. The BG and cerebellum are thought to form multi-synaptic loops with the cerebral cortex (Haber, 2003; Bostan et al., 2010), with the anterior parietal regions playing an integrative role that mediates activity to and from the BG and to the frontal lobe. Clower et al. (2005) demonstrated that the anterior inferior parietal cortex (in the cebus monkey) is the target of both cerebellar and BG output. Thus, from a computational perspective, the BG and cerebellum have been viewed as segregated modules that implement different learning algorithms, with the BG supporting reinforcement learning and the cerebellum supporting supervised learning (Doya et al., 2001; Houk, 2005).
3.6. Clinical Applications and Further Considerations
Understanding the mechanisms by which micro and macro changes occur after tDCS could help to increase its effectiveness in altering neuroplastic mechanisms in order promote healing and recovery (Peled, 2004; 2005; Spedding et al., 2003; Kays et al., 2012; Kuo et al., 2013). For instance, increasing both the glutamatergic neurotransmission and functional connectivity that is otherwise impaired in schizophrenia (Friston, 1998; Stephan et al., 2006; Williamson and Allman, 2012; Szulc et al., 2013), could lead to effective therapies that combine the synergistic effects of cognitive training, psychopharmacology and stimulation protocols. However, medication and other factors should always be taken into consideration when tailoring stimulation protocols for clinical populations, as the present results may differ as a nonlinear function of dose.
Accordingly, there is a similar issue of nonlinearity with duration of stimulation and homeostatic plasticity. That is, the effects of tDCS on neuroplasticity depends upon the recent history of tDCS-induced excitation, such that repeated stimulation (with short intervals) has resulted in a reversal of excitability (Fricke et al., 2011), similarly for increasing intensity from 1mA to 2mA (Batsikadze et al., 2013). More specifically, Batsikadze et al. (2013) found that compared to 1mA anodal stimulation over motor cortex for 20 minutes, 2mA induced aftereffects with a delay, which may have occurred from several reasons, including a transient homeostatic counter-regulation, alterations of intracellular calcium, and/or that deeper cortical layers were affected by 2mA but not 1 mA current. Thus, the observed results with increased functional connectivity in the opposite hemisphere of stimulation may have been a result of this time-dependent homeostatic balance governing the response to tDCS, which should be considered if a particular clinical population is already exhibiting preexisting (baseline) perturbations in the underlying cortex.
3.7. Limitations
As mentioned above, a limiting factor of the current study is its inability to track the real time influence of tDCS on glutamatergic signaling on large-scale functional connectivity. Future studies are needed to assess the extent that the intrinsic inter-hemispheric balance is maintained during cortical polarization. Identifying any differences in this timing may be necessary to reveal the optimal strengthening of the synaptic efficacy resulting in observable changes in both microlevel signaling and network-level interactions.
Another limitation is that the 1H-MRS sequence did not measure GABA concentrations. Future studies are needed to test whether there are a differential relationships between Glx and GABA across different partitions of the inferior parietal, BG, ACC and cerebellum networks. Another potential limitation is the small sample size, which may have reduced statistical power of finding other differences or relationships in the current sample.
Although there was no sham tDCS group to compare the results with, the within-subjects design of our study effectively categorized the “comparison” group as the same participant’s baseline scan, which can be a more sensitive and powerful design in capturing and accounting for important individual differences in network fluctuations. Moreover, previous rs-fMRI studies have shown that sham tDCS does not have a significant effect on large-scale intrinsic network dynamics (Peña-Gómez et al., 2012; Park et al., 2013). In addition, future studies should include several types of cognitive tasks to probe the functional relevance of the present findings. Lastly, given the many different parameters that impact the effects of tDCS (e.g., electrode position, size, duration, intensity, and others), future studies are needed to compare the present results with other stimulation protocols.
3.8. Conclusions
The present study provides evidence that the “excitatory” after-effects of anodal tDCS on glutamatergic signaling and network connectivity contribute to local, cross-hemispheric and subcortical alterations. The observed after-effects of tDCS include increases in glutamatergic signaling that originate from the parietal site of stimulation, with the precuneus possibly acting as an intermediate node that modulates glutamatergic signaling in other pathways that include bilateral SPL, ACC, salience, left frontal-parietal, and BG networks. Cross-hemispheric connectivity, specifically for the bilateral inferior parietal network, may be more readily influenced by inhibitory signaling pathways. Overall, the importance of investigating potential interactions across these levels of analyses could inform future hypotheses for the most optimal cortical targets for healthy and clinical populations.
4. Experimental procedure
4.1 Participants
Data from the 11 right-handed volunteers reported in Clark et al. (2011) were included in the present study. However, two participants were excluded due to missing post-tDCS rs-fMRI data. Data from the remaining 9 subjects (mean age = 22, SD = 3 years old; 6 Female) were analyzed. All participants reported English as their primary language, with no history of head injuries or concussions, current or previous history of mental, neurological, alcohol or drug abuse disorders, current prescription medication affecting CNS function, or hearing/visual impairments. Subjects were also excluded for metal implants, claustrophobia and pregnancy, as these are contraindications for MRI.
4.2. Procedure and tDCS Administration
After screening and consent, pre-tDCS 1H-MRS and rs-fMRI scans were obtained, which lasted a total of 2.1 hours on average. Immediately after, participants were removed from the scanner and tDCS was applied for 30 minutes while participants sat in a sound-attenuated room. An Iomed Phoresor PM850 was connected to square-shaped, 11 cm2, saline-soaked sponge electrodes. The anode was placed over 10–20 electrode site P4, with a current of 2.0 mA delivered for 30 minutes. The cathode was placed over the contralateral upper arm. To better control for activation state of the brain (Silvanto et al., 2008), participants were asked to rest with their eyes open through stimulation. This ensured the detection of tDCS-induced neuroplastic changes by removing any possible “spill over” effects related to performing a cognitive task (Clemens et al., 2014). In order to reduce the length of our experimental procedure, no sham condition was used; moreover, other rs-fMRI studies have shown that sham tDCS does not have a significant effect on large-scale intrinsic network dynamics (Peña-Gómez et al., 2012; Park et al., 2013).
Within 5–10 minutes after tDCS, post-tDCS 1H-MRS and rs-fMRI scans were obtained, with the 1H-MRS collected at the same voxel locations (left and right) as the pre-tDCS voxel placements. The same 1H-MRS and rs-fMRI parameters were used for both pre- and post-tDCS sequences.
4.3. 1H-MRS Data Collection & Preprocessing
The same 1H-MRS data and analysis previously reported in Clark et al., 2011 were used here for a subset of subjects that also received rs-fMRI testing. All fMRI and MRS scans were obtained on a 3 T Siemens TIM Trio MRI system with a 12-channel radiofrequency head coil. All parameter details for the 1H-MRS sequence can found in Clark et al., 2011. In summary, A PRESS (point-resolved spectroscopy) sequence was collected (TR/TE = 1.5 s/40 ms, voxel size = 20 mm × 20 mm × 20 mm, averages = 192), with an unsuppressed water signal used as a concentration reference and eddy current correction in post-processing. 1H-MRS spectra were analyzed using LCModel (Provencher et al., 2001). Metabolite concentrations were estimated as previously reported (Gasparovic et al., 2009). Only Glx estimates with a Cramer–Rao lower bound. Glx estimates from two participants that did not meet this criterion. However, in order to include these subjects in further analyses, these 2 data points were interpolated using SPSS 21 (IBM SPSS Statistics for Windows, Armonk, NY: IBM Corp.), where missing values were replaced with the mean of their designated group (i.e., from right pre- or left post-measures).
4.4. fMRI Data Collection & Processing
High-resolution T2*-weighted functional images were acquired using a gradient-echo EPI sequence with TE=29ms, TR=2s, flip angle=75°, slice thickness=3.5mm. Resting-state scans were five minutes in duration, and participants were instructed to keep their eyes open, relax and attend to a cross hair on the center of the screen.
Preprocessing was completed using SPM 5 (Wellcome Department of Imaging Neuroscience, London, UK. http//www.fil.ion.ucl.ac.uk/spm), within MATLAB (Mathworks Inc., Sherbon MA). The first three EPI volumes were discarded to remove T1 equilibration effects. Realignment was then completed using INRIalign and slice-timing correction was applied, with the middle slice used as the reference frame. Data were then spatially normalized into the standard Montreal Neurological Institute (MNI) space, resliced to 3 mm × 3 mm × 3 mm voxels, and smoothed using a Gaussian kernel with a full-width at half-maximum of 10 mm. No subjects were excluded due to excessive head motion, defined as more than 3.125 mm of translation in any plane or more than 5 degrees of rotation in any plane (Gusnard et al., 2001). Pre- and post-tDCS measures did not significantly differ in any of the six head position parameters assessed here (i.e., translational displacements along X, Y, and Z axes and rotational displacements of pitch, yaw, and roll; all p’s > 0.40).
4.4.1. Network Identification
Please see Supplementary Information for details regarding the exclusion of networks not of interest. In summary, 63/75 components were excluded, and the remaining 12 components were included in all further analysis based off their anatomical regions that comprise each network and are described in detail in the results section.
To ensure that the topological false-discovery rate (FDR) procedures based on both spatial extent and peak values were utilized (Chumbley et al., 2009; Chumbly et al., 2010), all spatial comparisons on ICA-derived statistical parametric maps (i.e., output images from GIFT) were conducted in SPM 8. First, to test the significance of individual component voxel-wise functional connectivity (difference from zero) for both pre- and post-tDCS fMRI measurements, one-sample t-tests were computed at each voxel across all subjects and sessions. The resulting significant clusters within each component (FDR-corrected, p < 0.01) were then saved as a spatial mask to limit the number of voxel-wise comparisons in subsequent analyses.
4.5. Comparing Within-Network Functional Connectivity
To assess whether the voxel-wise functional connectivity was altered after tDCS, paired-sample t-tests were computed on each voxel within component spatial maps. Head motion (Euclidian linear translation) was included as the only covariate. Model parameters were estimated based on restricted maximum likelihoods, which is the classical estimation method used in SPM. Pair-wise differences are reported only for effects that exceed FDR-correction (p < 0.05), with a cluster voxel extent threshold of k > 10.
4.6. Assessing Relationships Between Voxel-Wise Functional Connectivity and Glx Concentrations
To examine the linear relationships between Glx and the functional connectivity within components before and after tDCS, second-level multiple regression analyses were performed within SPM 8. Each subject’s spatial maps were entered as dependent variables, separately for pre- and post-tDCS measures, and right and left Glx levels were entered as the predictor variables. As 1H-MRS voxels were obtained within the right SPS, this analysis was initially conducted only on those voxels within this region, but also included inferior parietal and precuneus (BA7) cortices—given the close proximity with the 1H-MRS voxel, herein labeled as the MRS-mask (See supplementary material, Fig4). If significant relationships were observed within this MRS-mask, a second, extended regression analysis was performed including all significant voxels within that network, herein labeled the network-mask. Results are reported only for effects that exceed peak-voxel threshold of p < 0.05 (FWE-corrected). However, given previous glutamate and ICA-generated functional connectivity relationships were observed with moderate effects (Kapogiannis et al, 2013: t ≤ 3.40, p ≥ 0.004), we also assessed relationships significant at p < 0.001 (uncorrected) in order to capture similar relationships as previous studies that may still be informative for future research.
4.7. Comparing FNC Among Specific Network Pairs and Their Relation to Glx
To compute the relationship between the network activation time courses of each of the 14 components, a constrained-lag correlation was performed within the FNC toolbox v.2.3 (Jafri et al, 2008; http://mialab.mrn.org/software/fnctb/). First, a band-pass filter was applied (0.012 Hz and 0.12 Hz), and the maximum lag interval was constrained to ± 4s (to remove the impact of lag differences on the correlation results). Thereafter, a Fisher’s z transformation was applied on all pair-wise FNC correlations. Pair-wise t-tests were then computed on FNC for component-pairs of interests. Furthermore, using a one-sample t-test (α = 0.05), all further analyses were conducted only on network pairs that resulted in significant FNC in either the pre- or post-tDCS measures. To examine the relationship between Glx and FNC for component pairs of interest, Pearson correlations were computed separately for pre- and post-tDCS measures, and for left-and right-hemisphere Glx.
Supplementary Material
Figure 4.
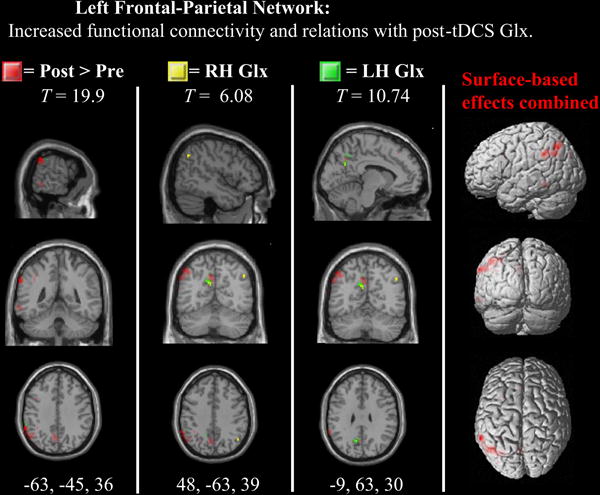
Figure 5.
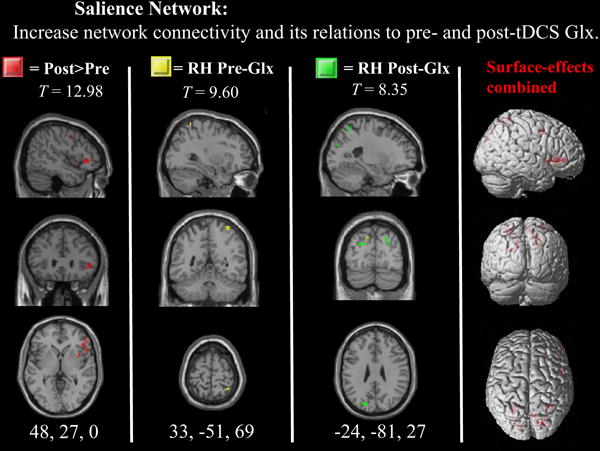
Figure 6.
Highlights.
1H-MRS and rs-fMRI were acquired before and after right parietal tDCS
Anodal stimulation produced increased Glx in the right hemisphere only
Increased connectivity was observed in parietal, “salience” and cerebellar networks
Decreased connectivity was observed in anterior cingulate and basal ganglia networks
The relationship between Glx and connectivity can be used to guide future tDCS studies
Acknowledgments
This work was supported by the Department of Energy (Government contract DE-FG02-99ER62764) and Office of Director of National Intelligence (2014-131270006) awarded to Dr. Vincent Clark, the National Institute of Mental Health, NIH (R21MH097201) awarded to Dr. Vince Calhoun, and the National Academies Ford Pre-Doctoral Fellowship and the National Science Foundation Graduate Research Fellowship Program (DGE-0903444) awarded to Michael A. Hunter and by R21MH097201 awarded to Dr. Terran Lane.
The authors would like to thank the participants who enrolled into this study and to the MRI technicians, Diana South, George Malloy and Catherine Smith for their help with data collection and thanks to many others for their support that made this study possible.
Footnotes
Publisher's Disclaimer: This is a PDF file of an unedited manuscript that has been accepted for publication. As a service to our customers we are providing this early version of the manuscript. The manuscript will undergo copyediting, typesetting, and review of the resulting proof before it is published in its final citable form. Please note that during the production process errors may be discovered which could affect the content, and all legal disclaimers that apply to the journal pertain.
Financial Disclosure: All authors have no conflicts of interest to report.
References
- Allen EA, Erhardt EB, Damaraju E, Gruner WG, Segall JM, Silva RF, Calhoun VD. A Baseline for the Multivariate Comparison of Intrinsic Networks. Front Syst Neurosci. 2011;5(2):1–23. doi: 10.3389/fnsys.2011.00002. [DOI] [PMC free article] [PubMed] [Google Scholar]
- Amadi U, Ilie A, Johansen-Berg H, Stagg CJ. Polarity-specific effects of motor transcranial direct current stimulation on fMRI resting state networks. NeuroImage. 2014;88:155–161. doi: 10.1016/j.neuroimage.2013.11.037. [DOI] [PMC free article] [PubMed] [Google Scholar]
- Andersson M, Ystad M, Lundervold A, Lundervold AJ. Correlations between measures of executive attention and cortical thickness of left posterior middle frontal gyrus – a dichotic listening study. Behavioral and Brain Functions. 2009;5(1):41. doi: 10.1186/1744-9081-5-41. [DOI] [PMC free article] [PubMed] [Google Scholar]
- Corbetta M, Akbudak E, Conturo TE, Snyder AZ, Ollinger JM, Drury HA, Shulman GL. A Common Network of Functional Areas for Attention and Eye Movements. Neuron. 1998;21(4):761–773. doi: 10.1016/s0896-6273(00)80593-0. [DOI] [PubMed] [Google Scholar]
- Batsikadze G, Moliadze V, Paulus W, Kuo MF, Nitsche MA. Partially non-linear stimulation intensity-dependent effects of direct current stimulation on motor cortex excitability in humans. The Journal of Physiology. 2013;591(Pt 7):1987–2000. doi: 10.1113/jphysiol.2012.249730. [DOI] [PMC free article] [PubMed] [Google Scholar]
- Beckmann CF, DeLuca M, Devlin JT, Smith SM. Investigations into resting-state connectivity using independent component analysis. Philosophical Transactions of the Royal Society B: Biological Sciences. 2005;360(1457):1001–1013. doi: 10.1098/rstb.2005.1634. [DOI] [PMC free article] [PubMed] [Google Scholar]
- Bell AJ, Sejnowski TJ. An information-maximization approach to blind separation and blind deconvolution. Neural Computation. 1995;7(6):1129–1159. doi: 10.1162/neco.1995.7.6.1129. [DOI] [PubMed] [Google Scholar]
- Bernard JA, Seidler RD, Hassevoort KM, Benson BL, Welsh RC, Wiggins JL, Peltier SJ. Resting state cortico-cerebellar functional connectivity networks: a comparison of anatomical and self-organizing map approaches. Frontiers in Neuroanatomy. 2012;6:31. doi: 10.3389/fnana.2012.00031. [DOI] [PMC free article] [PubMed] [Google Scholar]
- Biswal B, Zerrin Yetkin F, Haughton VM, Hyde JS. Functional connectivity in the motor cortex of resting human brain using echo-planar MRI. Magnetic resonance in medicine. 1995;34(4):537–541. doi: 10.1002/mrm.1910340409. [DOI] [PubMed] [Google Scholar]
- Bliss TV, Collingridge GL. A synaptic model of memory: long-term potentiation in the hippocampus. Nature. 1993;361(6407):31–39. doi: 10.1038/361031a0. [DOI] [PubMed] [Google Scholar]
- Bloom JS, Hynd GW. The role of the corpus callosum in interhemispheric transfer of information: excitation or inhibition? Neuropsychology Review. 2005;15(2):59–71. doi: 10.1007/s11065-005-6252-y. [DOI] [PubMed] [Google Scholar]
- Bolognini N, Olgiati E, Rossetti A, Maravita A. Enhancing multisensory spatial orienting by brain polarization of the parietal cortex. The European Journal of Neuroscience. 2010 doi: 10.1111/j.1460-9568.2010.07211.x. [DOI] [PubMed] [Google Scholar]
- Bonnelle V, Ham TE, Leech R, Kinnunen KM, Mehta MA, Greenwood RJ, Sharp DJ. Salience network integrity predicts default mode network function after traumatic brain injury. Proceedings of the National Academy of Sciences. 2012:201113455. doi: 10.1073/pnas.1113455109. [DOI] [PMC free article] [PubMed] [Google Scholar]
- Bonvento G, Sibson N, Pellerin L. Does glutamate image your thoughts? Trends in neurosciences. 2002;25(7):359–364. doi: 10.1016/s0166-2236(02)02168-9. [DOI] [PubMed] [Google Scholar]
- Bostan AC, Dum RP, Strick PL. The basal ganglia communicate with the cerebellum. Proceedings of the National Academy of Sciences. 2010;107(18):8452–8456. doi: 10.1073/pnas.1000496107. [DOI] [PMC free article] [PubMed] [Google Scholar]
- Buckner RL, Krienen FM, Castellanos A, Diaz JC, Yeo BTT. The organization of the human cerebellum estimated by intrinsic functional connectivity. Journal of Neurophysiology. 2011;106(5):2322–2345. doi: 10.1152/jn.00339.2011. [DOI] [PMC free article] [PubMed] [Google Scholar]
- Calhoun VD, Adalí T. Multisubject independent component analysis of fMRI: a decade of intrinsic networks, default mode, and neurodiagnostic discovery. IEEE Reviews in Biomedical Engineering. 2012;5:60–73. doi: 10.1109/RBME.2012.2211076. [DOI] [PMC free article] [PubMed] [Google Scholar]
- Calhoun VD, Adali T, Pearlson GD, Pekar JJ. A method for making group inferences from functional MRI data using independent component analysis. Human brain mapping. 2001;14(3):140–151. doi: 10.1002/hbm.1048. [DOI] [PMC free article] [PubMed] [Google Scholar]
- Calhoun VD, Sui J, Kiehl K, Turner J, Allen E, Pearlson G. Exploring the Psychosis Functional Connectome: Aberrant Intrinsic Networks in Schizophrenia and Bipolar Disorder. Frontiers in Psychiatry. 2011;2(75):1–13. doi: 10.3389/fpsyt.2011.00075. [DOI] [PMC free article] [PubMed] [Google Scholar]
- Cao X, Cao Q, Long X, Sun L, Sui M, Zhu C, Wang Y. Abnormal resting-state functional connectivity patterns of the putamen in medication-naïve children with attention deficit hyperactivity disorder. Brain Research. 2009;1303:195–206. doi: 10.1016/j.brainres.2009.08.029. [DOI] [PubMed] [Google Scholar]
- Choi EY, Yeo BTT, Buckner RL. The organization of the human striatum estimated by intrinsic functional connectivity. Journal of Neurophysiology. 2012;108(8):2242–2263. doi: 10.1152/jn.00270.2012. [DOI] [PMC free article] [PubMed] [Google Scholar]
- Chumbley J, Worsley K, Flandin G, Friston K. Topological FDR for Neuroimaging. NeuroImage. 2010;49(4):3057–3064. doi: 10.1016/j.neuroimage.2009.10.090. [DOI] [PMC free article] [PubMed] [Google Scholar]
- Chumbley Justin R, Friston Karl J. False Discovery Rate Revisited: FDR and Topological Inference Using Gaussian Random Fields. NeuroImage. 2009;44(1):62–70. doi: 10.1016/j.neuroimage.2008.05.021. [DOI] [PubMed] [Google Scholar]
- Clark VP, Coffman BA, Mayer AR, Weisend MP, Lane TDR, Calhoun VD, Wassermann EM. TDCS Guided using fMRI Significantly Accelerates Learning to Identify Concealed Objects. Neuroimage. 2012;59(1):117–128. doi: 10.1016/j.neuroimage.2010.11.036. [DOI] [PMC free article] [PubMed] [Google Scholar]
- Clark VP, Coffman BA, Trumbo MC, Gasparovic C. Transcranial direct current stimulation (tDCS) produces localized and specific alterations in neurochemistry: A 1H magnetic resonance spectroscopy study. Neuroscience Letters. 2011;500(1):67–71. doi: 10.1016/j.neulet.2011.05.244. [DOI] [PubMed] [Google Scholar]
- Clemens B, Jung S, Mingoia G, Weyer D, Domahs F, Willmes K. Influence of Anodal Transcranial Direct Current Stimulation (tDCS) over the Right Angular Gyrus on Brain Activity during Rest. PLoS ONE. 2014;9(4):e95984. doi: 10.1371/journal.pone.0095984. [DOI] [PMC free article] [PubMed] [Google Scholar]
- Clower DM, Dum RP, Strick PL. Basal Ganglia and Cerebellar Inputs to “AIP”. Cerebral Cortex. 2005;15(7):913–920. doi: 10.1093/cercor/bhh190. [DOI] [PubMed] [Google Scholar]
- Corbetta M, Patel G, Shulman GL. The Reorienting System of the Human Brain: From Environment to Theory of Mind. Neuron. 2008;58(3):306–324. doi: 10.1016/j.neuron.2008.04.017. [DOI] [PMC free article] [PubMed] [Google Scholar]
- Dambeck RS. Interhemispheric imbalance during visuospatial attention investigated by unilateral and bilateral TMS over human parietal cortices. Brain Research. 2006;1072(1):194–9. doi: 10.1016/j.brainres.2005.05.075. [DOI] [PubMed] [Google Scholar]
- Dieckhöfer A, et al. Transcranial direct current stimulation applied over the somatosensory cortex: Differential effect on low and high frequency SEPs. Clin Neurophysiol. 2006;117:2221–2227. doi: 10.1016/j.clinph.2006.07.136. [DOI] [PubMed] [Google Scholar]
- Donahue MJ, Near J, Blicher JU, Jezzard P. Baseline GABA concentration and fMRI response. NeuroImage. 2010;53(2):392–398. doi: 10.1016/j.neuroimage.2010.07.017. [DOI] [PubMed] [Google Scholar]
- Doya K. What are the computations of the cerebellum, the basal ganglia and the cerebral cortex? Neural Networks. 1999;12(7–8):961–974. doi: 10.1016/s0893-6080(99)00046-5. [DOI] [PubMed] [Google Scholar]
- Duncan NW, Enzi B, Wiebking C, Northoff G. Involvement of glutamate in rest-stimulus interaction between perigenual and supragenual anterior cingulate cortex: a combined fMRI-MRS study. Human Brain Mapping. 2011;32(12):2172–2182. doi: 10.1002/hbm.21179. [DOI] [PMC free article] [PubMed] [Google Scholar]
- Eichler SA, Meier JC. E-I balance and human diseases – from molecules to networking. Frontiers in Molecular Neuroscience. 2008;1:2. doi: 10.3389/neuro.02.002.2008. [DOI] [PMC free article] [PubMed] [Google Scholar]
- Enzi B, Duncan NW, Kaufmann J, Tempelmann C, Wiebking C, Northoff G. Glutamate modulates resting state activity in the perigenual anterior cingulate cortex – A combined fMRI–MRS study. Neuroscience. 2012;227:102–109. doi: 10.1016/j.neuroscience.2012.09.039. [DOI] [PubMed] [Google Scholar]
- Erhardt EB, Allen EA, Damaraju E, Calhoun VD. On Network Derivation, Classification, and Visualization: A Response to Habeck and Moeller. Brain Connectivity. 2011;1(2):105–110. doi: 10.1089/brain.2011.0022. [DOI] [PMC free article] [PubMed] [Google Scholar]
- Falkenberg LE, Westerhausen R, Specht K, Hugdahl K. Resting-state glutamate level in the anterior cingulate predicts blood-oxygen level-dependent response to cognitive control. Proceedings of the National Academy of Sciences. 2012:201115628. doi: 10.1073/pnas.1115628109. [DOI] [PMC free article] [PubMed] [Google Scholar]
- Fecteau S, Pascual-Leone A, Oret H. Paradoxical Facilitation of Attention in Healthy Humans. Behavioural Neurology. 2006;17(3–4):159–162. doi: 10.1155/2006/632141. [DOI] [PMC free article] [PubMed] [Google Scholar]
- Fox MD, Raichle ME. Spontaneous fluctuations in brain activity observed with functional magnetic resonance imaging. Nature Reviews Neuroscience. 2007;8(9):700–711. doi: 10.1038/nrn2201. [DOI] [PubMed] [Google Scholar]
- Fricke K, Seeber AA, Thirugnanasambandam N, Paulus W, Nitsche MA, Rothwell JC. Time course of the induction of homeostatic plasticity generated by repeated transcranial direct current stimulation of the human motor cortex. Journal of Neurophysiology. 2011;105(3):1141–1149. doi: 10.1152/jn.00608.2009. [DOI] [PubMed] [Google Scholar]
- Friston KJ. The disconnection hypothesis. Schizophrenia Research. 1998;30(2):115–125. doi: 10.1016/s0920-9964(97)00140-0. [DOI] [PubMed] [Google Scholar]
- Galea JM, Jayaram G, Ajagbe L, Celnik P. Modulation of cerebellar excitability by polarity-specific non-invasive direct current stimulation. The Journal of Neuroscience: The Official Journal of the Society for Neuroscience. 2009;29(28):9115–9122. doi: 10.1523/JNEUROSCI.2184-09.2009. [DOI] [PMC free article] [PubMed] [Google Scholar]
- Garcia BG, Neely MD, Deutch AY. Cortical regulation of striatal medium spiny neuron dendritic remodeling in parkinsonism: modulation of glutamate release reverses dopamine depletion-induced dendritic spine loss. Cerebral Cortex (New York, NY: 1991) 2010;20(10):2423–2432. doi: 10.1093/cercor/bhp317. [DOI] [PMC free article] [PubMed] [Google Scholar]
- Gasparovic C, Yeo R, Mannell M, Ling J, Elgie R, Phillips J, Mayer AR. Neurometabolite concentrations in gray and white matter in mild traumatic brain injury: an 1H-magnetic resonance spectroscopy study. Journal of Neurotrauma. 2009;26(10):1635–1643. doi: 10.1089/neu.2009.0896. [DOI] [PMC free article] [PubMed] [Google Scholar]
- Girault JA. Integrating neurotransmission in striatal medium spiny neurons. Advances in Experimental Medicine and Biology. 2012;970:407–429. doi: 10.1007/978-3-7091-0932-8_18. [DOI] [PubMed] [Google Scholar]
- Goldberg II, Harel M, Malach R. When the brain loses its self: prefrontal inactivation during sensorimotor processing. Neuron. 2006;50(2):329–339. doi: 10.1016/j.neuron.2006.03.015. [DOI] [PubMed] [Google Scholar]
- Greicius MD, Krasnow B, Reiss AL, Menon V. Functional connectivity in the resting brain: A network analysis of the default mode hypothesis. Proceedings of the National Academy of Sciences. 2003;100(1):253–258. doi: 10.1073/pnas.0135058100. [DOI] [PMC free article] [PubMed] [Google Scholar]
- Gruetter R, Seaquist ER, Ugurbil K. A mathematical model of compartmentalized neurotransmitter metabolism in the human brain. American Journal of Physiology. Endocrinology and Metabolism. 2001;281(1):E100–112. doi: 10.1152/ajpendo.2001.281.1.E100. [DOI] [PubMed] [Google Scholar]
- Habas C, Kamdar N, Nguyen D, Prater K, Beckmann CF, Menon V, Greicius MD. Distinct cerebellar contributions to intrinsic connectivity networks. J Neurosci. 2009;29:8586–8594. doi: 10.1523/JNEUROSCI.1868-09.2009. [DOI] [PMC free article] [PubMed] [Google Scholar]
- Haber SN. The primate basal ganglia: parallel and integrative networks. J Chem Neuroanat. 2003;26:317–330. doi: 10.1016/j.jchemneu.2003.10.003. [DOI] [PubMed] [Google Scholar]
- Ham T, Leff A, de Boissezon X, Joffe A, Sharp DJ. Cognitive Control and the Salience Network: An Investigation of Error Processing and Effective Connectivity. The Journal of Neuroscience. 2013;33(16):7091–7098. doi: 10.1523/JNEUROSCI.4692-12.2013. [DOI] [PMC free article] [PubMed] [Google Scholar]
- Himberg J, Hyvärinen A, Esposito F. Validating the independent components of neuroimaging time series via clustering and visualization. NeuroImage. 2004;22(3):1214–1222. doi: 10.1016/j.neuroimage.2004.03.027. [DOI] [PubMed] [Google Scholar]
- Horn DI, Yu C, Steiner J, Buchmann J, Kaufmann J, Osoba A, Walter M. Glutamatergic and resting-state functional connectivity correlates of severity in major depression- the role of pregenual anterior cingulate cortex and anterior insula. Frontiers in Systems Neuroscience. 2010;4 doi: 10.3389/fnsys.2010.00033. [DOI] [PMC free article] [PubMed] [Google Scholar]
- Houk JC, Bastianen C, Fansler D, Fishbach A, Fraser D, Reber PJ, Simo LS. Action selection and refinement in subcortical loops through basal ganglia and cerebellum. Philosophical Transactions of the Royal Society of London. Series B, Biological Sciences. 2007;362(1485):1573–1583. doi: 10.1098/rstb.2007.2063. [DOI] [PMC free article] [PubMed] [Google Scholar]
- Hunter MA, Coffman BA, Trumbo MC, Clark VP. Tracking the neuroplastic changes associated with transcranial direct current stimulation: a push for multi-modal imaging. Frontiers in Human Neuroscience. 2013;7 doi: 10.3389/fnhum.2013.00495. [DOI] [PMC free article] [PubMed] [Google Scholar]
- Imamizu H, Miyauchi S, Tamada T, Sasaki Y, Takino R, Pütz B, Kawato M. Human cerebellar activity reflecting an acquired internal model of a new tool. Nature. 2000;403(6766):192–195. doi: 10.1038/35003194. [DOI] [PubMed] [Google Scholar]
- Jafri MJ, Pearlson GD, Stevens M, Calhoun VD. A method for functional network connectivity among spatially independent intrinsic components in schizophrenia. Neuroimage. 2008;39(4):1666–1681. doi: 10.1016/j.neuroimage.2007.11.001. [DOI] [PMC free article] [PubMed] [Google Scholar]
- Kapogiannis D, Reiter DA, Willette AA, Mattson MP. Posteromedial cortex glutamate and GABA predict intrinsic functional connectivity of the default mode network. Neuroimage. 2012 doi: 10.1016/j.neuroimage.2012.09.029. [DOI] [PMC free article] [PubMed] [Google Scholar]
- Kays JL, Hurley RA, Taber KH. The Dynamic Brain: Neuroplasticity and Mental Health. The Journal of Neuropsychiatry and Clinical Neurosciences. 2012;24(2):118–124. doi: 10.1176/appi.neuropsych.24.1.118. [DOI] [PubMed] [Google Scholar]
- Keeser D, Meindl T, Bor J, Palm U, Pogarell O, Mulert C, Padberg F. Prefrontal Transcranial Direct Current Stimulation Changes Connectivity of Resting-State Networks during fMRI. The Journal of Neuroscience. 2011;31(43):15284–15293. doi: 10.1523/JNEUROSCI.0542-11.2011. [DOI] [PMC free article] [PubMed] [Google Scholar]
- Kinsbourne M. Development of attention and metacognition. In: Rapin I, Segalowitz S, editors. Handbook of Neuropsychology. Vol. 7. Amsterdam: Elsevier Biomedical; 1993. pp. 261–278. [Google Scholar]
- Koechlin E, Danek A, Burnod Y, Grafman J. Medial prefrontal and subcortical mechanisms underlying the acquisition of motor and cognitive action sequences in humans. Neuron. 2002;35(2):371–381. doi: 10.1016/s0896-6273(02)00742-0. [DOI] [PubMed] [Google Scholar]
- Kuo MF, Paulus W, Nitsche MA. Therapeutic effects of non-invasive brain stimulation with direct currents (tDCS) in neuropsychiatric diseases. Neuroimage. 2013 doi: 10.1016/j.neuroimage.2013.05.117. [DOI] [PubMed] [Google Scholar]
- Liebetanz D, Nitsche MA, Tergau F, Paulus W. Pharmacological approach to the mechanisms of transcranial DC-stimulation-induced after-effects of human motor cortex excitability. Brain. 2002;125:2238–2247. doi: 10.1093/brain/awf238. [DOI] [PubMed] [Google Scholar]
- Lin, Hasson U, Jovicich J, Robinson S. A neuronal basis for task-negative responses in the human brain. Cerebral Cortex. 2011;21:821–830. doi: 10.1093/cercor/bhq151. [DOI] [PMC free article] [PubMed] [Google Scholar]
- Machado-Vieira R, Salvadore G, Ibrahim L, Diaz-Granados N, Zarate C., Jr Targeting Glutamatergic Signaling for the Development of Novel Therapeutics for Mood Disorders. Current Pharmaceutical Design. 2009;15(14):1595–1611. doi: 10.2174/138161209788168010. [DOI] [PMC free article] [PubMed] [Google Scholar]
- Martino AD, Scheres A, Margulies DS, Kelly AMC, Uddin LQ, Shehzad Z, Milham MP. Functional Connectivity of Human Striatum: A Resting State fMRI Study. Cerebral Cortex. 2008;18(12):2735–2747. doi: 10.1093/cercor/bhn041. [DOI] [PubMed] [Google Scholar]
- McKeown MJ, Makeig S, Brown GG, Jung TP, Kindermann SS, Bell AJ, Sejnowski TJ. Analysis of fMRI data by blind separation into independent spatial components. Human Brain Mapping. 1997;6:160–188. doi: 10.1002/(SICI)1097-0193(1998)6:3<160::AID-HBM5>3.0.CO;2-1. [DOI] [PMC free article] [PubMed] [Google Scholar]
- Medeiros LF, de Souza ICC, Vidor LP, de Souza A, Deitos A, Volz MS, Torres ILS. Neurobiological effects of transcranial direct current stimulation: a review. Frontiers in Psychiatry. 2012;3:110. doi: 10.3389/fpsyt.2012.00110. [DOI] [PMC free article] [PubMed] [Google Scholar]
- Menon V, Uddin LQ. Saliency, switching, attention and control: a network model of insula function. Brain Structure & Function. 2010;214(5–6):655–667. doi: 10.1007/s00429-010-0262-0. [DOI] [PMC free article] [PubMed] [Google Scholar]
- Miall RC, Christensen LOD, Cain O, Stanley J. Disruption of State Estimation in the Human Lateral Cerebellum. PLoS Biol. 2007;5(11):e316. doi: 10.1371/journal.pbio.0050316. [DOI] [PMC free article] [PubMed] [Google Scholar]
- Molenberghs P, Mesulam MM, Peeters R, Vandenberghe RRC. Remapping Attentional Priorities: Differential Contribution of Superior Parietal Lobule and Intraparietal Sulcus. Cerebral Cortex. 2007;17(11):2703–2712. doi: 10.1093/cercor/bhl179. [DOI] [PubMed] [Google Scholar]
- Moos K, Vossel S, Weidner R, Sparing R, Fink GR. Modulation of Top-Down Control of Visual Attention by Cathodal tDCS over Right IPS. The Journal of Neuroscience. 2012;32(46):16360–16368. doi: 10.1523/JNEUROSCI.6233-11.2012. [DOI] [PMC free article] [PubMed] [Google Scholar]
- Muthukumaraswamy SD, Evans CJ, Edden RAE, Wise RG, Singh KD. Individual variability in the shape and amplitude of the BOLD-HRF correlates with endogenous GABAergic inhibition. Human Brain Mapping. 2012;33(2):455–465. doi: 10.1002/hbm.21223. [DOI] [PMC free article] [PubMed] [Google Scholar]
- Nitsche MA, Paulus W. Excitability changes induced in the human motor cortex by weak transcranial direct current stimulation. The Journal of Physiology. 2000;527(3):633–639. doi: 10.1111/j.1469-7793.2000.t01-1-00633.x. [DOI] [PMC free article] [PubMed] [Google Scholar]
- Nitsche MA, Liebetanz D, Schlitterlau A, Henschke U, Fricke K, Frommann K, Tergau F. GABAergic modulation of DC stimulation-induced motor cortex excitability shifts in humans. European Journal of Neuroscience. 2004;19(10):2720–2726. doi: 10.1111/j.0953-816X.2004.03398.x. [DOI] [PubMed] [Google Scholar]
- Nitsche MA, Seeber A, Frommann K, Klein CC, Rochford C, Nitsche MS, Tergau F. Modulating parameters of excitability during and after transcranial direct current stimulation of the human motor cortex. The Journal of Physiology. 2005;568(Pt 1):291–303. doi: 10.1113/jphysiol.2005.092429. [DOI] [PMC free article] [PubMed] [Google Scholar]
- Northoff G, Walter M, Schulte RF, Beck J, Dydak U, Henning A, Boesiger P. GABA concentrations in the human anterior cingulate cortex predict negative BOLD responses in fMRI. Nature Neuroscience. 2007;10(12):1515–1517. doi: 10.1038/nn2001. [DOI] [PubMed] [Google Scholar]
- O’Reilly JX, Beckmann CF, Tomassini V, Ramnani N, Johansen-Berg H. Distinct and overlapping functional zones in the cerebellum defined by resting state functional connectivity. Cereb Cortex. 2010;20:953–965. doi: 10.1093/cercor/bhp157. [DOI] [PMC free article] [PubMed] [Google Scholar]
- Park CH, Chang WH, Park JY, Shin YI, Kim ST, Kim YH. Transcranial direct current stimulation increases resting state interhemispheric connectivity. Neuroscience Letters. 2013;539:7–10. doi: 10.1016/j.neulet.2013.01.047. [DOI] [PubMed] [Google Scholar]
- Peled A. From plasticity to complexity: a new diagnostic method for psychiatry. Medical Hypotheses. 2004;63(1):110–114. doi: 10.1016/j.mehy.2004.02.010. [DOI] [PubMed] [Google Scholar]
- Peled A. Plasticity imbalance in mental disorders the neuroscience of psychiatry: implications for diagnosis and research. Medical Hypotheses. 2005;65(5):947–952. doi: 10.1016/j.mehy.2005.05.007. [DOI] [PubMed] [Google Scholar]
- Peña-Gómez C, Sala-Lonch R, Junqué C, Clemente IC, Vidal D, Bargalló N, Bartrés-Faz D. Modulation of large-scale brain networks by transcranial direct current stimulation evidenced by resting-state functional MRI. Brain Stimulation. 2012;5(3):252–263. doi: 10.1016/j.brs.2011.08.006. [DOI] [PMC free article] [PubMed] [Google Scholar]
- Polanía R, Paulus W, Nitsche MA. Modulating cortico-striatal and thalamo-cortical functional connectivity with transcranial direct current stimulation. Human Brain Mapping. 2012;33(10):2499–2508. doi: 10.1002/hbm.21380. [DOI] [PMC free article] [PubMed] [Google Scholar]
- Polanía R, Paulus W, Antal A, Nitsche MA. Introducing graph theory to track for neuroplastic alterations in the resting human brain: A transcranial direct current stimulation study. NeuroImage. 2011;54(3):2287–2296. doi: 10.1016/j.neuroimage.2010.09.085. [DOI] [PubMed] [Google Scholar]
- Power JD, Schlaggar BL, Lessov-Schlaggar CN, Petersen SE. Evidence for Hubs in Human Functional Brain Networks. Neuron. 2013;79(4):798–813. doi: 10.1016/j.neuron.2013.07.035. [DOI] [PMC free article] [PubMed] [Google Scholar]
- Provencher SW. Automatic quantitation of localized in vivo 1H spectra with LCModel. NMR in Biomedicine. 2001;14(4):260–264. doi: 10.1002/nbm.698. [DOI] [PubMed] [Google Scholar]
- Qin G. Northoff. How is our self-related to midline regions and the default-mode network? NeuroImage. 2011;57:1221–1233. doi: 10.1016/j.neuroimage.2011.05.028. [DOI] [PubMed] [Google Scholar]
- Radman T, Ramos RL, Brumberg JC, Bikson M. Role of cortical cell type and morphology in subthreshold and suprathreshold uniform electric field stimulation in vitro. Brain Stimulation. 2009;2(4):215–228. e1–3. doi: 10.1016/j.brs.2009.03.007. [DOI] [PMC free article] [PubMed] [Google Scholar]
- Raichle ME, Snyder AZ. A default mode of brain function: a brief history of an evolving idea. NeuroImage. 2007;37(4):1083–1090. doi: 10.1016/j.neuroimage.2007.02.041. [DOI] [PubMed] [Google Scholar]
- Raichle ME, MacLeod AM, Snyder AZ, Powers WJ, Gusnard DA, Shulman GL. A default mode of brain function. Proceedings of the National Academy of Sciences of the United States of America. 2001;98(2):676–682. doi: 10.1073/pnas.98.2.676. [DOI] [PMC free article] [PubMed] [Google Scholar]
- Rango M, Cogiamanian F, Marceglia S, Barberis B, Arighi A, Biondetti P, Priori A. Myoinositol content in the human brain is modified by transcranial direct current stimulation in a matter of minutes: A 1H-MRS study. Magnetic Resonance in Medicine. 2008;60(4):782–789. doi: 10.1002/mrm.21709. [DOI] [PubMed] [Google Scholar]
- Rushworth MFS, Paus T, Sipila PK. Attention Systems and the Organization of the Human Parietal Cortex. The Journal of Neuroscience. 2001;21(14):5262–5271. doi: 10.1523/JNEUROSCI.21-14-05262.2001. [DOI] [PMC free article] [PubMed] [Google Scholar]
- Schall JD. Neural basis of saccade target selection. Rev Neurosciences. 1995;6(1):63–85. doi: 10.1515/revneuro.1995.6.1.63. [DOI] [PubMed] [Google Scholar]
- Schmahmann JC, Sherman JC. The cerebellar cognitive affective syndrome. Brain. 1998;121:561–79. doi: 10.1093/brain/121.4.561. [DOI] [PubMed] [Google Scholar]
- Schmahmann JD, Caplan D. Cognition, emotion and the cerebellum. Brain. 2006;129(2):290–292. doi: 10.1093/brain/awh729. [DOI] [PubMed] [Google Scholar]
- Seeley WW, Menon V, Schatzberg AF, Keller J, Glover GH, Kenna H, Greicius MD. Dissociable Intrinsic Connectivity Networks for Salience Processing and Executive Control. The Journal of Neuroscience. 2007;27(9):2349–2356. doi: 10.1523/JNEUROSCI.5587-06.2007. [DOI] [PMC free article] [PubMed] [Google Scholar]
- Sehm B, Kipping J, Schäfer A, Villringer A, Ragert P. A Comparison between Uni- and Bilateral tDCS Effects on Functional Connectivity of the Human Motor Cortex. Frontiers in Human Neuroscience. 2013:7. doi: 10.3389/fnhum.2013.00183. [DOI] [PMC free article] [PubMed] [Google Scholar]
- Sehm B, Schäfer A, Kipping J, Margulies D, Conde V, Taubert M, Ragert P. Dynamic modulation of intrinsic functional connectivity by transcranial direct current stimulation. Journal of Neurophysiology. 2012;108(12):3253–3263. doi: 10.1152/jn.00606.2012. [DOI] [PubMed] [Google Scholar]
- Seth AK, Suzuki K, Critchley HD. An Interoceptive Predictive Coding Model of Conscious Presence. Frontiers in Psychology. 2012;2 doi: 10.3389/fpsyg.2011.00395. [DOI] [PMC free article] [PubMed] [Google Scholar]
- Silvanto J, Pascual-Leone A. State-Dependency of Transcranial Magnetic Stimulation. Brain Topography. 2008;21(1):1–10. doi: 10.1007/s10548-008-0067-0. [DOI] [PMC free article] [PubMed] [Google Scholar]
- Singer T, Critchley HD, Preuschoff K. A common role of insula in feelings, empathy and uncertainty. Trends in Cognitive Sciences. 2009;13(8):334–340. doi: 10.1016/j.tics.2009.05.001. [DOI] [PubMed] [Google Scholar]
- Skudlarski P, Jagannathan K, Anderson K, Stevens MC, Calhoun VD, Skudlarska BA, Pearlson G. Brain connectivity is not only lower but also different in schizophrenia: a combined anatomical and functional approach. Biological psychiatry. 2010;68(1):61–69. doi: 10.1016/j.biopsych.2010.03.035. [DOI] [PMC free article] [PubMed] [Google Scholar]
- Sparing R, Thimm M, Hesse MD, Küst J, Karbe H, Fink GR. Bidirectional alterations of interhemispheric parietal balance by non-invasive cortical stimulation. Brain: A Journal of Neurology. 2009;132(Pt 11):3011–3020. doi: 10.1093/brain/awp154. [DOI] [PubMed] [Google Scholar]
- Spedding M, Neau I, Harsing L. Brain plasticity and pathology in psychiatric disease: sites of action for potential therapy. Current Opinion in Pharmacology. 2003;3(1):33–40. doi: 10.1016/s1471-4892(02)00008-5. [DOI] [PubMed] [Google Scholar]
- Sridharan D, Levitin DJ, Menon V. A critical role for the right fronto-insular cortex in switching between central-executive and default-mode networks. Proceedings of the National Academy of Sciences. 2008;105(34):12569–12574. doi: 10.1073/pnas.0800005105. [DOI] [PMC free article] [PubMed] [Google Scholar]
- Stagg CJ, Nitsche MA. Physiological Basis of Transcranial Direct Current Stimulation. The Neuroscientist. 2011;17(1):37–53. doi: 10.1177/1073858410386614. [DOI] [PubMed] [Google Scholar]
- Stagg CJ, Best JG, Stephenson MC, O’Shea J, Wylezinska M, Kincses ZT, Johansen-Berg H. Polarity-Sensitive Modulation of Cortical Neurotransmitters by Transcranial Stimulation. The Journal of Neuroscience. 2009;29(16):5202–5206. doi: 10.1523/JNEUROSCI.4432-08.2009. [DOI] [PMC free article] [PubMed] [Google Scholar]
- Steen RG, Hamer RM, Lieberman JA. Measurement of Brain Metabolites by 1H Magnetic Resonance Spectroscopy in Patients with Schizophrenia: A Systematic Review and Meta-Analysis. Neuropsychopharmacology. 2005;30(11):1949–1962. doi: 10.1038/sj.npp.1300850. [DOI] [PubMed] [Google Scholar]
- Stephan KE, Baldeweg T, Friston KJ. Synaptic Plasticity and Dysconnection in Schizophrenia. Biological Psychiatry. 2006;59(10):929–939. doi: 10.1016/j.biopsych.2005.10.005. [DOI] [PubMed] [Google Scholar]
- Strange BA, Henson RN, Friston KJ, Dolan RJ. Anterior prefrontal cortex mediates rule learning in humans. Cereb Cortex. 2001;11:1040–1046. doi: 10.1093/cercor/11.11.1040. [DOI] [PubMed] [Google Scholar]
- Szulc A, Konarzewska B, Galinska-Skok B, Lazarczyk J, Waszkiewicz N, Tarasow E, Walecki J. Proton magnetic resonance spectroscopy measures related to short-term symptomatic outcome in chronic schizophrenia. Neuroscience Letters. 2013;547:37–41. doi: 10.1016/j.neulet.2013.04.051. [DOI] [PubMed] [Google Scholar]
- Uddin LQ, Supekar K, Lynch CJ, Khouzam A, Phillips J, Feinstein C, Menon V. Salience network-based classification and prediction of symptom severity in children with autism. JAMA Psychiatry. 2013;70(8):869–879. doi: 10.1001/jamapsychiatry.2013.104. [DOI] [PMC free article] [PubMed] [Google Scholar]
- Van Den Heuvel MP, Hulshoff Pol HE. Exploring the brain network: a review on intrinsic fMRI functional connectivity. European Neuropsychopharmacology. 2010;20(8):519–534. doi: 10.1016/j.euroneuro.2010.03.008. [DOI] [PubMed] [Google Scholar]
- Vandenberghe R, Gillebert CR. Parcellation of parietal cortex: convergence between lesion-symptom mapping and mapping of the intact functioning brain. Behavioural Brain Research. 2009;199(2):171–182. doi: 10.1016/j.bbr.2008.12.005. [DOI] [PubMed] [Google Scholar]
- Venkatakrishnan A, Sandrini M. Combining transcranial direct current stimulation and neuroimaging: novel insights in understanding neuroplasticity. Journal of Neurophysiology. 2012;107(1):1–4. doi: 10.1152/jn.00557.2011. [DOI] [PMC free article] [PubMed] [Google Scholar]
- Venkatakrishnan A, Contreras-Vidal JL, Sandrini M, Cohen LG. Independent component analysis of resting brain activity reveals transient modulation of local cortical processing by transcranial direct current stimulation. Conference Proceedings: Annual International Conference of the IEEE Engineering in Medicine and Biology Society. 2011:8102–8105. doi: 10.1109/IEMBS.2011.6091998. [DOI] [PubMed] [Google Scholar]
- Vogt BA, Derbyshire WG. Visceral circuits and cingulate-mediated autonomic functions. In: Vogt BA, editor. Cingulate Neurobiology and Disease. Oxford University Press; Oxford; New York: 2009. p. xxxiv, 829. 2009. [Google Scholar]
- Wagner G, Sinsel E, Sobanski T, Köhler S, Marinou V, Mentzel HJ, Schlösser RGM. Cortical Inefficiency in Patients with Unipolar Depression: An Event-Related fMRI Study with the Stroop Task. Biological Psychiatry. 2006;59(10):958–965. doi: 10.1016/j.biopsych.2005.10.025. [DOI] [PubMed] [Google Scholar]
- Walter M, Henning A, Grimm S, Schulte RF, Beck J, Dydak U, Northoff G. The relationship between aberrant neuronal activation in the pregenual anterior cingulate, altered glutamatergic metabolism, and anhedonia in major depression. Archives of General Psychiatry. 2009;66(5):478–486. doi: 10.1001/archgenpsychiatry.2009.39. [DOI] [PubMed] [Google Scholar]
- White TP, Joseph V, Francis ST, Liddle PF. Aberrant salience network (bilateral insula and anterior cingulate cortex) connectivity during information processing in schizophrenia. Schizophrenia research. 2010;123(2–3):105–115. doi: 10.1016/j.schres.2010.07.020. [DOI] [PubMed] [Google Scholar]
- Whittington MA, Traub RD, Jefferys JG. Synchronized oscillations in interneuron networks driven by metabotropic glutamate receptor activation. Nature. 1995;373(6515):612–615. doi: 10.1038/373612a0. [DOI] [PubMed] [Google Scholar]
- Williamson, Allman A framework for interpreting functional brain networks in schizophrenia. Frontiers in Human Neuroscience. 2012 doi: 10.3389/fnhum.2012.00184. [DOI] [PMC free article] [PubMed] [Google Scholar]
- Wise SP, Boussaoud D, Johnson PB, Caminiti R. Premotor and parietal cortex: Corticocortical Connectivity and Combinatorial Computations1. Annual Review of Neuroscience. 1997;20(1):25–42. doi: 10.1146/annurev.neuro.20.1.25. [DOI] [PubMed] [Google Scholar]
- Wright J, Krekelberg B. Transcranial Direct Current Stimulation over Posterior Parietal Cortex alters Perceived Position. Journal of Vision. 2013;13(9):43–43. doi: 10.1167/14.9.5. [DOI] [PMC free article] [PubMed] [Google Scholar]
- Yazgan MY, Wexler BE, Kinsbourne M, Peterson B, Leckman JF. Functional significance of individual variations in callosal area. Neuropsychologia. 1995;33(6):769–779. doi: 10.1016/0028-3932(95)00018-x. [DOI] [PubMed] [Google Scholar]
- Yoshida W, Ishii S. Resolution of uncertainty in prefrontal cortex. Neuron. 2006;50(5):781–789. doi: 10.1016/j.neuron.2006.05.006. [DOI] [PubMed] [Google Scholar]
Associated Data
This section collects any data citations, data availability statements, or supplementary materials included in this article.