

Abstract
The apoptosis pathway of programmed cell death is frequently deregulated in cancer. An intact apoptosis pathway is required for proper response to anti-cancer treatment. We investigated the chromatin status of key apoptosis genes in the apoptosis pathway in colorectal cancer cell lines in relation to apoptosis induced by chemo-, immune- or radiation therapy. Using chromatin immunoprecipitation (ChIP), we measured the presence of transcription-activating histone modifications H3Ac and H3K4me3 and silencing modifications H3K9me3 and H3K27me3 at the gene promoter regions of key apoptosis genes Bax, Bcl2, Caspase-9, Fas (CD95) and p53. Cell lines DLD1, SW620, Colo320, Caco2, Lovo and HT29 were treated with cisplatin, anti-Fas or radiation. The apoptotic response was measured by flow cytometry using propidium iodide and annexin V-FITC. The chromatin status of the apoptosis genes reflected the activation status of the intrinsic (Bax, Bcl2, Caspase-9 and p53) and extrinsic (Fas) pathways. An active intrinsic apoptotic pathway corresponded to sensitivity to cisplatin and radiation treatment of cell lines DLD1, SW620 and Colo320. An active Fas promoter corresponded to an active extrinsic apoptotic pathway in cell line DLD1. mRNA expression data correlated with the chromatin status of the apoptosis genes as measured by ChIP. In conclusion, the results presented in this study indicate that the balance between activating and silencing histone modifications, reflecting the chromatin status of apoptosis genes, can be used to predict the response of tumor cells to different anti-cancer therapies and could provide a novel target to sensitize tumors to obtain adequate treatment responses.
Keywords: Histone modifications, Chromatin, Treatment response, Colorectal cancer
Introduction
Resistance to cell death is one of the capabilities acquired during tumor development and was therefore named as one of the hallmarks of cancer [1, 2]. The apoptosis pathway, responsible for programmed cell death, is indeed one of the pathways frequently deregulated in cancer [3]. The level of apoptosis has been previously shown to have prognostic value in rectal cancer [4-6]. As deregulation of the apoptotic pathway could lead to resistance to anti-cancer therapies, reactivation of the pathway is an attractive target to sensitize tumors for anti-cancer treatment [7-9]. Both the extrinsic and intrinsic apoptotic pathways have been studied as possible targets for anti-cancer therapy [10], but more information about the complex regulation of the pathway is still warranted for the development of apoptosis-based anti-cancer therapies for solid tumors.
Anti-cancer treatments are directed towards inducing cell death in tumor cells by inducing DNA damage (activating the intrinsic apoptotic pathway) or by initiating an antitumor immune response (activating the extrinsic apoptotic pathway). An intact apoptotic response is required in order for these treatment regimens to have the intended effect of tumor cell death [11, 12]. Epigenetic mechanisms, including DNA methylation and histone modifications, are key regulators of gene expression and are frequently deregulated in cancer [13-15]. Changes in epigenetic regulation of expression of apoptosis genes could influence the response of tumor cells to anti-cancer treatments. Therefore, in this study we investigated whether the chromatin status of key apoptosis genes in both the intrinsic and extrinsic apoptotic pathways could be used to predict the response of a tumor cell to anti-cancer treatment regimens.
We selected several apoptosis genes based on their prognostic value in various cancers in literature [16, 17], that are likely to play key roles in the apoptotic process. The selected genes were Fas (CD95) representing the extrinsic apoptotic pathway, and Bax, Bcl2, Caspase-9 (Casp9) and p53 representing the intrinsic pathway. We studied the cellular mRNA levels and the presence of both activating and silencing histone modifications at the promoter regions of each of these apoptosis genes using chromatin immunoprecipitation (ChIP) in six colorectal cancer cell lines. Subsequently, activation of the extrinsic apoptotic pathway was studied in the colorectal cancer cell lines using anti-Fas antibodies, and activation of the intrinsic pathway was studied using the chemotherapeutic agent cisplatin or using radiation treatment. The level of apoptosis induction upon treatment was then measured by flow cytometry and correlated to the chromatin status of the apoptosis genes as measured by ChIP. The chromatin status of each of the apoptosis genes was correlated to mRNA expression levels using gene expression assays.
Materials and methods
Cell lines and treatment
Colorectal cancer cell lines HT29, Lovo, Colo320, SW620, DLD1 and Caco2 were cultured under standard conditions, as described by the American Type Culture Collection (ATCC; Manassas, VA, USA), using T25 tissue culture flasks (Greiner-Bio One, Alphen aan den Rijn, The Netherlands). Dose–response curves were generated to determine an optimal dose and incubation time at which a maximum of 20 % cell death (corresponding to 80 % surviving cells) was measured. Cell lines were treated with different doses of the respective treatment regimens based on findings in literature and incubation times tested were 8, 16, 24 and 48 h. After incubation, cells were harvested and cell death was quantified using trypan blue staining. The percentage of surviving cells was determined as follows: 100 % − [number of dead cells/total number of cells (dead + surviving)]. Cells were treated with cisplatin (cis-Diammineplatinum (II) dichloride; Sigma-Aldrich, St. Louis, MO, USA) or anti-Fas (clone CH11; Millipore, Billerica, MA, USA) or were irradiated with X-rays at 6 Gy/min in tissue culture medium using an Andrex Smart 225 radiation instrument (200 kV, 4 mA; Andrex Radiation Products AS, Copenhagen). Following treatment with cisplatin, anti-Fas or radiation, the percentage of apoptotic cells was determined using flow cytometric analysis on a BD LSRII flow cytometer (BD Biosciences, Franklin Lakes, NJ, USA). Apoptotic cells were defined as cells with a positive signal for annexin V-FITC (5 μl in a total volume of 100 μl; ImmunoTools 31490013, Friesoythe, Germany) and a low signal for propidium iodide (PI, 1 μM; Calbiochem, San Diego, CA, USA). Cell lines were considered as sensitive to treatment when a ≥ 5 % increase in the percentage of apoptotic cells between the untreated controls and the treated cell lines was detected.
Chromatin immunoprecipitation experiments
ChIP experiments were performed for the following histone modifications: acetylated histone H3 (H3Ac, activating), trimethylation of lysine 4 at histone H3 (H3K4me3, activating), trimethylation of lysine 9 at histone H3 (H3K9me3, silencing), and trimethylation of lysine 27 at histone H3 (H3K27me3, silencing). ChIP experiments were performed according to a custom protocol, as described in [18], with some modifications. All ChIP experiments were performed in duplicate. Briefly, cell lines were trypsinized, centrifugated for 3 min at 1,000 rpm and washed once with phosphate-buffered saline (PBS). Cells were then incubated in a 1 % formaldehyde solution (in PBS) for 10 min at room temperature. The crosslinking reaction was stopped by adding 0.125 M glycine solution and incubating for 5 min at room temperature. After centrifugation, cell pellets were washed twice with PBS supplemented with 20 mM sodium butyrate. Cells were lysed by adding cell lysis buffer supplemented with 20 mM sodium butyrate, 1:100 diluted proteinase inhibitor cocktail (PIC; Sigma-Aldrich) and 1:100 diluted phenylmethanesulfonyl fluoride (PMSF, 36978, Fisher Scientific, Landsmeer, The Netherlands) and incubating on ice for 5–10 min. After complete lysis of the cells, samples were sonicated using a Soniprep 150 ultrasonic disintegrator (MSE (UK) Ltd, London, UK), producing DNA fragments of 100–400 bp (checked by gel electrophoresis). The DNA concentration was measured using a nanodrop (Thermo Scientific; Waltham, MA, USA), and 10 μg of chromatin was used as input for each of the ChIP reactions. Samples were incubated overnight (16 h), rotating at 4 °C, with one of the following antibodies: anti-H3K4me3 (ab8580, Abcam, Cambridge, UK), anti-H3K9me3 (ab8898, Abcam), anti-H3K27me3 (ab6002, Abcam), anti-H3Ac (06-599, Millipore) and anti-IgG (ab2410, Abcam). An “input” sample was used as the non-precipitated (no antibody) control. After overnight incubation, the chromatin-antibody complexes were incubated with protein G magnetic beads (Dynabeads, Thermo Scientific) for 4 h, rotating at 4 °C. Magnetic beads with the bound chromatin-antibody complexes were washed with subsequently low salt buffer, high salt buffer, lithium-chloride buffer and twice with TE pH 8.0 buffer. Chromatin-antibody complexes were eluted using freshly prepared elution buffer. DNA–protein-antibody complexes were denatured by incubating the eluted samples with 0.2 M NaCl for 15 min at 95 °C and subsequently with 0.5 μg proteinase K (Sigma-Aldrich) for 15 min at 60 °C. DNA clean-up was performed using phenol–chloroform-isoamyl alcohol (Sigma-Aldrich), followed by chloroform-isoamyl alcohol (Sigma-Aldrich). DNA was precipitated overnight by adding 0.6 M sodium acetate, 1 ml ethanol and 1 μl glycogen (20 mg/ml; 77534, Affymetrix, Cleveland, OH, USA) to a total volume of 1.4 ml. After centrifugation, cell pellets were resuspended in 30 μl TE and 3 μl of each sample was used for PCR.
PCR of apoptosis genes
PCR reactions of the duplicate experiments were performed using iQ™ SYBR® Green supermix (2x) (Bio-Rad Laboratories, Hercules, CA, USA). Primers were designed in the promoter regions of each of the respective apoptosis genes and melting temperatures (Tm) were optimized for each of the individual primer sets. The following primer sequences were used: Bax-F 5′-TGCCCGAAACTTCTAAAA-3′ and Bax-R 5′-CGTGACTGTCCAATGAGC-3′ (Tm 58 °C); Bcl2-F 5′-GCAGAAGTCTGGGAATCG-3′ and Bcl2-R 5′-GCATAAGGCAACGATCC-3′ (Tm 58 °C); Casp9-F 5′-CGGAAGCGGACTGAG-3′ and Casp9-R 5′-CAGAGCTGGTCCACCTG-3′ (Tm 60 °C); Fas-F 5′-CCAACTTCCCAGGTTGAA-3′ and Fas-R 5′-GCACAAATGGGCATTCC-3′ (CD95; Tm 56 °C); p53-F 5′-CTTACTTGTCATGGCGACT-3′ and p53-R 5′-CTGGACGGTGGCTCT-3′ (Tm 60 °C). Housekeeping genes GAPDH (active) and MYT (silenced) were used as controls to verify accurate detection of the individual histone modifications compared to the input sample. Primer sequences were as follows (Tm for both PCR reactions was 60 °C): GAPDH-F 5′-TACTAGCGGTTTTACGGGCG-3′, GAPDH-R 5′-TCGAACAGGAGGAGCAGAGAGCGA-3′ and MYT-F 5′-GCTGTGGGGAAAGGTAAGTC-3′, MYT-R 5′-ATGTCTCCTCTGTCAGACGC-3′.
Thermal cycling conditions were as follows: hot start for 10 min at 95 °C, followed by 40 cycles of denaturing for 10 s at 95 °C, annealing for 30 s at the optimized Tm and extension for 30 s at 72 °C. Melting curves were generated after every PCR run to ensure a single PCR product was amplified. Relative enrichment (the percentage of product precipitated as compared to the non-precipitated “input” sample) of each the respective histone modifications was calculated using the following formula: 2−(Ct value “input” sample − Ct value precipitated sample).
Real-time quantitative PCR for mRNA expression
RNA was isolated from each of the colorectal cancer cell lines using TRI Reagent (Life Technologies, Bleiswijk, The Netherlands), according to the manufacturer’s protocol. Reverse transcription of mRNA was performed using a High Capacity RNA-to-cDNA kit (Life Technologies). Quantitative duplex real-time PCR reactions were performed in duplicate using FAM-labeled commercially available Taqman Gene Expression assays (Life Technologies) for Casp9 (Hs00609647_m1), TP53 (Hs01034249_m1), Bcl2 (Hs00608023_m1), Bax (Hs000180269_m1), Fas (Hs00 236330_m1), GAPDH (Hs99999905_m1) and MYT (Hs01027966_m1). VIC-labeled HPRT1 (Tamra quencher; Hs02800695_m1, Life Technologies) was used as an internal housekeeping gene control within each duplex PCR reaction. For each individual PCR reaction, Ct values were normalized against Ct values of HPRT1 in the same reaction (ΔCt). Real-time PCR reactions were performed on a 7900 HT Fast Real-time PCR system (Applied Biosystems, Foster City, CA, USA).
Results
Dose–response curves
For each of the six colorectal cell lines included in this study, dose–response curves were made to find the optimal dose and duration of treatment with cisplatin, anti-Fas and radiation. Dose–response curves following radiation treatment showed the highest percentages of cell death in cell lines DLD1, SW620 and Colo320, and less response in cell lines HT29, Caco2 and Lovo (Fig. 1). Cell lines DLD1, SW620 and Colo320 were sensitive to cisplatin treatment, showing higher percentages of dead cells compared to cell lines Caco2, Lovo and HT29, that showed minimal cell death upon treatment with cisplatin (data not shown).
Fig. 1.
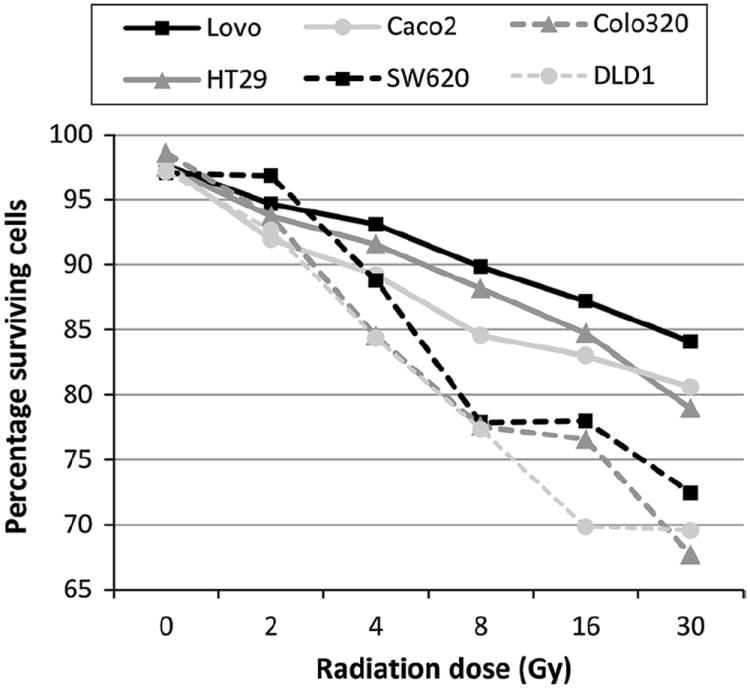
Dose–response curves and percentages of apoptotic cells of colorectal cancer cell lines following treatment. The percentage of surviving cells (y-axis) was determined for cell lines Lovo, HT29. Caco2, SW620, Colo320 and DLD1, 48 h after irradiation with different doses (x-axis). Cell lines were incubated with trypan blue and the surviving fraction was calculated as follows: 100 % – (number of trypan blue positive (dead) cells/total number of cells (dead + surviving))
Anti-Fas treatment induced marked cell death only in cell line DLD1, all other cell lines showed minimal cell death upon treatment with anti-Fas (data not shown). Treatment that resulted in a maximum of 20 % cell death (corresponding to 80 % of surviving cells at the time of harvest) in either of the cell lines after 24 h (for anti-Fas) or 48 h (for cisplatin and radiation treatment) was considered to be the optimal treatment procedure, indicating induction of apoptotic cell death but leaving a substantial surviving fraction to detect apoptotic cells that have initiated but have not finished the process at the time of harvest. On the basis of the survival curves obtained, we therefore chose for treatment of all cell lines with 40 μM cisplatin for 48 h, with 250 ng/ml anti-Fas for 24 h and 6 Gy radiation followed by harvesting after 48 h.
Flow cytometric detection of the apoptotic fraction after treatment
In order to quantify the percentage of apoptotic cells after treatment, flow cytometry analyses were performed to measure the apoptotic cell fraction of each of the cell lines upon treatment with cisplatin, anti-Fas or radiation. The apoptotic fraction was defined as the fraction of cells showing a positive signal for annexin V but a low signal for propidium iodide [19]. The sensitivity of each of the cell lines to induction of apoptosis by each of the treatment regimens was determined by comparing the apoptotic fractions before (untreated cell population) and after treatment. As for radiation and chemosensitivity, a large apoptotic fraction was observed after treatment as compared to the untreated population in cell lines DLD1, Colo320 (Fig. 2a) and SW620. Only a limited response (small apoptotic fraction) was observed for cell lines HT29, Caco2 and Lovo. Treatment with anti-Fas resulted in an apoptotic response only in cell line DLD1, the other cell lines did not respond to anti-Fas treatment. Each cell line showing a ≥ 5 % increase in the percentage of apoptotic cells was considered “sensitive” to the respective treatment. Results are displayed in Fig. 2b. The flow cytometry results confirmed the sensitivity of all cell lines for induction of apoptosis, as observed in the dose–response curves, to each of the treatment regimens.
Fig. 2.
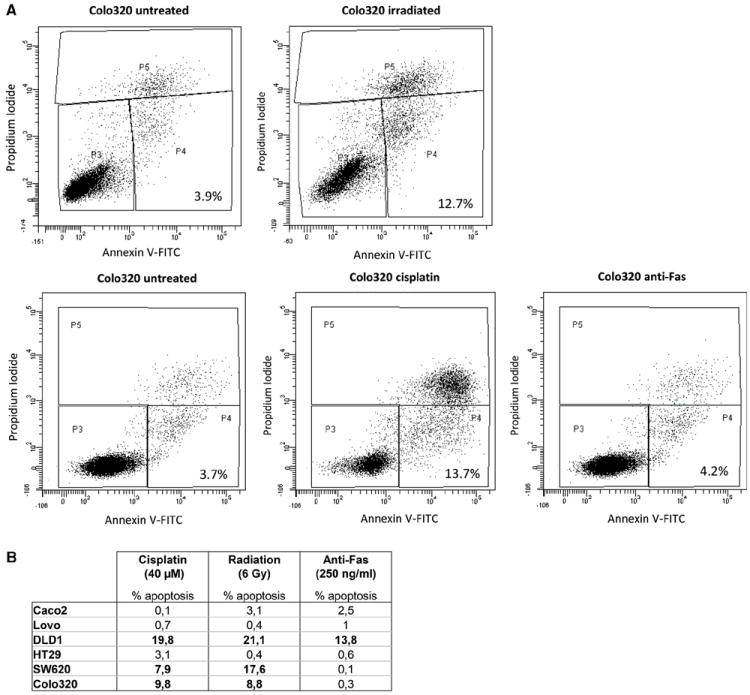
Flow cytometry results after treatment with cisplatin, radiation or anti-Fas. a Shown are the flow cytometry results of cell line Colo320 after the respective treatments. Two experiments were performed, to measure the apoptotic cell fractions after treatment with radiation (upper panel) and after treatment with cisplatin or anti-Fas (lower panel). Untreated controls were included in both experiments. Cells in gate P4 were regarded as the apoptotic fraction (positive signal for annexin V and a low signal for propidium iodide). Cells in gate P3 are the living cell fraction, cells in gate P5 are dead cells. Cell debris has been excluded from the analyses (gates P1 and P2, not shown). The percentage of apoptotic cells is indicated in the right bottom corner of each figure. b Difference in percentages of apoptotic cells between treated cells and untreated controls are displayed for each of the cell lines after treatment with cisplatin (48 h), radiation (48 h) or Anti-Fas (24 h). Differences of ≥5 % apoptotic cells was defined as sensitivity to the respective treatments and are indicated in bold
Chromatin immunoprecipitation and mRNA expression levels of apoptotic genes
In order to investigate whether the chromatin status of genes involved in the apoptotic pathway could be used to predict the response to chemo-, immune- or radiation therapy, we performed ChIP experiments for five key apopotic genes (Bax, Bcl2, Casp9, Fas and p53). Immunoprecipitation experiments were performed using antibodies against H3Ac, H3K4me3, H3K9me3 and H3K27me3, followed by real-time PCR for the genes of interest. All ChIP experiments were performed in duplicate, with a mean difference in Ct values between the two measurements of 1.93 (range 0.04–3.80), indicating sufficient reproducibility of the assay. In addition to the chromatin status of the genes, we measured mRNA expression levels of all genes (including control genes GAPDH and MYT) in each cell line and normalized the expression to the HPRT1 signal in each individual reaction (ΔCt). HPRT1 Ct values were very constant across the different genes and duplicate reactions, with average Ct values between 21.3 and 22.7 for the different cell lines and a standard deviation of 0.6 over all measurements.
ChIP results for control genes
Control genes GAPDH (active housekeeping gene) and MYT (myelin transcription factor, silenced in colorectal tissues) were included in each ChIP experiment for assay validation. As expected, at the GAPDH promoter higher relative enrichment (the percentage of precipitated DNA as compared to the non-precipitated “input” sample) of active modifications H3Ac and H3K4me3 was observed as compared to the silencing modifications H3K9me3 and H3K27me3 (Supplementary Fig. 1A). At the MYT promoter, higher relative enrichment of silencing histone modifications was observed as compared to the activating histone modifications (Supplementary Fig. 1B). mRNA expression data confirmed active expression of GAPDH, with higher relative expression (ΔCt values) compared to HPRT1, and silencing of MYT (Supplementary Fig. 1C). As the control genes GAPDH and MYT showed valid results, we continued with the immunoprecipitation experiments on apoptosis gene promoter regions.
ChIP results for apoptosis genes
The activation status of the individual apoptosis genes, as determined by the ChIP experiments, was correlated with sensitivity of the cell lines to chemo-, immune- or radiation therapy (Fig. 3). For example, cell line SW620 showed sensitivity to cisplatin and radiation treatment with differences in the percentage of apoptotic cells between controls and treated cells of 7.9 and 17.6 %, respectively, but was not sensitive to anti-Fas treatment (difference 0.1 % between controls and treated cells). Results from the ChIP experiments showed higher relative enrichment of silencing modification H3K9me3 on the Fas gene promoter as compared to the activating histone modifications, and high relative enrichment of activating histone modifications for Casp9 and Bax in cell line SW620 (Fig. 3a). These ChIP results corresponded to an active intrinsic pathway (the pathway is turned “on”), and hence an expected response to DNA damaging agents such as cisplatin and radiation, and a silenced extrinsic pathway (the pathway is turned “off”), which resulted in no response to anti-Fas treatment. For cell line DLD1, an active chromatin status of Casp9, Bax and Fas, as measured by higher relative enrichment of activating modifications H3Ac and H3K4me3 (Fig. 3b), corresponded to sensitivity to all treatments. Cell line Caco2 did not show induction of apoptosis with any of the treatment regimens. This cell line indeed showed high relative enrichment of silencing modifications H3K9me3 and H3K27me3 as compared to the activating histone modifications for Casp9 and Fas, and bivalent histone modifications (both activating and silencing histone modifications present) on p53, Bcl2 and Bax (Fig. 3c), corresponding to silenced intrinsic and extrinsic pathways. Cell lines Colo320, HT29 and Lovo, showed a similar correlation between the chromatin status of the apoptosis genes and the treatment response (Supplementary Fig. 2). Table 1 provides an overview of the chromatin status of each of the genes coupled to the response of each of the cell lines to chemo-, immune- or radiation therapy. An active chromatin status was assigned when higher relative enrichment was observed for active histone modifications, a repressed chromatin status when higher relative enrichment for silencing histone modifications was observed. Many gene promoters, however, showed bivalent promoters where both activating and silencing histone modifications were present in similar amounts. For example, the p53 gene showed a bivalent chromatin status in all cell lines. Overall, the chromatin status of the predominantly active or silenced gene promoters did correspond well to the overall status of the pathway (on or off), which in turn corresponded to the sensitivity of the individual cell lines to treatment. In conclusion, these results indicate that the balance between activating and silencing histone modifications, reflecting the chromatin status of the apoptotic genes, can be used to predict the response of tumor cells to different anti-cancer therapies.
Fig. 3.
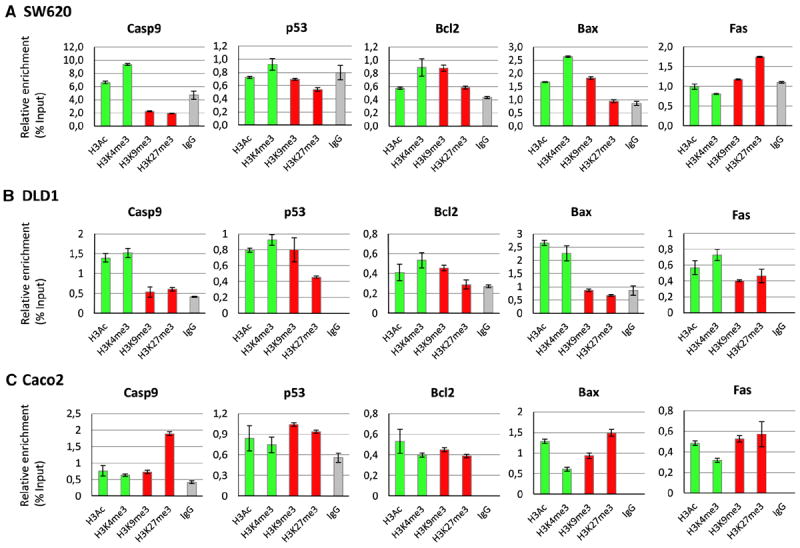
Results of the ChIP experiments are shown for cell lines SW620, DLD1 and Caco2. Immunoprecipitations have been performed using antibodies against active histone modifications H3Ac and H3K4me3 (indicated in green) and silencing histone modifications H3K9me3 and H3K27me3 (indicated in red). IgG was used as a control for non-selective binding (indicated in gray). PCR was performed for apoptosis genes Casp9, p53, Bcl2, Bax and Fas. The respective histone modifications are indicated on the x-axis, the relative enrichment (the percentage of precipitated DNA as compared to the non-precipitated input = % input) is indicated on the y-axis. Error bars represent the maximum and minimum values of the duplicate experiments. Corresponding percentages of apoptotic cells after each treatment are indicated in Fig. 2b (Color figure online)
Table 1.
Transcriptional status of apoptotis genes based on ChIP results in correlation with response to therapy
| Intrinsic pathway
|
Extrinsic pathway
|
|||||||||
|---|---|---|---|---|---|---|---|---|---|---|
| Casp9 | p53 | Bcl2 | Bax | Pathway status | Cisplatin (% apoptotic cells) (%) | Radiation (% apoptotic cells) (%) | Fas | Pathway status | Anti-Fas (% apoptotic cells) (%) | |
| SW620 | Active | Bivalent | Bivalent | Active | On | 7.9 | 17.6 | Silenced | Off | 0.1 |
| DLD1 | Active | Bivalent | Bivalent | Active | On | 19.8 | 21.1 | Active | On | 13.8 |
| Caco2 | Silenced | Bivalent | Bivalent | Bivalent | Off | 0.1 | 3.1 | Silenced | Off | 2.5 |
| Colo320 | Bivalent | Bivalent | Active | Active | On | 9.8 | 8.8 | Silenced | Off | 0.3 |
| HT29 | Bivalent | Bivalent | Active | Bivalent | Non-conclusive | 3.1 | 0.4 | Bivalent | Non-conclusive | 0.6 |
| Lovo | Silenced | Bivalent | Bivalent | Silenced | Off | 0.7 | 3.1 | Active | On | 2.5 |
For all cell lines, the chromatin status for each of the apoptosis genes based on the ChIP results is shown, divided into the intrinsic and extrinsic apoptotic pathways. An “active” status was assigned to gene promoters showing higher relative enrichment for active modifications, a “silenced” status for gene promoters showing higher relative enrichment for silencing modifications. A “bivalent” status refers to gene promoters with both active and silencing modification present in equal amounts. The differences between the treated cell lines and untreated controls in percentages of apoptotic cells as measured by flow cytometry are indicated for each cell line. Increases of ≥5 % apoptotic cells was defined as sensitivity to the respective treatments and are indicated in bold
mRNA expression levels of apoptotic genes
To correlate the chromatin status of the genes as determined with the ChIP experiments with mRNA expression levels, we performed gene expression analyses for all apoptosis genes (Fig. 4). Fas mRNA expression was observed in cell lines DLD1, HT29 and Lovo, which showed high relative enrichment of active histone modifications in the ChIP experiments. Low expression of Fas mRNA was observed in cell lines where high relative enrichment of silencing histone modifications was observed (SW620, Caco2 and Colo320). Caspase-9 showed high relative mRNA expression in all cell lines except Lovo, which indeed showed high relative enrichment of silencing histone modifications in the ChIP experiments. Bcl2 showed low relative mRNA expression in all cell lines, but cell lines Colo320 and HT29 that showed high relative enrichment of activating histone modifications showed only a slightly lower mRNA expression as compared to internal control HPRT1. Bax showed high relative mRNA expression in cell line DLD1 and only slightly lower relative expression as compared to HPRT1 in cell lines Caco2 and Colo320. Cell line Lovo showed a silenced Bax promoter in the ChIP experiments and indeed showed low relative mRNA expression. mRNA expression of p53 was high in all cell lines, except Caco2, despite the bivalent status of the p53 promoter in all cell lines. In conclusion, mRNA expression corresponds well to the chromatin status of the apoptosis gene promoters in most of the cell lines.
Fig. 4.
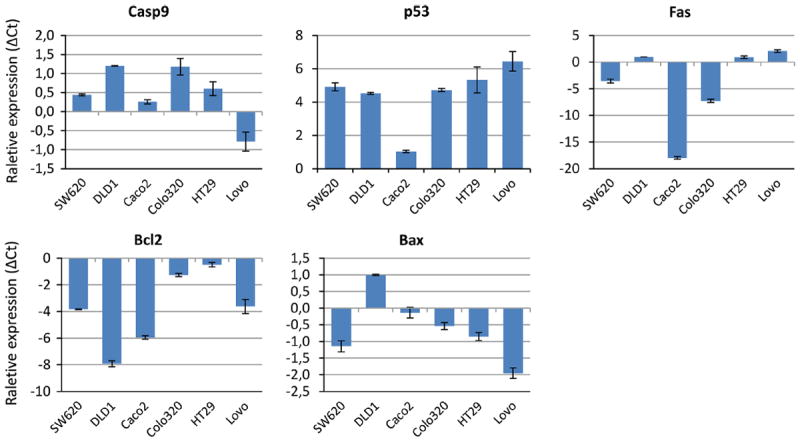
Messenger RNA expression of apoptosis gene promoters. The average relative mRNA expression results (ΔCt) of the duplicate PCR reactions are shown for each of the individual apoptosis genes in all cell lines. All Ct values shown were normalized to the HPRT1 signal in each individual PCR reaction. Error bars indicate the maximum and minimum values of the duplicate measurements
Discussion
An intact and active apoptotic pathway is required for a proper response to anti-cancer therapies [11, 12]. We therefore investigated the chromatin status of several key apoptosis genes in colorectal cancer cell lines, in correlation with the apoptotic response upon treatment with cisplatin, radiation or anti-Fas.
Our results regarding sensitivity of the different cell lines to the treatment regimens on the basis of dose-response curves were consistent with literature. Colorectal cancer cell lines DLD1, Colo320 and Sw620 showed a strong apoptotic response upon treatment with cisplatin or radiation, whereas the other cell lines did not, which was also reported previously by other groups [20, 21]. As for sensitivity to anti-Fas treatment, only cell line DLD1 showed an apoptotic response, the other cell lines showed a resistance to this therapy [22]. The sensitivity of each of the cell lines to chemo-, immune-, or radiation therapy was also reflected in the chromatin status of each of the apoptosis genes based on the presence of activating and/or silencing histone modifications at their promoter regions. The chromatin status of the apoptosis genes was also reflected in the mRNA expression profiles of the individual cell lines. As expected, an active chromatin status of the intrinsic pathway genes (Apaf1, Bax, Bcl2 and p53) was associated with sensitivity to treatment with cisplatin and radiation. Cell lines Lovo and DLD1 showed an active chromatin status of the Fas gene. However, only DLD1 showed a response to anti-Fas treatment. Differential expression of other extrinsic apoptotic pathway factors, that we have not included in our study, might affect the apoptotic response upon stimulation with anti-Fas and might hence explain the sensitivity of cell line DLD1 and the non-response of cell line Lovo upon treatment with anti-Fas.
Many genes showed a bivalent chromatin status, defined as the presence of both activating and silencing modifications at the same region. Bivalent chromatin marks key developmental genes and regulators, enabling the genes to be activated instantly when needed during development and differentiation [23, 24]. The bivalent promoter statuses as measured with our ChIP experiments are correlated with different effects on gene expression. For example, Bcl2 showed a bivalent chromatin status in four cell lines and showed repressed gene expression in these cell lines. On the contrary, the p53 gene showed a bivalent chromatin status in all cell lines but is associated with increased gene expression. As the bivalent chromatin status of Bcl2 and p53 does not specifically correlate to the differential responses to therapy, these genes might not play a crucial role determining sensitivity to therapy in the respective cell lines.
Epigenetic regulation of apoptosis genes has previously been studied [17, 25] and expression of the studied genes has been correlated to prognosis in cancer [26-29]. In addition, radiosensitization of colorectal cancer cell lines has been described upon treatment with HDAC inhibitors [30, 31] or Aurora B kinase [32]. HDAC inhibitors have also been shown to enhance the response to cisplatin treatment [33]. These studies indicate that sensitization of cancer cells can be obtained by changing the epigenetic make-up in the cancer cell, by for instance changes in the epigenetic regulation of apoptosis genes involved in the process of cell death upon anti-cancer treatment. Knowledge of specific changes in epigenetic mechanisms in cancer cells might provide new possible targets for anti-cancer therapy.
In conclusion, histone modifications at apoptosis gene promoter regions, reflecting the transcriptional status of the gene, can be used to predict the sensitivity of colorectal cancer cell lines to anti-cancer treatment. In current clinical practice, personalized treatment is warranted to prevent over- and undertreatment of colorectal cancer patients. Using information regarding the transcriptional activity of both the intrinsic and extrinsic apoptosis pathways may provide critical information that is required to make an informed treatment decision for each individual patient. Future research should focus on developing methods to detect these histone modifications on apoptosis gene promoters in patient tissues, such as snap-frozen tumor biopsies, in order to make this information available in the clinic. The chromatin status of the studied apoptosis genes might provide patient-specific information regarding the response to specific anti-cancer therapies. Because of the potentially reversible nature of epigenetic modifications, these modifications could provide novel targets to sensitize tumors to obtain adequate treatment responses.
Supplementary Material
Acknowledgments
We thank the department of Immunohematology and Blood Transfusion (Leiden University Medical Center, Leiden, The Netherlands) for use of the Andrex 225 Radiation instrument. We thank the department of Pathology (Leiden University Medical Center, Leiden, The Netherlands) for use of the BD LSRII Flow Cytometer. This study was financially supported by the “Stichting Sacha Swarttouw-Hijmans”.
Footnotes
Electronic supplementary material The online version of this article (doi:10.1007/s10495-014-1042-8) contains supplementary material, which is available to authorized users.
Conflict of interest The authors declare that they have no conflict of interest to disclose.
Contributor Information
Anne Benard, Department of Surgery, K6-R, Leiden University Medical Center, P.O. Box 9600, 2300 RC Leiden, The Netherlands.
Connie M. Janssen, Department of Surgery, K6-R, Leiden University Medical Center, P.O. Box 9600, 2300 RC Leiden, The Netherlands
Peter J. van den Elsen, Department of Immunohematology and Blood Transfusion, Leiden University Medical Center, Leiden, The Netherlands Department of Pathology, VU University Medical Center, Amsterdam, The Netherlands.
Marja C. J. A. van Eggermond, Department of Immunohematology and Blood Transfusion, Leiden University Medical Center, Leiden, The Netherlands
Dave S. B. Hoon, Department of Molecular Oncology, John Wayne Cancer Institute, Santa Monica, CA, USA
Cornelis J. H. van de Velde, Department of Surgery, K6-R, Leiden University Medical Center, P.O. Box 9600, 2300 RC Leiden, The Netherlands
Peter J. K. Kuppen, Email: p.j.k.kuppen@lumc.nl, Department of Surgery, K6-R, Leiden University Medical Center, P.O. Box 9600, 2300 RC Leiden, The Netherlands.
References
- 1.Hanahan D, Weinberg RA. The hallmarks of cancer. Cell. 2000;100:57–70. doi: 10.1016/s0092-8674(00)81683-9. [DOI] [PubMed] [Google Scholar]
- 2.Hanahan D, Weinberg RA. Hallmarks of cancer: the next generation. Cell. 2011;144:646–674. doi: 10.1016/j.cell.2011.02.013. [DOI] [PubMed] [Google Scholar]
- 3.Yu J, Zhang L. Apoptosis in human cancer cells. Curr Opin Oncol. 2004;16:19–24. doi: 10.1097/00001622-200401000-00005. [DOI] [PubMed] [Google Scholar]
- 4.de Heer P, de Bruin EC, Klein-Kranenbarg E, Aalbers RI, Marijnen CA, Putter H, de Bont HJ, Nagelkerke JF, van Krieken JH, Verspaget HW, van de Velde CJ, Kuppen PJ. Caspase-3 activity predicts local recurrence in rectal cancer. Clin Cancer Res. 2007;13:5810–5815. doi: 10.1158/1078-0432.CCR-07-0343. [DOI] [PubMed] [Google Scholar]
- 5.Marijnen CA, Nagtegaal ID, Mulder-Stapel AA, Schrier PI, van de Velde CJ, van Krieken JH, Peltenburg LT. High intrinsic apoptosis, but not radiation-induced apoptosis, predicts better survival in rectal carcinoma patients. Int J Radiat Oncol Biol Phys. 2003;57:434–443. doi: 10.1016/s0360-3016(03)00580-7. [DOI] [PubMed] [Google Scholar]
- 6.de Bruin EC, van de Velde CJ, van de Pas S, Nagtegaal ID, van Krieken JH, Gosens MJ, Peltenburg LT, Medema JP, Marijnen CA. Prognostic value of apoptosis in rectal cancer patients of the dutch total mesorectal excision trial: radiotherapy is redundant in intrinsically high-apoptotic tumors. Clin Cancer Res. 2006;12:6432–6436. doi: 10.1158/1078-0432.CCR-06-0231. [DOI] [PubMed] [Google Scholar]
- 7.Schulze-Bergkamen H, Weinmann A, Moehler M, Siebler J, Galle PR. Novel ways to sensitise gastrointestinal cancer to apoptosis. Gut. 2009;58:1010–1024. doi: 10.1136/gut.2008.164350. [DOI] [PubMed] [Google Scholar]
- 8.Dario LS, Rosa MA, Mariela E, Roberto G, Caterina C. Chromatin remodeling agents for cancer therapy. Rev Recent Clin Trials. 2008;3:192–203. doi: 10.2174/157488708785700320. [DOI] [PubMed] [Google Scholar]
- 9.Wong RS. Apoptosis in cancer: from pathogenesis to treatment. J Exp Clin Cancer Res. 2011;30:87. doi: 10.1186/1756-9966-30-87. [DOI] [PMC free article] [PubMed] [Google Scholar]
- 10.Fulda S, Debatin KM. Extrinsic versus intrinsic apoptosis pathways in anticancer chemotherapy. Oncogene. 2006;25:4798–4811. doi: 10.1038/sj.onc.1209608. [DOI] [PubMed] [Google Scholar]
- 11.de Oliveira Niero EL, Rocha-Sales B, Lauand C, Cortez BA, de Souza MM, Rezende-Teixeira P, Urabayashi MS, Martens AA, Neves JH, Machado-Santelli GM. The multiple facets of drug resistance: one history, different approaches. J Exp Clin Cancer Res. 2014;33:37. doi: 10.1186/1756-9966-33-37. [DOI] [PMC free article] [PubMed] [Google Scholar]
- 12.Galluzzi L, Senovilla L, Vitale I, Michels J, Martins I, Kepp O, Castedo M, Kroemer G. Molecular mechanisms of cisplatin resistance. Oncogene. 2012;31:1869–1883. doi: 10.1038/onc.2011.384. [DOI] [PubMed] [Google Scholar]
- 13.Lao VV, Grady WM. Epigenetics and colorectal cancer. Nat Rev Gastroenterol Hepatol. 2011;8:686–700. doi: 10.1038/nrgastro.2011.173. [DOI] [PMC free article] [PubMed] [Google Scholar]
- 14.Muntean AG, Hess JL. Epigenetic dysregulation in cancer. Am J Pathol. 2009;175:1353–1361. doi: 10.2353/ajpath.2009.081142. [DOI] [PMC free article] [PubMed] [Google Scholar]
- 15.Sarkar S, Horn G, Moulton K, Oza A, Byler S, Kokolus S, Longacre M. Cancer development, progression, and therapy: an epigenetic overview. Int J Mol Sci. 2013;14:21087–21113. doi: 10.3390/ijms141021087. [DOI] [PMC free article] [PubMed] [Google Scholar]
- 16.Wang HL, Bai H, Li Y, Sun J, Wang XQ. Rationales for expression and altered expression of apoptotic protease activating factor-1 gene in gastric cancer. World J Gastroenterol. 2007;13:5060–5064. doi: 10.3748/wjg.v13.i38.5060. [DOI] [PMC free article] [PubMed] [Google Scholar]
- 17.Chmelarova M, Krepinska E, Spacek J, Laco J, Beranek M, Palicka V. Methylation in the p53 promoter in epithelial ovarian cancer. Clin Transl Oncol. 2013;15:160–163. doi: 10.1007/s12094-012-0894-z. [DOI] [PubMed] [Google Scholar]
- 18.Wierda RJ, Kuipers HF, van Eggermond MC, Benard A, van Leeuwen JC, Carluccio S, Geutskens SB, Jukema JW, Marquez VE, Quax PH, van den Elsen PJ. Epigenetic control of CCR5 transcript levels in immune cells and modulation by small molecules inhibitors. J Cell Mol Med. 2012;16:1866–1877. doi: 10.1111/j.1582-4934.2011.01482.x. [DOI] [PMC free article] [PubMed] [Google Scholar]
- 19.Koopman G, Reutelingsperger CP, Kuijten GA, Keehnen RM, Pals ST, van Oers MH. Annexin V for flow cytometric detection of phosphatidylserine expression on B cells undergoing apoptosis. Blood. 1994;84:1415–1420. [PubMed] [Google Scholar]
- 20.de Fernandez MS, Villalonga P, Clardy J, Lam EW. FOXO3a mediates the cytotoxic effects of cisplatin in colon cancer cells. Mol Cancer Ther. 2008;7:3237–3246. doi: 10.1158/1535-7163.MCT-08-0398. [DOI] [PMC free article] [PubMed] [Google Scholar]
- 21.Nyati MK, Maheshwari D, Hanasoge S, Sreekumar A, Rynkiewicz SD, Chinnaiyan AM, Leopold WR, Ethier SP, Lawrence TS. Radiosensitization by pan ErbB inhibitor CI-1033 in vitro and in vivo. Clin Cancer Res. 2004;10:691–700. doi: 10.1158/1078-0432.ccr-1041-03. [DOI] [PubMed] [Google Scholar]
- 22.van Geelen CM, de Vries EG, Le TK, van Weeghel RP, de Jong S. Differential modulation of the TRAIL receptors and the CD95 receptor in colon carcinoma cell lines. Br J Cancer. 2003;89:363–373. doi: 10.1038/sj.bjc.6601065. [DOI] [PMC free article] [PubMed] [Google Scholar]
- 23.Bernstein BE, Mikkelsen TS, Xie X, Kamal M, Huebert DJ, Cuff J, Fry B, Meissner A, Wernig M, Plath K, Jaenisch R, Wagschal A, Feil R, Schreiber SL, Lander ES. A bivalent chromatin structure marks key developmental genes in embryonic stem cells. Cell. 2006;125:315–326. doi: 10.1016/j.cell.2006.02.041. [DOI] [PubMed] [Google Scholar]
- 24.Sachs M, Onodera C, Blaschke K, Ebata KT, Song JS, Ramalho-Santos M. Bivalent chromatin marks developmental regulatory genes in the mouse embryonic germline in vivo. Cell Rep. 2013;3:1777–1784. doi: 10.1016/j.celrep.2013.04.032. [DOI] [PMC free article] [PubMed] [Google Scholar]
- 25.Nagatake M, Osada H, Kondo M, Uchida K, Nishio M, Shimokata K, Takahashi T, Takahashi T. Aberrant hypermethylation at the bcl-2 locus at 18q21 in human lung cancers. Cancer Res. 1996;56:1886–1891. [PubMed] [Google Scholar]
- 26.Hector S, Conlon S, Schmid J, Dicker P, Cummins RJ, Concannon CG, Johnston PG, Kay EW, Prehn JH. Apoptosome-dependent caspase activation proteins as prognostic markers in Stage II and III colorectal cancer. Br J Cancer. 2012;106:1499–1505. doi: 10.1038/bjc.2012.133. [DOI] [PMC free article] [PubMed] [Google Scholar]
- 27.Perraud A, Akil H, Nouaille M, Petit D, Labrousse F, Jauberteau MO, Mathonnet M. Expression of p53 and DR5 in normal and malignant tissues of colorectal cancer: correlation with advanced stages. Oncol Rep. 2011;26:1091–1097. doi: 10.3892/or.2011.1404. [DOI] [PubMed] [Google Scholar]
- 28.Poincloux L, Durando X, Seitz JF, Thivat E, Bardou VJ, Giovannini MH, Parriaux D, Barriere N, Giovannini M, Delpero JR, Monges G. Loss of Bcl-2 expression in colon cancer: a prognostic factor for recurrence in stage II colon cancer. Surg Oncol. 2009;18:357–365. doi: 10.1016/j.suronc.2008.09.003. [DOI] [PubMed] [Google Scholar]
- 29.Strater J, Hinz U, Hasel C, Bhanot U, Mechtersheimer G, Lehnert T, Moller P. Impaired CD95 expression predisposes for recurrence in curatively resected colon carcinoma: clinical evidence for immunoselection and CD95L mediated control of minimal residual disease. Gut. 2005;54:661–665. doi: 10.1136/gut.2004.052696. [DOI] [PMC free article] [PubMed] [Google Scholar]
- 30.Chen X, Wong P, Radany E, Wong JY. HDAC inhibitor, valproic acid, induces p53-dependent radiosensitization of colon cancer cells. Cancer Biother Radiopharm. 2009;24:689–699. doi: 10.1089/cbr.2009.0629. [DOI] [PMC free article] [PubMed] [Google Scholar]
- 31.Flatmark K, Nome RV, Folkvord S, Bratland A, Rasmussen H, Ellefsen MS, Fodstad O, Ree AH. Radiosensitization of colorectal carcinoma cell lines by histone deacetylase inhibition. Radiat Oncol. 2006;1:25. doi: 10.1186/1748-717X-1-25. [DOI] [PMC free article] [PubMed] [Google Scholar]
- 32.Wu X, Liu W, Cao Q, Chen C, Chen Z, Xu Z, Li W, Liu F, Yao X. Inhibition of Aurora B by CCT137690 sensitizes colorectal cells to radiotherapy. J Exp Clin Cancer Res. 2014;33:13. doi: 10.1186/1756-9966-33-13. [DOI] [PMC free article] [PubMed] [Google Scholar]
- 33.Kim JC, Shin ES, Kim CW, Roh SA, Cho DH, Na YS, Kim TW, Kim MB, Hyun YL, Ro S, Kim SY, Kim YS. In vitro evaluation of histone deacetylase inhibitors as combination agents for colorectal cancer. Anticancer Res. 2009;29:3027–3034. [PubMed] [Google Scholar]
Associated Data
This section collects any data citations, data availability statements, or supplementary materials included in this article.