Abstract
Mast cells are primary effectors in allergic reactions, and may have significant roles in diseases by secreting histamine and various inflammatory and immunomodulatory substances1,2. While classically they are activated by IgE antibodies, a unique property of mast cells is their antibody-independent responsiveness to a range of cationic substances, collectively called basic secretagogues, including inflammatory peptides and drugs associated with allergic-type reactions1,3. Roles for these substances in pathology have prompted a decades-long search for their receptor(s). Here we report that basic secretagogues activate mouse mast cells in vitro and in vivo through a single receptor, MrgprB2, the orthologue of the human G-protein coupled receptor (GPCR) MrgprX2. Secretagogue-induced histamine release, inflammation, and airway contraction are abolished in MrgprB2 null mutant mice. Further, we show that most classes of FDA-approved peptidergic drugs associated with allergic-type injection-site reactions also activate MrgprB2 and MrgprX2, and that injection-site inflammation is absent in mutant mice. Finally, we determine that MrgprB2 and MrgprX2 are targets of many small molecule drugs associated with systemic pseudo-allergic, or anaphylactoid, reactions; we show that drug-induced symptoms of anaphylactoid responses are significantly reduced in knockout mice, and we identify a common chemical motif in several of these molecules that may help predict side effects of other compounds. These discoveries introduce a mouse model to study mast cell activation by basic secretagogues and identify MrgprX2 as a potential therapeutic target to reduce a subset of drug-induced adverse effects.
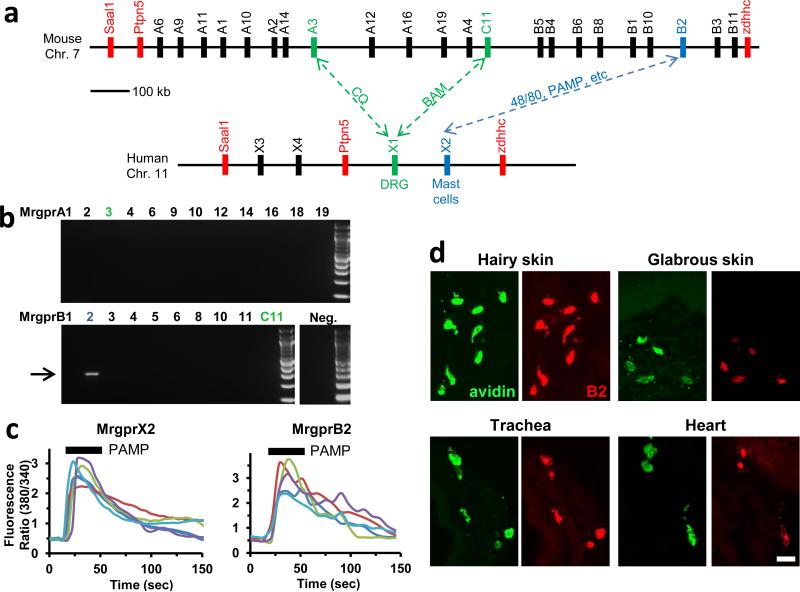
Responsiveness to basic secretagogues is conserved among mammals4, and also is found in birds5, indicating an ancient, fundamental role for its mechanism. Many basic secretagogues are endogenous peptides, often linked to inflammation; however, they activate connective tissue mast cells only at high concentrations and independent of their canonical receptors, so another mechanism of stimulation must exist6. Several candidates which bind polycationic compounds have been proposed as basic secretagogue receptors6-9. Among these, MrgprX2 has been screened with the most compounds8,10-14, and siRNA knockdown studies support at least a partial role for MrgprX2 in activation by four non-canonical basic secretagogues11,13. However, no direct in vivo study or knockout model has been employed for any candidate. The investigation of MrgprX2 in mice is complicated because the gene cluster containing the four human MrgprX members is dramatically expanded in mice, consisting of 22 potential coding genes, many with comparable sequence identity to MrgprX2 (Fig. 1a). Therefore, a mouse MrgprX2 orthologue must be determined by expression pattern and pharmacology. A stringent RT-PCR screen in mouse primary mast cells uncovered a band for a single family member, MrgprB2 (Fig. 1b), while MrgprX1 orthologues were not expressed at relevant levels (Extended Data Fig. 1a,b). Functionally, HEK293 cells heterologously expressing MrgprB2 (MrgprB2-HEK) responded to the MrgprX2 agonist PAMP (9-20)14 (Fig. 1c) and Compound 48/80 (48/80), a classical mast cell activator and canonical basic secretagogue (Extended Data Fig. 2). MrgprB2-HEK cells also responded to other MrgprX2 ligands, including the basic secretagogue Substance P, but had no response to the MrgprX1 ligand chloroquine (CQ)15; no closely related family members in mice responded to any compound (Extended Data Fig. 1c, 2a,c). To determine the expression of MrgprB2, we generated MrgprB2 BAC transgenic mice in which the expression of eGFP-Cre recombinase was under the control of the MrgprB2 promoter. Strikingly, Cre expression patterns indicate that MrgprB2 expression is highly specific to connective tissue mast cells (Fig. 1d; Extended Data Fig. 3 and 4). Together the pharmacological and expression data strongly suggest that MrgprB2 is the mouse orthologue of MrgprX2.
Figure 1. MrgprB2 is the orthologue of human MrgprX2.
a. Diagram of mouse and human Mrgpr genomic loci. Mouse MrgprA3 and MrgprC11 are orthologues of human MrgprX1, determined by expression and ligand specificity15. The MrgprX2 orthologue MrgprB2 is described in this study.
b. Results from a stringent RT-PCR screen identifying MrgprB2 transcript (arrow) in mouse peritoneal mast cells. The negative control (Neg.) omitted reverse transcriptase.
c. Example traces of intracellular calcium concentrations [Ca2+]i, measured by ratiometric Fura-2 imaging, from MrgprB2-HEK or MrgprX2-HEK cells exposed to 20 μM PAMP(9-20) (duration indicated by black line). Each trace is a response from a unique cell.
d. Representative confocal images from BAC transgenic mouse tissues in which tdTomato expression is controlled by eGFP-Cre expression from the MrgprB2 locus (see methods). Avidin staining was used to identify mast cells. Percentages of avidin-positive mast cells that also were tdTomato-positive: glabrous skin, 97.5%; hairy skin, 90.1%; trachea, 97.2%; heart, 87.1%. Percentages of tdTomato-positive cells that also were avidin-positive: glabrous skin, 99.2%; hairy skin, 100%; trachea, 98.3%; heart, 99%. n=3 mice and >300 cells counted/tissue, except n=2 and >100 cells/heart. Scale bar 20 μm.
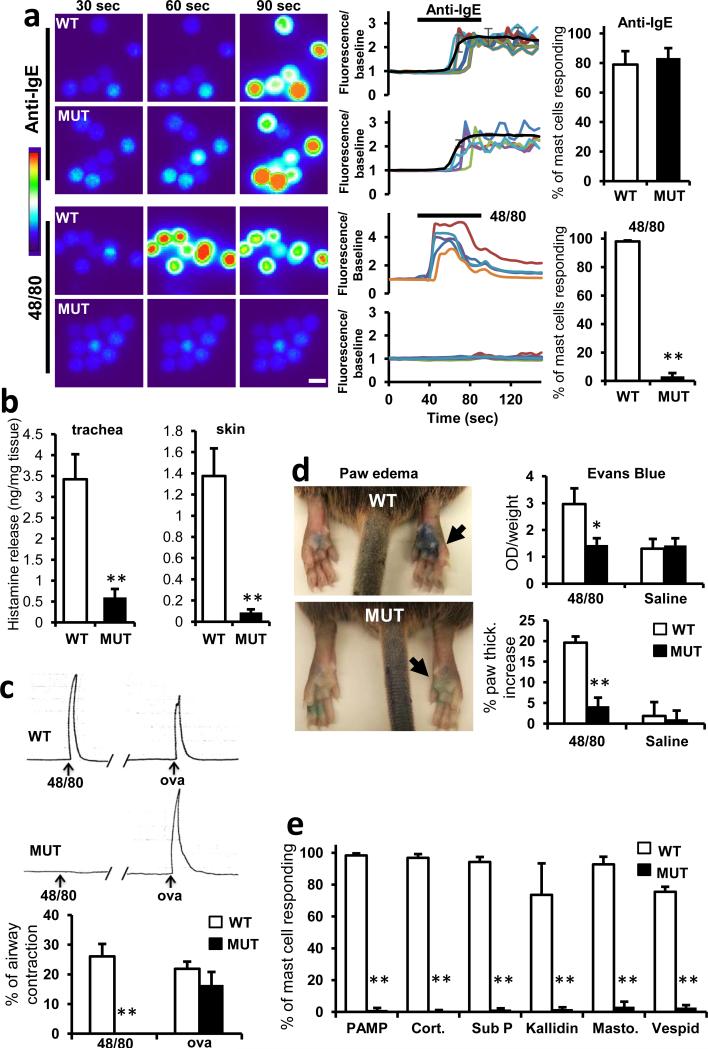
Next, we determined whether MrgprB2 is the basic secretagogue receptor in mouse mast cells. The MrgprB2 genomic locus contains too much repetitive sequence to permit gene targeting through homologous recombination (Extended Data Fig. 5a). Therefore, we used a zinc finger nuclease-based strategy to generate a mouse line with a 4 base pair deletion in the MrgprB2 coding region (MrgprB2MUT mice), resulting in a frameshift mutation and early termination shortly after the first transmembrane domain (Extended Data Fig. 5b-d). The mutation was stable and inheritable (Extended Data Fig. 5c), so we regard MrgprB2MUT as a functional null. Mast cell numbers were comparable in tissues of wild-type (WT) and MrgprB2MUT mice, indicating that MrgprB2 is not essential for mast cell survival or targeting to tissue (Extended Data Fig. 6a). Responsiveness of peritoneal mast cells to anti-IgE antibodies (Fig. 2a) and endothelin (Extended Data Fig. 7) also was comparable, demonstrating that MrgprB2 mutation does not globally impair IgE or GPCR-mediated mast cell signaling. However, 48/80-induced mast cell activation (Fig. 2a) and tissue histamine release essentially was abolished in mutant mast cells (Fig. 2b; Extended Data Fig. 6b). Further, we found that 48/80-evoked tracheal contraction (Fig. 2c) and hindpaw inflammation (extravasation and swelling; Fig. 2d) were almost completely absent in an MrgprB2MUT background, while antigen (Fig. 2c) and anti-IgE evoked responses (Extended Data Fig. 8) were comparable to WT mice. Finally, we found that four additional basic secretagogues, as well as MrgprX2 agonists PAMP (9-20) and cortistatin10, strongly activated WT but not MrgprB2MUT mast cells (Fig. 2e; Extended Data Fig. 9a). HEK293 cells expressing MrgprB2 or MrgprX2 (MrgprX2-HEK) also responded to these secretagogues (Extended Data Fig. 2). Taken together, we conclude that MrgprB2 is the mouse mast cell basic secretagogue receptor. It is likely that the list of small, basic peptides that activate MrgprB2 is greater than the number in this study; indeed, dozens of such peptides have been shown to activate mast cells3,6,16,17. Notably, human MrgprX2 is much more sensitive to Substance P than mouse MrgprB2 (Extended Data Fig. 2c), suggesting a potential species-specific role for Substance P in mast cell signaling.
Figure 2. MrgprB2 is the mouse mast cell basic secretagogue receptor.
a. Left, representative Fluo-4 fluorescence heat map images of mouse peritoneal mast cells showing changes in [Ca2+]i induced by bath application of anti-IgE (5 μg/ml) or 48/80 (10 μg/ml). Middle, representative imaging traces. Each color line represents an individual cell. Black lines in “anti-IgE” panels are average traces for each genotype. Note: [Ca2+]i traces are similar between WT and MUT groups. Right, quantification of responding cells (n=3/genotype; >150 cells counted/condition). Anti-IgE responses were not significantly different. Scale bar 10 μm.
b. Histamine release into the supernatant from trachea and abdominal skin from WT and MrgprB2MUT mice after exposure to 48/80 (30 μg/ml) for 30 minutes at 37°C. n = 5/trachea, n= 8/skin.
c. Top, representative traces showing contractions of trachea isolated from WT and MrgprB2MUT mice (previously sensitized to ovalbumin (ova), in response to 48/80 (30 μg/ml) or ova (10 μg/ml; i.e. IgE-dependent). Bottom, average data; maximum total contraction determined as response to 10 μM carbamycholine added at the end of the experiment. n=5 for 48/80 WT, 3 for 48/80 MrgprB2MUT.
d. Left, representative images of Evans Blue extravasation 15 minutes after intraplantar injection of 48/80 (right, arrow, 10 μg/ml, 5 μl in saline) or saline (left). Right, quantification of Evans Blue leakage into the paw and paw thickness increase after 15 minutes. *, p<0.02 (n=5/ WT, n=6/MrgprB2MUT). Differences after saline injection were not significant.
e. Quantification of WT and MrgprB2MUT mast cell responsiveness to MrgprX2 ligands and basic secretagogues, assayed using Fluo-4 imaging. Concentrations of substances (in μM): PAMP(9-20), 20; cortistatin-14 (cort.), 20; Substance P (sub P), 200; kallidin, 200; mastoparan (masto., a component of wasp venom), 20; vespid mastoparan, 20. n=3/genotype; >150 cells counted/secretagogue.
Data are presented as mean ± standard error of mean (SEM). Two-tailed unpaired Student's t test was used to determine significance in statistical comparisons, and differences were considered significant at p<0.05. *, p < 0.05. **, p<0.01 unless noted.
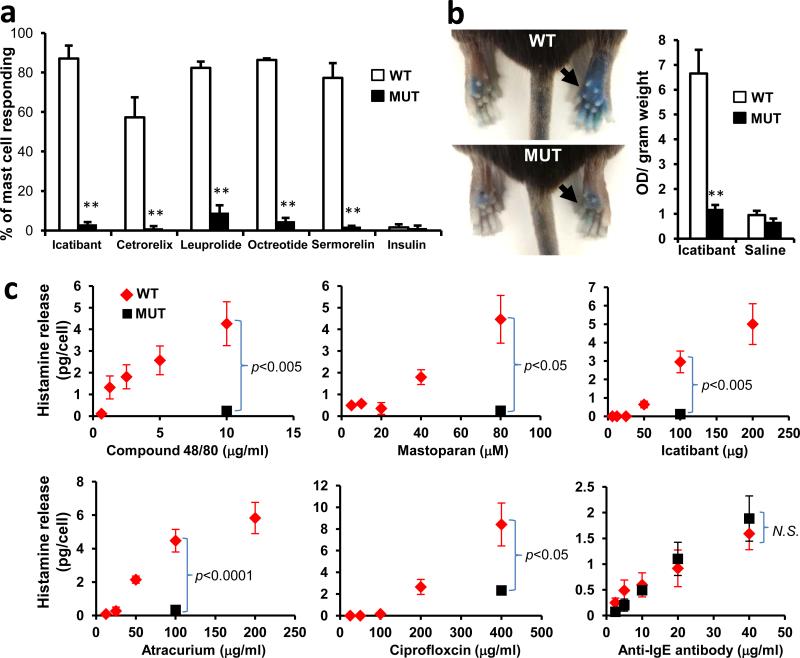
We next considered whether MrgprB2 factors in allergic-type reactions. We specifically addressed drug-induced reactions because many therapeutic drugs are cationic. Up to 15% of drug-induced adverse reactions appear to be allergic in nature; however, many are not well-correlated with IgE antibody titer, indicating that antibody-independent, or pseudo-allergic, mechanisms participate18. We focused first on peptidergic drugs because most are introduced subcutaneously or intramuscularly at millimolar concentrations (Supplementary Information), high enough for cationic peptides to activate mast cells. The most frequent allergic-type response described in FDA labels of these drugs is an injection-site reaction (ISR), a local swelling and/or flare of variable size which can be accompanied by pain or pruritus. In a survey of FDA-approved peptidergic drugs, we found that the vast majority associated with ISRs are cationic (Supplementary Information). We found that representative members of all common, commercially available classes of these cationic drugs activated mast cells in an MrgprB2-dependent manner, while the innocuous protein insulin had no effect (Fig. 3a; Extended Data Fig. 9b,c). Consistently, all of these peptides except insulin activate both MrgprB2-HEK and MrgprX2-HEK cells (Extended Data Fig. 2). We selected the drug icatibant for further study because it induces ISRs nearly in every patient19. Icatibant at the clinical concentration induced extensive extravasation and swelling, similar to human ISRs, in WT mice but not in MrgprB2MUT mice (Fig. 3b). Mice pretreated with the mast cell stabilizer ketotifen also showed no inflammation (without ketotifen: 40.7±2.1% increase in paw thickness; with ketotifen: 3.1±0.6% increase; n=4 each; p=2.2e-6), strongly indicating that mast cells mediated the inflammation. Furthermore, icatibant (as well as positive controls 48/80 and mastoparan) induced histamine release from WT peritoneal mast cells, while MrgprB2MUT mast cells released substantially less (Fig. 3c). However, IgE-mediated histamine release was unaffected by MrgprB2 deletion (Fig. 3c). These data anticipate that drug-induced ISRs may be alleviated by targeting MrgprX2 or by using peptides with less potent MrgprX2 agonist properties.
Figure 3. MrgprB2 mediates mast cell responsiveness and side effects of peptidergic therapeutic drugs.
a. Percentage of responding cells from WT and MrgprB2MUT peritoneal mast cells after drug application, assayed using Fluo-4 imaging. Concentrations of drugs (in μg/ml): icatibant, 50; cetrorelix, 20; leuprolide, 100; octreotide, 10; sermorelin, 60; insulin, 80. n=3/genotype; >150 cells counted/substance, except >100 cells counted for insulin. Difference between insulin responsiveness was not significant.
b. Left, representative images of Evans Blue extravasation 15 minutes after intraplantar injection of icatibant (right, arrow, 10 mg/ml, 5 μl in saline) or saline (left). Right, quantification of Evans Blue leakage into the paw after 15 minutes. n=6/genotype. Difference after saline injection was not significant.
c. Total histamine release from WT (red diamonds) and MrgprB2MUT (black squares) mice after incubation with named substances. Note: no significant difference between WT and MrgprB2MUT cells was found at any dose of anti-IgE antibody. Experiments were repeated >3 times.
Data are presented as mean ± SEM. Two-tailed unpaired Student's t test: *, p < 0.05. **, p<0.01.
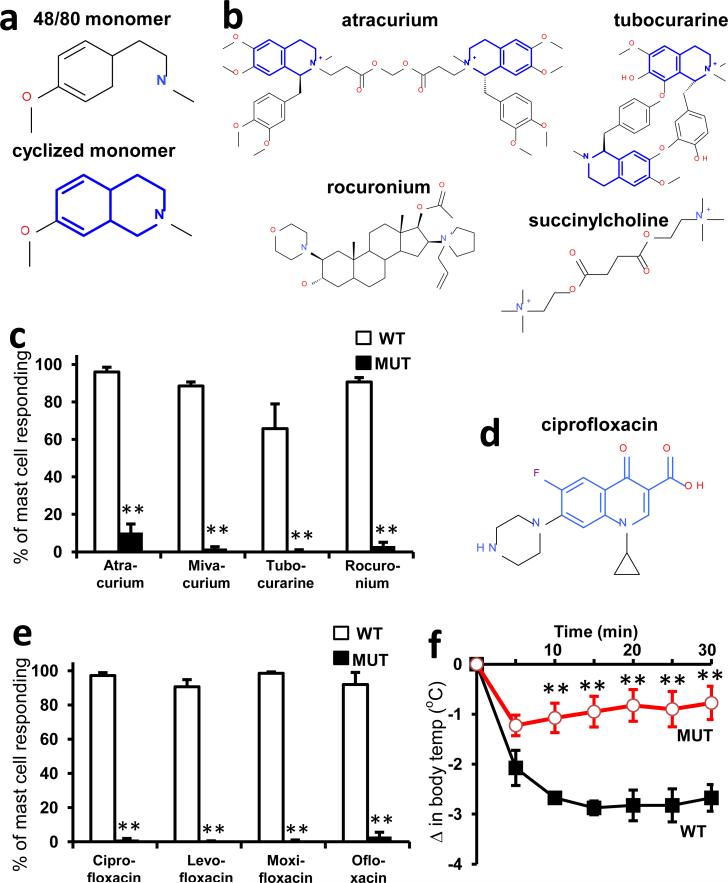
We explored next the possibility that MrgprB2 mediates pseudo-allergic reactions induced by small molecules. We focused on intravenously applied drugs because they often are administered rapidly and in high doses, and thus are more likely to achieve high blood concentrations and rapid tissue distribution than drugs administered through other routes. Symptoms of pseudo-allergic reactions after intravenous administration, which at the most severe are called anaphylactoid, include skin flushing or rash, changes in blood pressure or heart rate, and bronchospasms20. We based our initial search on the structure of 48/80. While the structure-function relationship of 48/80 as an MrgprX2 agonist is unknown, a cyclized variant containing a tetrahydroisoquinoline (THIQ) motif (Fig. 4a) is reported to be seven times more potent than 48/80 as a mast cell degranulator21. A search of FDA-approved drugs containing a THIQ recovered members of the nicotinic receptor antagonist non-steroidal neuromuscular blocking drugs (NMBDs), including tubocurarine and atracurium (Fig. 4b). NMBDs are used routinely in surgery to reduce unwanted muscle movement and allow intratracheal intubation for mechanical ventilation. Intriguingly, NMBDs alone are responsible for nearly 60% of allergic reactions in a surgical setting22, and all except succinylcholine induce histamine release in humans23. We found that members of all NMBD families (Supplemental Information) except succinylcholine activated mast cells in an MrgprB2-dependent manner at concentrations as low as 0.5% of the clinical injection concentration (Fig. 4c; Extended Data Fig. 9d). Interestingly, rocuronium does not contain a THIQ but has a bulky hydrophobic group with a charged nitrogen within several angstroms (Fig. 4b), reminiscent of 48/80. Therefore, we searched using modifications of the THIQ motif and the 48/80 structure, including changes in cyclization and position of the positive or polar nitrogen, limiting our assay to intravenous drugs at high injection concentrations. We identified the fluoroquinolone family of antibiotics as having a similar motif (Fig. 4d). Like NMBDs, these are associated with allergic-type reactions24,25 and can activate mast cells26,27. We found that the four members approved for intravenous use activated MrgprB2-HEK and MrgprX2-HEK cells (Extended Data Fig. 2), and mast cells in an MrgprB2- dependent manner (Fig. 4e; Extended Data Fig. 9e). Correspondingly, atracurium and ciprofloxacin induced histamine release in WT peritoneal mast cells and substantially less in MrgprB2MUT mast cells (Fig. 3c). We selected ciprofloxacin for in vivo tests of anaphylaxis, which in mice is measured most often by a drop in body temperature, likely due to changes in blood pressure and peripheral vasodilation28. Rodents nearly are immune to histamine toxicity at a systemic level, contrary to other experimental organisms4, but can be rendered sensitive to mast cell activators and secreted products by pretreatment with beta-adrenergic blockers29,30. Under these conditions, a high dose of ciprofloxacin induced a rapid drop in body temperature that was very slow to recover, while MrgprB2MUT mice showed a much smaller drop that recovered quickly (Fig. 4f). These results establish that mast cell activation through MrgprB2 is an off-target effect of fluoroquinolones and other drugs.
Figure 4. MrgprB2 mediates mast cell responsiveness and side effects of small molecule therapeutic drugs.
a. Structures of 48/80 and a cyclized variant. The THIQ motif is highlighted in blue.
b. Structures of representative members of all NMBD classes (see Supplementary Information). THIQ motifs highlighted in blue. Note that only succinylcholine lacks a bulky hydrophobic group.
c. Percentage of responding cells from WT and MrgprB2MUT peritoneal mast cells after application of various NMBDs, assayed using Fluo-4 imaging. Concentrations of drugs (in μg/ml): atracurium, 50; mivacurium, 20; tubocurarine, 30; rocuronium, 500. n=3 mice /genotype; >150 cells counted/substance.
d. Structure of ciprofloxacin, with the motif common to all fluoroquinolones highlighted in blue. Note nitrogens close to the quinolone motifs.
e. Percentage of responding cells from WT and MrgprB2MUT peritoneal mast cells after fluoroquinolone application, assayed using Fluo-4 imaging. Concentrations of drugs (in μg/ml): ciprofloxacin, 200; levofloxacin, 500; moxifloxacin, 160; ofloxacin, 400. n=3 mice/genotype; >150 cells counted/substance.
f. Changes in body temperature after intravenous injection of ciprofloxacin (1.5 mg in 125 μl saline) at time 0. n=4 mice/genotype.
Data are presented as mean ± SEM. Two-tailed unpaired Student's t test: *, p < 0.05. **, p<0.01.
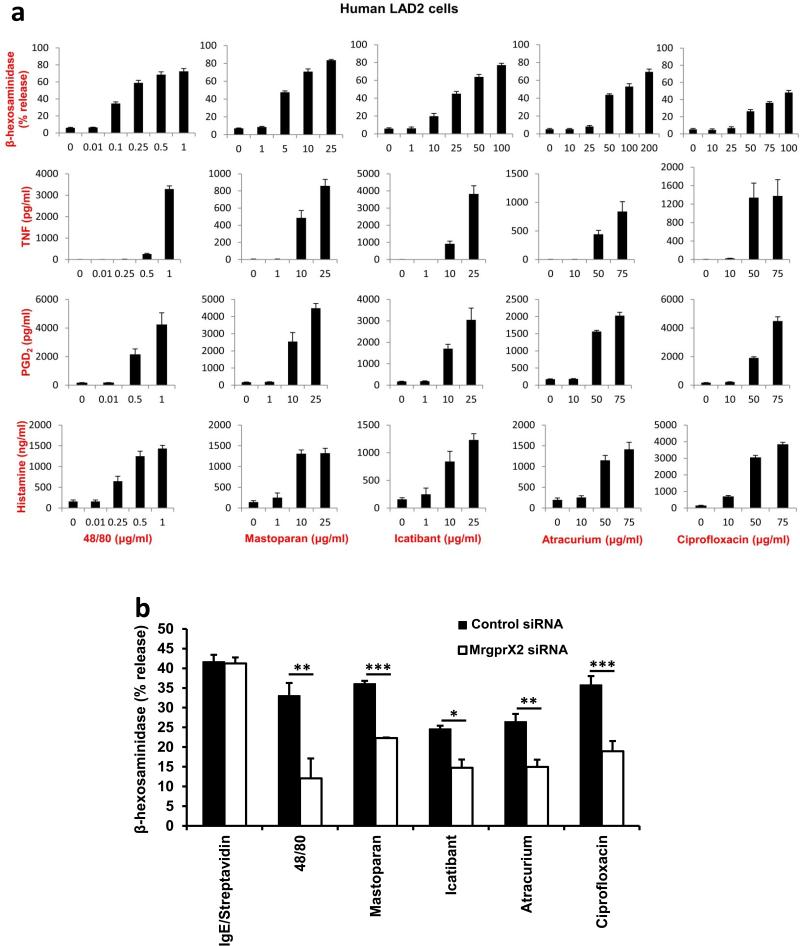
Finally, we determined whether drugs associated with pseudo-allergies activate human mast cells through MrgprX2. We found that representative members of each examined drug class evoked release of histamine, TNF, PGD2, and β-hexosaminidase from LAD2 cells (Extended Data Fig. 10a). 48/80 and mastoparan were used as positive controls. Importantly, MrgprX2 siRNA-treated LAD2 cells exhibited significantly less β-hexosaminidase release evoked by these substances, compared to responses in control siRNA-treated cells, while IgE-mediated release was comparable (Extended Data Fig, 10b). The remaining release observed in MrgprX2 siRNA-treated cells are likely due to incomplete mRNA and/or protein knockdown.
Knowledge of the role of MrgprX2 in drug-induced pseudo-allergies may expand further, for two reasons. First, ligand binding requirement studies should enable more specific screens for drugs that cross-activate MrgprX2. Second, screening orally administered drugs may uncover more MrgprX2 ligands, since common side effects of orally administered drugs include gastrointestinal problems and headache, both which may have a mast cell component.
Methods
Animal models
All experiments were performed in accordance with a protocol approved by the Animal Care and Use Committee at the Johns Hopkins University School of Medicine. All experiments involving equal treatments in WT and mutant samples and animals were conducted by experimenters blind to conditions.
Analysis
Group data were expressed as mean ± standard error of the mean. Two-tailed unpaired Student's t test was used to determine significance in statistical comparisons, and differences were considered significant at p < 0.05. Statistical power analysis was used to justify the sample size. We assumed the data were normally distributed since the most outcome values were symmetrically distributed around the mean value within each group. The variance is similar between groups determined by the F test. Mast cells deemed to be damaged, either by visible lack of fibronectin adherence or by abnormally high resting calcium levels, were excluded from analysis. Otherwise, no samples or animals subjected to successful procedures and/or treatments were excluded from the analysis. No randomization was used for animal studies since it is not applicable for the studies.
Peptides and drugs
Compound 48/80, vespid mastoparan, rocuronium, tubocurarine, ciprofloxacin, levofloxacin, moxifloxacin, and ofloxacin were from Sigma. Cortistatin was from Tocris Biosciences. PAMP (9-20) was custom synthesized and purified to ≥98% by Genscript. Leuprolide was from Genscript. Substance P, kallidin, mastoparan, cetrorelix, octreotide, sermorelin (growth hormone releasing factor 1-29), icatibant (HOE-140) were from Anaspec. Atracurium and mivacurium were from Santa Cruz Biotechnology. Recombinant human insulin was from Roche. Goat anti-mouse IgE (Ab9162) was from Abcam.
Drug preparation and storage
Atracurium, mivacurium, tubocurarine, and all fluoroquinolone solutions were prepared on the day of the experiment because the potencies of the first three were found to be susceptible to oxidation and/or freeze-thaw effects, while the solubility of the fluoroquinolones was best when prepared fresh. Propranolol also was prepared fresh on the day of the experiment to minimize the chances of a loss in potency. All fluoroquinolones except levofloxacin were dissolved into CIB adjusted to pH 3.5. All other drugs were prepared as 100X-1000X aliquots and stored at −80° before thawing at and 4°C and diluting into calcium imaging buffer or saline.
Mrgpr RT-PCR screen
RNA was purified from 4 X 10⁴ mouse peritoneal mast cells with a Qiagen RNEasy Micro column, according to the manufacturer's suggestions. RNA was treated for 20 minutes with DNAse I (New England BioLabs) and re-purified on another RNEasy Micro column. 8 ng of RNA was used to generate first strand cDNA using a SuperScript III kit (Invitrogen) according to the manufacturer's instructions, using oligo dT primers and scaling the recommended 10 μl reaction up to 60 μl. The negative control reaction was the same except that SuperScript III reverse transcriptase was replaced by water. 25 μl PCR reactions were run with 12.5 μl RedTaq ReadyMix (Sigma), 0.5 μl DMSO, 0.25 μl each of 50 μM gene-specific forward and reverse primers, 10 μl water, and 2 μl mixture from the cDNA or negative control synthesis reactions. All reactions used a 4 minute initial step at 95°C, 30 seconds annealing at specific temperatures (described below), 40 seconds extension at 72°C, and 25 seconds at 95°C (with the last three steps repeated 39 times), and a final 4 minute step at 72°C. Low stringency PCR was set to 60 annealing; otherwise, annealing temperatures were: 62°C for MrgprA1, MrgprA10, and MrgprB6; 64°C for MrgprA2, MrgprA3, MrgprA4, MrgprA6, MrgprA16, MrgprA18, MrgprB2, and MrgprB11; 65°C MrgprA9, MrgprA19, MrgprB1, MrgprB3, MrgprB5, for MrgprC11. for and MrgprB8; 66°C for MrgprA12 and MrgprB10; 63°C for MrgprB4; 61°C for MrgprA14; and 65.5°C Primers were as follows. MrgprA1 (for atccagcaagaggaatgggg, rev tgtgacctaggaggaagaagaag); MrgprA2 (for cctcctacacaagccagcaa, rev aagcacaagtgaaagatgatgct); MrgprA3 (for gctacatccagcaagaggaatg, rev gcaaaaattcctttgggtagggt); MrgprA4 (for cctgtgtgctgtgatctggt, rev tcacggttaatccagggcac); MrgprA6 (for cattttcctcccccaacagt, rev atgcctgaatgagcccacaa); MrgprA9 (for cagtgatctacatccagcaaaagg, rev gcgtggaagctatgatgcga); MrgprA10 (for cagtggtccaccatctccaa, rev acaggcaagagagtcatggtt); MrgprA12 (for tcagggatcgggtgaagcac, rev gagcatttgaaggtgttgttgga); MrgprA14 (for ggttgcccctgtgtttcttc, rev tattgccagtcagtaagctgag); MrgprA16 (for gccctctggttcccattact, rev gtttttggaccactgaggcatt); MrgprA18 (for tgctctggttttctcctttgc, rev tgaggcatgtcaagtcagtca); MrgprA19 (for caggacccagatcacgacac, tcctgggcttccgatttcac); MrgprB1 (for attagccttcatcaggcacca, ccagcccaactaaggcaatg); MrgprB2 (for gtcacagaccagtttaacacttcc, cagccatagccaggttgagaa); MrgprB3 (for acctggctgtggctgatttt, rev gctgaacccacagagaacca); MrgprB4 (for tctggctggtgctgatttctt, rev accacgaggctcaacaataga); MrgprB5 (for ctgtggttccttctgtgtcca, rev tttccagttccccagaccttt); MrgprB6 (for tctgtctacatcctcaacctgg, rev attatctcatgaggaaggctcaa); MrgprB8 (for agagaatgcaaagcatgcga, rev gaggaagtttgccccagaca); MrgprB10 (for cactggtcacattgccaacc, rev ggggatggaatcaatgtccaaga); MrgprB11 (for accttcttgctatttttccctcca, rev aggatgagactggacccaca); MrgprC11 (for cagcacaagtcagctcctcaa, rev atgcccatgagaaaggacagaacc).
Expression Constructs
Mrgpr genes were cloned and inserted into the pcDNA3.1 mammalian expression plasmid using standard techniques. All mouse genes had a Kozak sequence at their N-terminus and also encoded a C-terminal FLAG tag separated from the genes by the amino acid linker DIIL.
cDNA constructs
First strand cDNA was prepared as described for RT-PCR screens, and amplification was performed using the Q5 HotStart High Fidelity Master Mix (New England Biolabs). At least five different clones each prepared from wild type and mutant mice were sequenced to verify the presence of the deletion in the mutant and the absence of any other mutation from wild type or mutant.
Calcium imaging in HEK293 cells
In initial screens, HEK293 cells (not tested for mycoplasma but rapidly dividing) were transiently transfected with gene constructs including a C-terminal FLAG tag, and plated on 100 μg/ml poly-D-lysine coated glass cover slips six hours after transfection. 24 hours later, cells were loaded with AM esters of the calcium indicators Fura-2 or Fluo-4 (Molecular Probes) along with 0.02% Pluronic F-127 (Molecular Probes) for 45 minutes at 37°C. Fura-2 loaded cells were imaged during 340 and 380 nm excitation, and Fluo-4 loaded cells were imaged during 488 nm excitation. Later experiments utilized cell lines stably expressing receptors along with transient or stable expression of the promiscuous G protein Galpha15. Cells were imaged in calcium imaging buffer (CIB; NaCl 125 mM, KCl 3 mM, CaCl2 2.5 mM, MgCl2 0.6 mM, HEPES 10 mM, glucose 20 mM, NaHCO3 1.2 mM, sucrose 20 mM, brought to pH 7.4 with NaOH). Unless otherwise specified, drugs were perfused into the chamber for 45 to 60 seconds and responses were monitored at 5-second intervals for an additional 60-90 seconds.
EC50 determination
HEK293 cells stably expressing Galpha15 and either MrgprB2 or MrgprX2 were plated at 4X10⁴ cells per well in 96-well plates and incubated overnight. The next day, media was removed and replaced with imaging solution from the FLIPR Calcium 5 assay kit (Molecular Devices), diluted according to manufacturer's suggestions in Hank's Balanced Salt Solution (HBSS) with 20 mM HEPES, pH 7.4. Cells were incubated at 37°C for 60 minutes, and allowed to recover for 15 minutes at room temperature before imaging in a Flexstation 3 (Molecular Devices). Wells were imaged according to manufacturer's specifications for 120 seconds, with 50 μl of test substances at 3X concentration added 30 seconds after imaging began. Responses were determined by subtracting the minimum signal from the maximum signal. Substances were tested in duplicate wells, the signals were averaged, and EC50s were determined for each trial by normalizing to the peak response to the substance in that trial. All drugs were dissolved in HBSS+HEPES solution, with the following exceptions due to solubility issues: cetrorelix acetate was dissolved in saline containing 2.5 mM CaCl2 and 0.6 mM MgCl2, and fluoroquinolones except ofloxacin were dissolved in the same solution except that the pH was adjusted with HCl to 3.5; ofloxacin required 100 μg/ml of lactic acid for full solubility. We also noticed that peptides sometimes lost potency after a freeze-thaw cycle, so most peptides were prepared directly from lyophilized stock.
Peritoneal mast cell purification and imaging
Adult male and female mice 2-5 months of age were sacrificed through CO2 inhalation. A total of 12 mls of ice cold mast cell dissociation media (MCDM; HBSS with 3% fetal bovine serum and 10 mM HEPES, pH 7.2) were used to make two sequential peritoneal lavages, which were combined and cells were spun down at 200g. The pellet from each mouse was resuspended in 2 mls MCDM, layered over 4 mls of an isotonic 70% Percoll suspension (2.8 mls Percoll, 320 μls 10X HBSS, 40 μl 1 M HEPES, 830 μl MCDM), and spun down for 20 minutes, 500g, 4°C. Mast cells were recovered in the pellet. Purity was > 95%, as assayed by avidin staining and by morphology. Mast cells were resuspended at 5 X 10⁵ – 1 X 10⁶ cells/ml in DMEM with 10% fetal bovine serum and 25 ng/ml recombinant mouse stem cell factor (Sigma), and plated onto glass cover slips coated with 30μg/ml fibronectin (Sigma). For counting, instead of plating, suspended mast cells were diluted 1/10 and affixed to slides by spinning at 1000 rpm for 5 minutes at 4°C on a CytoSpin (Thermo Scientific).
For imaging, after two hours of incubation at 37°C, 5% CO2, mast cells were loaded with Fluo-4 along with 0.02% Pluronic F-127 for 30 minutes at room temperature, washed 3 times in CIB and used immediately for imaging. Cells were used within two hours of loading. Cells were identified as responding if the [Ca2+]i rose by at least 50% for at least 10 seconds, which clearly distinguishes a ligand-induced response from random flickering events. Average traces were calculated by taking the average response from each cell in a mouse, and averaging those.
BAC transgenic mice generation
We purchased the BAC clone RP23-65I23 from Children's Hospital Oakland Research Institute. This clone contains the MrgprB2 locus, ~60 kb of 5’ genomic sequence and over 100 kb of 3’ genomic sequence. Recombineering in bacteria was used to introduce eGFP-Cre and a polyA signal immediately after the MrgprB2 start codon1. The BAC was linearized with NotI (New England Biolabs) and injected into pronuclei from single cell fertilized C57Bl/6 eggs. Eggs were implanted into pseudopregnant females. Three BAC mouse lines were established. Though mice were already in a C57Bl/6 background, they were crossed for at least four generations to WT and tdTomato reporter mice in the C57Bl/6 background before use in experiments. BAC mice were mated to ROSA26Tdtomato mice purchased from Jackson Labs for imaging studies. Experiments for Figure 1 used mice homozygous for ROSA26Tdtomato because the tdTomato signal often was heterogeneous and weak in heterozygous mice. Genotyping reactions for BAC mice were run at 61°C annealing, and primers were: forward, tatatcatggccgacaagca; reverse, cagaccgcgcgcctgaaga. Both primers are in the eGFP-Cre reading frame but the entire gene and correct placement in the MrgprB2 locus was verified by previous sequencing.
MrgprB2 mutant mice generation
mRNAs encoding zinc finger nucleases targeting MrgprB2 were purchased from Sigma. The binding sites were GTTCCTGGGCATCCG and TGCACACGAATGCCTTCACTG, corresponding to bases 180-194 and 196-216, respectively, of the MrgprB2 open reading frame. mRNA was diluted to 2 ng/ml in 1 mm Tris–HCl buffer, pH 7.4, with 0.25 mm EDTA, and injected into the pronuclei of single cell fertilized eggs in the C57Bl/6 strain. No overt signs of toxicity were observed. Embryos were implanted into pseudopregnant females. DNA flanking the binding sites was amplified from founder mice and screened for mutations using the Cel-1 assay kit (Transgenomics), according to the manufacturer's suggestions. 3 of the first 28 mice were identified and confirmed by DNA sequencing to carry small mutations, and no more screening was performed. In addition to the 4 bp mutation used in this study, a mouse carrying a 1 bp deletion and another with a 2 bp deletion were identified.
Wild type and MrgprB2MUT mouse genotyping
Primers used for wild type mice were GGTTCCTGGGCATCCGTAT and GGTTCCTGGGCATCCGTAT, and reactions were run at an annealing temperature of 62.8 °C. Primers for MrgprB2MUT mice were GTTCCTGGGCATCCGCAC and CTTCCGCCTGAACCTTCGGT, and reactions were run at 64.0 °C annealing temperature.
Avidin labeling of tissue
Adult male and female mice up to 8 months of age were anesthetized with pentobarbital and perfused with 20 ml 0.1 M PBS (pH 7.4, 4 °C) followed with 25 ml of fixative (4% formaldehyde (vol/vol), 4 °C). Heart, trachea, and skin sections were dissected from the perfused mice. Tissues were post-fixed in fixative at 4 °C overnight. When skin sections were the only tissues needed, they were dissected and placed in fixative directly after asphyxiation of mice by CO2 inhalation, eliminating the perfusion step. Tissues were cryoprotected in 20% sucrose (wt/vol) for more than 24 h and were sectioned (20 μm width) with a cryostat. The sections on slides were dried at 37 °C for 30 min, and fixed with 4% paraformaldehyde at 21–23 °C for 10 min. The slides were pre-incubated in blocking solution (10% normal goat serum (vol/vol), 0.2% Triton X-100 (vol/vol) in PBS, pH 7.4) for 1 or 2 h at 21–23 °C, then incubated with 1/500 FITC-avidin (Sigma) or rhodamine-avidin (Vector Labs) for 45 minutes. Sections were washed three times with water or PBS and a drop of Fluoromount G (SouthernBiotech) was added before cover slips were placed on top. Heart mast cells were examined near cavities because the density was much higher than elsewhere in the tissue; avidin-positive, tdTomato-negative cells were observed embedded in muscle tissue in very low numbers, but their identity was unclear.
For avidin labeling of peritoneal mast cells, cells were plated as described in the mast cell purification section, fixed with 4% paraformaldehyde at 21–23 °C for 10 min, incubated with 1/1000 avidin in PBS for 30 minutes at 21–23 °C, and washed with PBS before immediate imaging.
Stomach section immunocytochemistry
Adult male and female mice up to 8 months of age were anesthetized with pentobarbital and perfused with 20 ml 0.1 M PBS (pH 7.4, 4 °C) followed with 25 ml of fixative (4% formaldehyde (vol/vol), 4 °C). Stomach sections were removed, washed thoroughly, postfixed in 4% formaldehyde for two hours, and prepared for sectioning by incubation in a 30% sucrose solution for 48 hours. Tissue samples were mounted in cryoembedding media and frozen, and 14 μm sections were made using a crytostat and then fixed onto slides. Slides were washed with a 0.2% Triton X-100 PBS solution, incubated for one hour in a 10% normal goat serum solution, and then incubated overnight at 4 °C with a 1:20 dilution of rat monoclonal anti-mouse MCPT1 (monoclonal antibody RF6.1, eBiosciences) in a 0.2% Triton/1% normal goat serum solution. Slides were washed with the 0.2% Triton solution and incubated for two hours at room temperature in Triton solution with a 1:500 dilution of a goat anti-rat IgG Alexa Fluor 488 conjugated antibody (Life Technologies). Slides were washed in PBS before cover slips were added with an anti-fade solution for imaging.
Peripheral white blood cell preparation
Blood was collected from MrgprB2-tdTomato mice via cardiac punctures with a syringe containing PBS with 30 units/ml heparin and 5 mM EDTA, diluted 1:1 with the same solution, and allowed to cool to room temperature before layering over 6 mls of a Histopaque-1119 solution in a 15 ml conical tube. Tubes were centrifuged at 700g for 30 minutes, and white blood cells were collected at the interface between the PBS and Histopaque solutions. Cells were washed with PBS and spun down at 500g for 10 minutes a total of three times. Cells were spun onto poly-lysine coated slides in a Cytospin 4 (Thermo Scientific) at 600rpm for 3-5 minutes, dried overnight on a 37 °C heating block, and incubated for 2 minutes with Hoechst 33342 diluted to 0.5 μg/ml in PBS before coverslip mounting with an anti-fade solution. In parallel, we also stained cells in suspension with Hoechst 33342, spun the cells down, and mixed the resuspended cells directly in a PBS/anti-fade solution before placing directly onto slides and mounting coverslips on the suspension. No tdTomato-positive cells were seen in any preparation using either method.
Tissue histamine release studies
Whole tracheae or segments of skin isolated from the abdominal aspect of shaved male and female mice up to 6 months of age (4-8 mg wet weight) were dissected and cleaned of connective tissue. After a 60 minutes in incubation period in oxygenated Kreb's bicarbonate buffer solution (37 °C), the tissue was treated with either vehicle or Compound 48/80 for 30 min. The supernatant solution was saved for histamine analysis. The tissue was then subjected to 8% percholoric acid in a 37 °C -waterbath for 15 minutes to obtain total histamine content. Histamine was assayed by the automated fluorometric technique previously described2.
Tracheal Contractions
Tracheal contractions were carried out as previously described3. For allergen (ovalbumin, OVA) responses, mice were actively sensitized by injecting 0.2 mL of an OVA solution (3.75 μg/mL) mixed with Al(OH)3 three times at an interval of 2 days. Experiments were conducted on male and female animals 8-12 weeks of age beginning two weeks following the first injection. Trachea were cleaned of connective tissue and tracheal rings (whole or laterally divided in half), were suspended between two tungsten stirrups in 10 mL organ chambers filled with Krebs’ that was warmed to 37°C and bubbled with 95% O2-5% CO2 to maintain a pH of 7.4. One stirrup was connected to a strain gauge (model FT03; Grass Instruments, Quincy, MA), and tension was recorded on a Grass Model 7 polygraph (Grass Instruments, Quincy, MA). Preparations were stretched to a resting tension of 0.2 g, and washed with fresh Krebs’ buffer at 15-minute intervals during a 60 minute equilibration period. After equilibration, trachea were challenged with either OVA (10 μg/mL), or Compound 48/80. At the end of each experiment, all trachea were maximally contracted with carbachol (1 μM). All results are expressed as a percentage of maximum contraction.
Hindpaw swelling and extravasation
Adult male mice up to 8 months of age were anesthetized with an i.p. injection of 50 mg/kg pentobarbital (Sigma). 15 minutes after induction of anesthesia, mice were injected i.v. with 50 μl of 12.5 mg/ml Evans Blue (Sigma) in saline. 5 minutes later, 5 μl of the test substance (or 7 μl of anti-IgE) was administered by intraplantar injection in one paw and saline was administered in the other paw. Paw thickness was measured by calipers immediately after injection. 15 minutes later (30 minutes after anti-IgE), paw thickness was measured again and mice were sacrificed by decapitation. Paw tissue was collected, dried for 24 hours at 50 °C, and weighed. Evans Blue was extracted by a 24 hour incubation in formamide at 50 °C, and the O.D. was read at 620 nm using a spectrophotometer. For studies using ketotifen, mice were injected i.p. with 25 μl of a 10mg/ml solution of ketotifen at the same time as pentobarbital.
Systemic anaphylaxis assay
To minimize stress, animals were transported to the procedure area the day before injections. Adult male and female mice up to 8 months of age (25 to 35 grams) were given an intraperitoneal injection of 80 μg propranolol in saline (2 mg/ml) immediately after removal from their cages, and then placed back in their cages for 30 minutes before intravenous injections. The intravenous injections were performed on one mouse at a time. For each injection, a mouse was placed in a transport box and brought to a room with no other mice, to minimize stress from vocalizations during injection. The mouse was then placed in a restrainer, and the injection was performed within 4 minutes of restraint because we observed that longer restraint times affected body core temperature independent from the injection. Tail veins were dilated by repeated wiping of tail with a tissue soaked in 100% ethanol, followed by injection of ciprofloxacin in a 0.25 ml Hamilton syringe fit with a 30.5 gauge needle (BD Biosciences). The injection was determined to be successful only when all of the criteria were met: blood appeared in the syringe after needle insertion, all tail veins were visible after injection, and the mouse bled slightly from the injection site after needle withdrawal. The injection site was swabbed until blood stopped flowing, the mouse was placed in a separate cage from its housing cage, one mouse per cage, and returned to the room it was brought from. At least one wild type and one mutant mouse were used for each experimental session. Body core temperature was measured with a rectal thermometer.
Mouse peritoneal mast cell histamine release assay
Mast cells were purified as with the calcium imaging assay and allowed to recover for 2 hours in DMEM with 10% FBS and 25 ng/ml mouse stem cell factor in a 37 °C incubator with 5% CO2. Cells were then spun down, resuspended in CIB, counted, and plated at 300 cells/well in 75 μl CIB in 96-well plates coated with 20 μg/ml fibronectin (Sigma). They were allowed to adhere to the substrate for 45 minutes at 37 °C in atmospheric conditions (i.e. CO2 levels were not adjusted) before assay. For the assays, cells were removed to room temperature and 75 μl of 2X concentrations of tested substances (all in CIB except for ciprofloxacin, which was in saline with 2.5 mM CaCl2 and 0.6 mM MgCl2, pH 3.5) were added. After 5 minutes, 40 μl of supernatant was aspirated, diluted with 40 μl CIB and frozen at -80 until histamine levels were determined. Anti-IgE treatment was similar, except that cells were incubated for 30 minutes at 37 °C after anti-IgE was added before aspiration of supernatant. Histamine content was determined by using an HTRF histamine assay kit (Cisbio Assays) according to the manufacturer's instructions.
Human mast cell culture
LAD2 (Laboratory of Allergic Diseases 2) human mast cells were cultured in StemPro-34 SFM medium (Life Technologies) supplemented with 2 mM L-glutamine, 100 U/ml penicillin, 50 μg/ml streptomycin, and 100 ng/ml recombinant human stem cell factor (Peprotech). The cell suspensions were seeded at a density of 0.1 × 10⁶ cells/ml and maintained at 37°C and 5% CO2, and periodically tested for the expression of CD117 and FcεRI by flow cytometry. Cell culture medium was hemi-depleted every week with fresh medium.
LAD2 degranulation assay
LAD2 cells were sensitized for 20 hours with 0.5 μg/ml biotin-conjugated human IgE (Abbiotec). Cells were washed, resuspended in Hepes buffer (10 mM HEPES, 137 mM NaCl, 2.7 mM KCl, 0.38 mM Na2HPO4.7H2O, 5.6 mM glucose, 1.8 mM CaCl2.H2O, 1.3 mM MgSO4.7H2O, 0.4% BSA, pH 7.4) at 0.025 × 10⁶ per well, and then stimulated with 0.1 μg/ml streptavidin (Life Technologies) or other agonists at the indicated concentrations for 30 minutes at 37°C/5% CO2. The β-hexosaminidase released into the supernatants and in cell lysates was quantified by hydrolysis of p-nitrophenyl N-acetyl-β-D-glucosamide (Sigma-Aldrich) in 0.1 M sodium citrate buffer (pH 4.5) for 90 minutes at 37°C. The percentage of β-hexosaminidase release was calculated as a percent of total content. Agonists tested were Compound 48/80, mastoparan, icatibant, atracurium bessylate, and ciprofloxacin hydrochloride.
EIA and ELISA
LAD2 cells were washed with medium, suspended at 0.25 × 10⁶ cells per well, and incubated with Compound 48/80, mastoparan, icatibant, atracurium or ciprofloxacin at the indicated concentrations for 3-24 hours at 37°C/5% CO2. Cell-free supernatants were harvested and analyzed for PGD2 release by an EIA (Cayman chemical), while TNF content was quantified using an ELISA kit (eBioscience) according to the manufacturer's instruction. The minimum detection limits were 55 pg/ml for PGD2 and 5.5 pg/ml for TNF.
Measurement of histamine release from LAD2 cells
LAD2 cells were washed, suspended in BSA-free Hepes buffer at 0.1 × 10⁶ per well, and incubated with Compound 48/80, mastoparan, icatibant, atracurium or ciprofloxacin at the indicated concentrations for 30 minutes at 37°C/5% CO2. A histamine (Sigma-Aldrich) stock solution of 100 μg/ml was prepared and stored at -20°C. The working standards of 4000 ng/ml to 7.8 ng/ml were freshly prepared using two-fold serial dilution. O-phthalaldehyde (OPT; Sigma-Aldrich) was dissolved in acetone-free methanol (10 mg/ml) and kept in dark at 4°C. Histamine standards and cell-free supernatants (60 μL) were transferred to a flat bottom 96 black well microplate and mixed with 12 μl 1M NaOH and 3 μl OPT. After 4 minutes at room temperature, 6 μl 3M HCl was added to stop the histamine-OPT reaction. Fluorescence intensity was measured using a 355 nm excitation filter and a 460 emission filter.
siRNA transfection of LAD2 cells
Expression of MrgprX2 was down-regulated with ON-TARGET plus SMARTpool siRNA against MrgprX2 and control siRNA from Dharmacon. LAD2 cells were washed with medium, suspended at 0.5 × 10⁶ cells per well, and transfected with 100 nm MrgprX2 siRNA and control siRNA in antibiotic-free StemPro medium using Lipofectamine 3000 (Life Technologies) according to the manufacturer's instruction at 37°C/5% CO2. At 48 hours, knockdown was confirmed by reverse-transcriptase PCR, and the cells were used for degranulation assays.
Extended Data
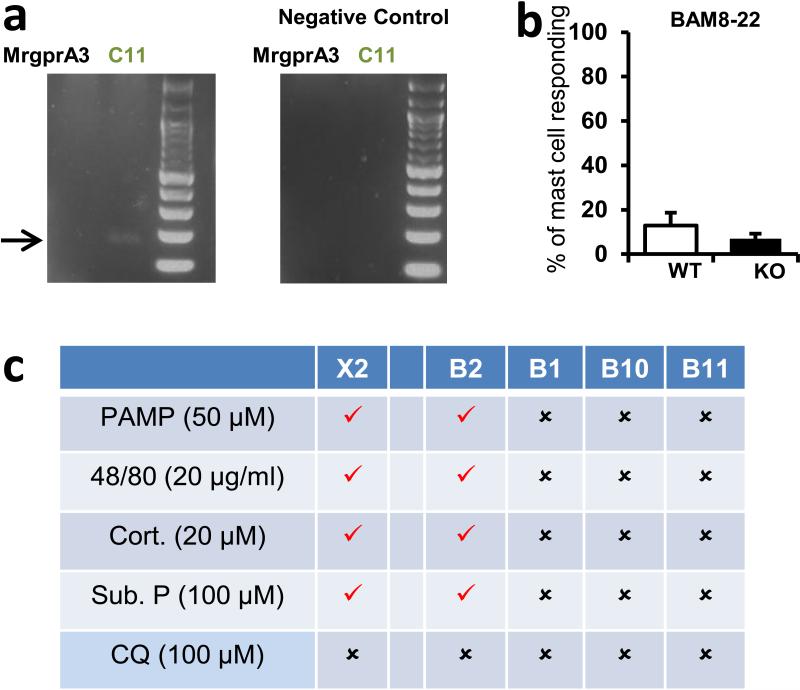
Extended Data Figure 1. MrgprX1 orthologues are not expressed at relevant levels in mast cells under naive conditions.
a. Results from a low-stringency RT-PCR screen (see methods) in peritoneal mast cells for expression of the MrgprX1 orthologues MrgprA3 and MrgprC11. Arrow points to expected band sizes.
b. Percentages of peritoneal mast cells responding to the MrgprX1 and MrgprC11 agonist Bovine Adrenal Medulla derived peptide, fragment 8-22 (BAM8-22, 500 nM). Activation was assayed by measuring rises in intracellular calcium, using imaging of the Fluo-4 dye. Differences are not significant (p=0.39). Group data are expressed as mean ± standard error of the mean. Two-tailed unpaired Student's t test was used to determine significance in statistical comparisons.
c. Chart summarizing responses to MrgprX2 ligands and the MrgprX1 ligand chloroquine (CQ) by HEK293 cells transiently transfected with plasmids driving expression of MrgprX2, MrgprB2, and other mouse Mrgprs (i.e. MrgprB1, B10, and B11) most closely related to MrgprB2. Positive and negative responses are indicated as “checks” and “crosses”, respectively. Responses were considered positive if at least half of the transfected cells showed a 50% increase in [Ca2+]i. No cells transfected with MrgprB1, B10, and B11 responded to any listed drug.
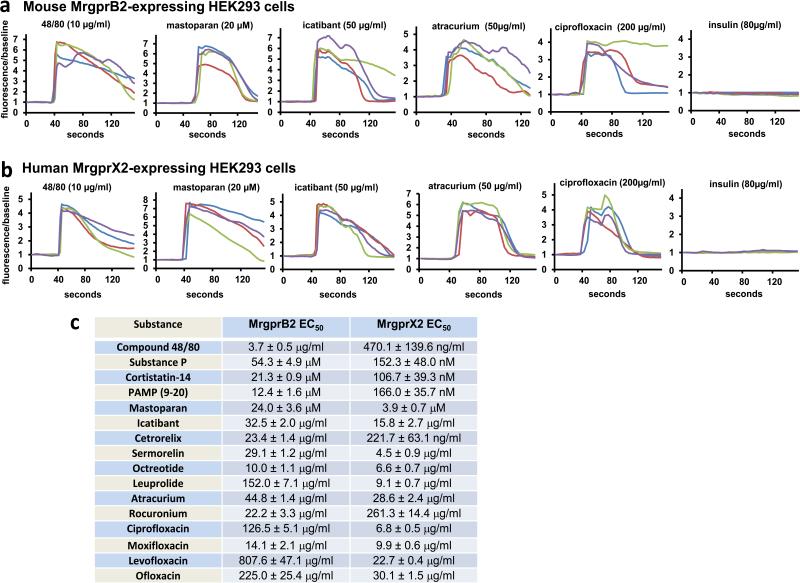
Extended Data Figure 2.
Basic secretagogues and drugs that induce pseudo-allergic reactions activate mouse MrgprB2 and human MrgprX2 expressed in HEK293 cells.
Example traces showing changes in [Ca2+]i, as measured by Fluo-4 imaging, from HEK293 cells expressing MrgprB2 and Gα15 (a) or MrgprX2 and Gα15 (b). Substances were perfused from the 30 to 90 second time period, except for ciprofloxacin, which was perfused between the 30 and 60 second time periods to minimize exposure to the low pH solutions it was dissolved in. Insulin was used as a negative control. (c) Table of EC50s of basic secretagogues and drugs associated with pseudo-allergic reactions to activate MrgprB2 and MrgprX2-expressing HEK293 cells. The EC50s were determined from dose response studies which were repeated three times. Data are expressed as mean ± SEM.
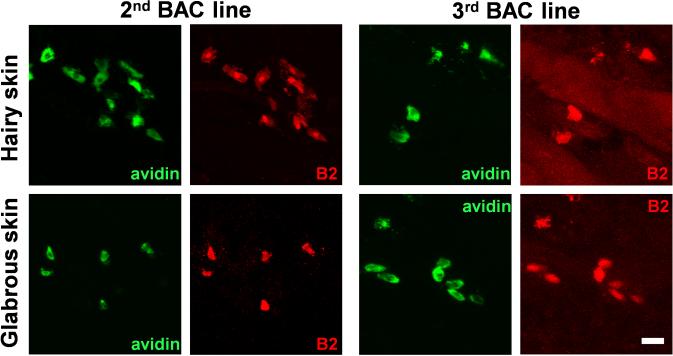
Extended Data Figure 3.
Multiple lines of BAC transgenic mice confirm mast cell specific MrgprB2 expression.
Representative confocal images from two other BAC transgenic mouse lines. BAC mice expressing eGFP-Cre in the MrgprB2 open reading frame were mated to tdTomato reporter mice and tdTomato (red) expression was compared to avidin staining (green), a marker for mast cells. Scale bar is 20 μm.
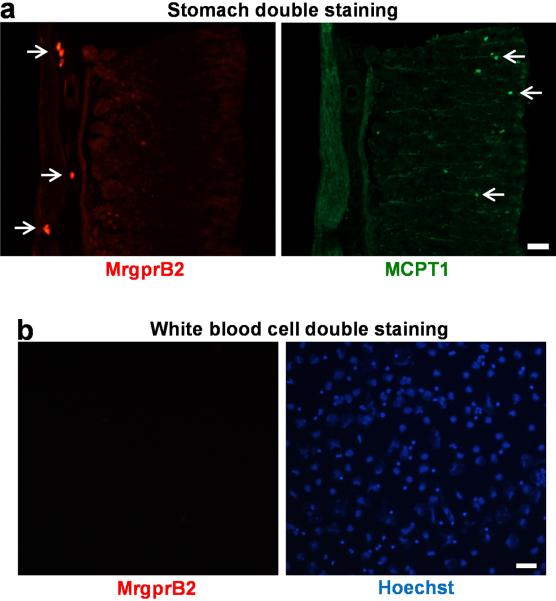
Extended Data Figure 4.
MrgprB2 is not expressed in mucosal mast cells or peripheral white blood cells.
a. Representative images of a stomach section from an MrgprB2-tdTomato mouse stained with an anti-MCPT1 (β-chymase) antibody to label mucosal mast cells. White arrows indicate positive cells. No cells were double-labeled (296 Mcpt1-labeled cells and 275 tdTomato-positive cells counted, n=3 mice). Scale bar is 40 μm.
b. Representative images of a Cytospin preparation of peripheral white blood cells from an MrgprB2-tdTomato mouse doubly labeled with tdTomato for MrgprB2-expressing cells (red; left image) and Hoechst 33342 nuclear staining (blue; right image). No peripheral white blood cell expressed MrgprB2 (n=3 mice; >4000 cells examined). Scale bar is 40 μm.
Extended Data Figure 5.
MrgprB2MUT mice are functional knockouts.
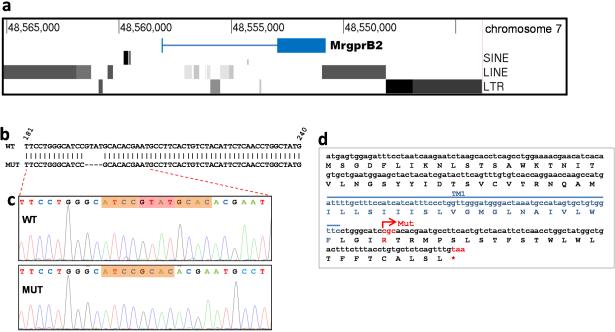
a. Illustration of the genomic region in and around the MrgprB2 locus. Note that repetitive sequences including long interspersed elements (LINEs), short interspersed elements (SINEs), and long tandem repeats (LTRs) begin immediately after the 3’ side of the MrgprB2 gene, and in addition are present within 2.5 kb of the 5’ side. A BLASTN search in March 2014 using the 500 bases adjacent to the 3’ end of MrgprB2 as a query turned up more than 269,000 hits in the mouse genome.
b. Comparison of the WT and MUT genomic sequences shows the location of the four base pair deletion in the mutant. Numbers correspond to the MrgprB2 open reading frame.
c. Sequencing result from WT and MUT cDNA sampled from mice born 18 months after the mutant line was established. The bases missing in the mutant are highlighted in red.
d. Amino acid translation of the MrgprB2MUT open reading frame reveals that the deletion creates a frameshift mutation and an early termination codon (*) shortly after the first transmembrane region. Mut – site of the frameshift deletion. TM1 – transmembrane region 1.
Extended Data Figure 6.
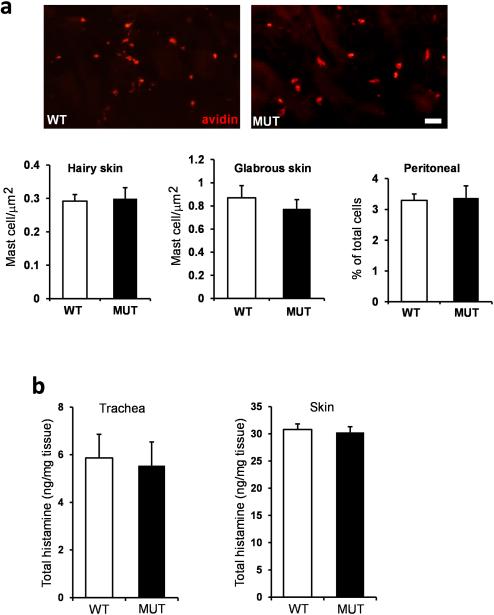
The mast cell numbers and the histamine content of tracheal and skin tissue was not different between wild type and MrgprB2MUT animals.
a. Top, representative pictures of avidin staining in WT and MrgprB2MUT mice. Scale bar is 40 μm. Bottom, quantification of mast cell numbers in various tissues. Differences are not significant, using a two-tailed unpaired Student's t test (n=3 mice for each genotype; over 3000 μm2 and 1000 μm2 counted for each genotype for hairy and glabrous skin, respectively; over 10,000 peritoneal cells counted).
b. The tracheal histamine content averaged 5.9 ± 0.9 and 5.5 ± 1.6 ng/mg (n=5 for each genotype), respectively; the skin histamine content averaged 30.8 ± 3.2 and 30.2 ± 4.0 ng/mg (n=8 for each genotype), respectively. Differences were not significant. Group data are expressed as mean ± standard error of the mean. Two-tailed unpaired Student's t test was used to determine significance in statistical comparisons.
Extended Data Figure 7.
Endothelin acting through the ETA GPCR1 induced comparable activation in MrgprB2MUT and wild-type mast cells.
a. Representative heat map images of mouse peritoneal mast cells showing changes in [Ca2+]i, as assayed by Fluo-4 imaging, induced by bath application of endothelin (1 μM). Scale bar is 10 μm.
b. Averages of [Ca2+]i imaging traces for WT (red line) and MrgprB2MUT (black line). The [Ca2+]i traces are similar between WT and MUT groups. Traces were averaged as described for Figure 2a.
c. Quantification of percentage of responding cells. Group data are expressed as mean ± standard error of the mean. Two-tailed unpaired Student's t test was used to determine significance in statistical comparisons (n=3 for each genotype; over 180 cells counted for each genotype). Endothelin-induced responses were not significantly different.
Extended Data Figure 8.
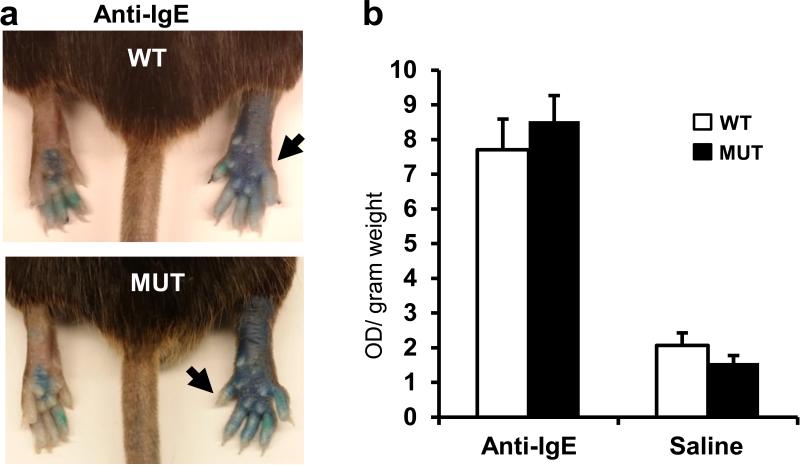
IgE-mediated inflammation does not differ between wild type and MrgprB2MUT mice.
a. Representative images of Evans Blue extravasation 15 minutes after intraplantar injection of anti-IgE antibody (right, arrow, 100 μg/ml, 7 μl in saline) or saline (left).
b. Quantification of Evans Blue leakage into the paw after 15 minutes (n=6 for WT, n=7 for MrgprB2MUT). Differences after anti-IgE antibody (p=0.49) and saline (p=0.23) injection are not significant. Group data are expressed as mean ± standard error of the mean. Two-tailed unpaired Student's t test was used to determine significance in statistical comparisons.
Extended Data Figure 9.
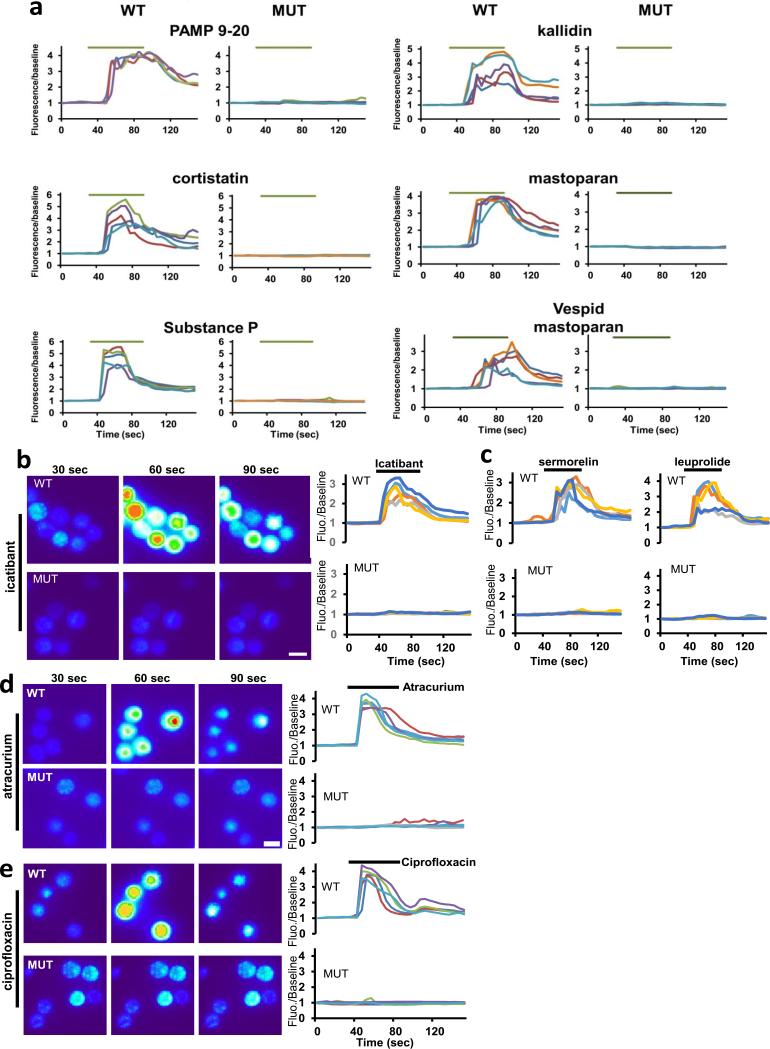
MrgprB2MUT mast cells are unresponsive to basic secretagogues and various therapeutic drugs.
a. Example traces showing changes in [Ca2+]i, as measured by Fluo-4 imaging, from WT and MrgprB2MUT peritoneal mast cells induced by the basic secretagogues from Figure 2e. Each trace is a response from a unique cell.
b. Representative Fluo-4 images (left) and fluorescence traces (right) from WT (top) and MrgprB2MUT (bottom) cultured peritoneal mast cells during application of icatibant (50 μg/ml).
c. Example traces showing changes in [Ca2+]i, as measured by Fluo-4 imaging, from WT and MrgprB2MUT peritoneal mast cells induced by selected FDA-approved cationic peptidergic drugs. Each trace is a response from a unique cell.
d. Representative Fluo-4 images (left) and fluorescence traces (right) from WT (top) and MrgprB2MUT (bottom) cultured peritoneal mast cells during application of atracurium (50 μg/ml).
e. Representative Fluo-4 images (left) and fluorescence traces (right) from WT (top) and MrgprB2MUT (bottom) cultured peritoneal mast cells during application of ciprofloxacin (200 μg/ml).
Extended Data Figure 10.
Human mast cells are activated by basic secretagogues and drugs associated with pseudo-allergic reactions in an MrgprX2-dependent manner.
a. Human LAD2 mast cells were treated with different concentrations of compound 48/80, mastoparan, icatibant, atracurium, and ciprofloxacin. The activation of mast cells in response to these substances was characterized by the release of β-hexosaminidase, TNF, PGD2, and histamine. In addition, 0.1 μg/ml streptavidin stimulation of biotin-conjugated human IgE sensitized LAD2 cells caused a robust release of β-hexosaminidase (71.3±1.8% release), compared to untreated cells (4.1±0.3% release). Group data are expressed as mean ± standard error of the mean.
b. Knockdown of human MrgprX2 significantly reduced mast cell activation evoked by basic secretagogues and drugs associated with pseudo-allergic reactions, but not by IgE. Human LAD2 mast cells were first transfected with MrgprX2 siRNA or control siRNA. Two days after the transfection, the cells were treated with compound 48/80 (0.1 μg/ml), mastoparan (5 μg/ml), icatibant (10 μg/ml), atracurium (25 μg/ml), and ciprofloxacin (75 μg/ml). The activation of mast cells in response to these substances characterized by the release of β-hexosaminidase was significantly reduced in MrgprX2 siRNA treated cells, compared to release in the control group. IgE-mediated mast cell degranulation was unaffected by MrgprX2 siRNA knockdown. Group data are expressed as mean ± standard error of the mean. Two-tailed unpaired Student's t test was used to determine significance in statistical comparisons, and differences were considered significant at * p < 0.05; ** p<0.01; *** p< 0.005 (the experiments were repeated three times).
Supplementary Material
Acknowledgments
We thank Chip Hawkins and Holly Wellington of Transgenic Mouse Core at Johns Hopkins University School of Medicine for their assistance in generating MrgprB2 null mice and MrgprB2-Cre BAC transgenic mice. We thank Dr. Bo Xiao for making MrgprB2-Cre BAC mice and Yixun Geng for mouse genotyping. This work was supported by National Institutes of Health Grants (R01NS054791 and R01GM087369 to X.D.). X.D. is an Early Career Scientist of the Howard Hughes Medical Institute.
Footnotes
Author Information
B.M. conceived of the project, designed and performed all experiments except where noted, and wrote the paper. P.P. performed all LAD2 cell work with supervision from M.K. S.M. performed tracheal contraction and tissue histamine release experiments. L.H. assisted with BAC purification and staining techniques. B.J.U. supervised S.M. and contributed to experimental design. X.D. supervised the project and wrote the paper.
The authors declare no competing interests.
References
- 1.Metcalfe DD, Baram D, Mekori YA. Mast cells. Physiological reviews. 1997;77:1033–1079. doi: 10.1152/physrev.1997.77.4.1033. [DOI] [PubMed] [Google Scholar]
- 2.Galli SJ, Nakae S, Tsai M. Mast cells in the development of adaptive immune responses. Nature immunology. 2005;6:135–142. doi: 10.1038/ni1158. doi:10.1038/ni1158. [DOI] [PubMed] [Google Scholar]
- 3.Lagunoff D, Martin TW, Read G. Agents that release histamine from mast cells. Annual review of pharmacology and toxicology. 1983;23:331–351. doi: 10.1146/annurev.pa.23.040183.001555. doi:10.1146/annurev.pa.23.040183.001555. [DOI] [PubMed] [Google Scholar]
- 4.Halpern BN, Wood DR. The action of promethazine (phenergan) in protecting mice against death due to histamine. British journal of pharmacology and chemotherapy. 1950;5:510–516. doi: 10.1111/j.1476-5381.1950.tb00603.x. [DOI] [PMC free article] [PubMed] [Google Scholar]
- 5.Taneike T, Miyazaki H, Oikawa S, Ohga A. Compound 48/80 elicits cholinergic contraction through histamine release in the chick oesophagus. General pharmacology. 1988;19:689–695. doi: 10.1016/0306-3623(88)90130-9. [DOI] [PubMed] [Google Scholar]
- 6.Ferry X, Brehin S, Kamel R, Landry Y. G protein-dependent activation of mast cell by peptides and basic secretagogues. Peptides. 2002;23:1507–1515. doi: 10.1016/s0196-9781(02)00090-6. [DOI] [PubMed] [Google Scholar]
- 7.Purcell WM, Doyle KM, Westgate C, Atterwill CK. Characterisation of a functional polyamine site on rat mast cells: association with a NMDA receptor macrocomplex. Journal of neuroimmunology. 1996;65:49–53. doi: 10.1016/0165-5728(95)00182-4. [DOI] [PubMed] [Google Scholar]
- 8.Tatemoto K, et al. Immunoglobulin E-independent activation of mast cell is mediated by Mrg receptors. Biochemical and biophysical research communications. 2006;349:1322–1328. doi: 10.1016/j.bbrc.2006.08.177. doi:10.1016/j.bbrc.2006.08.177. [DOI] [PubMed] [Google Scholar]
- 9.Sick E, Niederhoffer N, Takeda K, Landry Y, Gies JP. Activation of CD47 receptors causes histamine secretion from mast cells. Cellular and molecular life sciences : CMLS. 2009;66:1271–1282. doi: 10.1007/s00018-009-8778-2. doi:10.1007/s00018-009-8778-2. [DOI] [PMC free article] [PubMed] [Google Scholar]
- 10.Robas N, Mead E, Fidock M. MrgX2 is a high potency cortistatin receptor expressed in dorsal root ganglion. The Journal of biological chemistry. 2003;278:44400–44404. doi: 10.1074/jbc.M302456200. doi:10.1074/jbc.M302456200. [DOI] [PubMed] [Google Scholar]
- 11.Subramanian H, Gupta K, Guo Q, Price R, Ali H. Mas-related gene X2 (MrgX2) is a novel G protein-coupled receptor for the antimicrobial peptide LL-37 in human mast cells: resistance to receptor phosphorylation, desensitization, and internalization. The Journal of biological chemistry. 2011;286:44739–44749. doi: 10.1074/jbc.M111.277152. doi:10.1074/jbc.M111.277152. [DOI] [PMC free article] [PubMed] [Google Scholar]
- 12.Kashem SW, et al. G protein coupled receptor specificity for C3a and compound 48/80-induced degranulation in human mast cells: roles of Mas-related genes MrgX1 and MrgX2. European journal of pharmacology. 2011;668:299–304. doi: 10.1016/j.ejphar.2011.06.027. doi:10.1016/j.ejphar.2011.06.027. [DOI] [PMC free article] [PubMed] [Google Scholar]
- 13.Subramanian H, et al. beta-Defensins activate human mast cells via Mas-related gene X2. Journal of immunology. 2013;191:345–352. doi: 10.4049/jimmunol.1300023. doi:10.4049/jimmunol.1300023. [DOI] [PMC free article] [PubMed] [Google Scholar]
- 14.Kamohara M, et al. Identification of MrgX2 as a human G-protein-coupled receptor for proadrenomedullin N-terminal peptides. Biochemical and biophysical research communications. 2005;330:1146–1152. doi: 10.1016/j.bbrc.2005.03.088. doi:10.1016/j.bbrc.2005.03.088. [DOI] [PubMed] [Google Scholar]
- 15.Liu Q, et al. Sensory neuron-specific GPCR Mrgprs are itch receptors mediating chloroquine-induced pruritus. Cell. 2009;139:1353–1365. doi: 10.1016/j.cell.2009.11.034. doi:10.1016/j.cell.2009.11.034. [DOI] [PMC free article] [PubMed] [Google Scholar]
- 16.Mousli M, Hugli TE, Landry Y, Bronner C. Peptidergic pathway in human skin and rat peritoneal mast cell activation. Immunopharmacology. 1994;27:1–11. doi: 10.1016/0162-3109(94)90002-7. [DOI] [PubMed] [Google Scholar]
- 17.Pundir P, Kulka M. The role of G protein-coupled receptors in mast cell activation by antimicrobial peptides: is there a connection? Immunology and cell biology. 2010;88:632–640. doi: 10.1038/icb.2010.27. doi:10.1038/icb.2010.27. [DOI] [PubMed] [Google Scholar]
- 18.Hausmann O, Schnyder B, Pichler WJ. Etiology and pathogenesis of adverse drug reactions. Chemical immunology and allergy. 2012;97:32–46. doi: 10.1159/000335614. doi:10.1159/000335614. [DOI] [PubMed] [Google Scholar]
- 19.Lumry WR, et al. Randomized placebo-controlled trial of the bradykinin B(2) receptor antagonist icatibant for the treatment of acute attacks of hereditary angioedema: the FAST-3 trial. Annals of allergy, asthma & immunology : official publication of the American College of Allergy, Asthma, & Immunology. 2011;107:529–537. doi: 10.1016/j.anai.2011.08.015. doi:10.1016/j.anai.2011.08.015. [DOI] [PubMed] [Google Scholar]
- 20.Nel L, Eren E. Peri-operative anaphylaxis. British journal of clinical pharmacology. 2011;71:647–658. doi: 10.1111/j.1365-2125.2011.03913.x. doi:10.1111/j.1365-2125.2011.03913.x. [DOI] [PMC free article] [PubMed] [Google Scholar]
- 21.Read GW. Compound 48-80. Structure-activity relations and poly-THIQ, a new, more potent analog. Journal of medicinal chemistry. 1973;16:1292–1295. doi: 10.1021/jm00269a016. [DOI] [PubMed] [Google Scholar]
- 22.Mertes PM, Alla F, Trechot P, Auroy Y, Jougla E. Anaphylaxis during anesthesia in France: an 8-year national survey. J Allergy Clin Immunol. 2011;128:366–373. doi: 10.1016/j.jaci.2011.03.003. [DOI] [PubMed] [Google Scholar]
- 23.Koppert W, et al. Different patterns of mast cell activation by muscle relaxants in human skin. Anesthesiology. 2001;95:659–667. doi: 10.1097/00000542-200109000-00019. [DOI] [PubMed] [Google Scholar]
- 24.Kelesidis T, Fleisher J, Tsiodras S. Anaphylactoid reaction considered ciprofloxacin related: a case report and literature review. Clin Ther. 2010;32:515–526. doi: 10.1016/j.clinthera.2010.03.002. [DOI] [PMC free article] [PubMed] [Google Scholar]
- 25.Blanca-Lopez N, et al. Hypersensitivity reactions to fluoroquinolones: analysis of the factors involved. Clin Exp Allergy. 2013;43:560–567. doi: 10.1111/cea.12099. [DOI] [PubMed] [Google Scholar]
- 26.Mori K, Maru C, Takasuna K. Characterization of histamine release induced by fluoroquinolone antibacterial agents in-vivo and in-vitro. The Journal of pharmacy and pharmacology. 2000;52:577–584. doi: 10.1211/0022357001774228. [DOI] [PubMed] [Google Scholar]
- 27.Mori K, Maru C, Takasuna K, Furuhama K. Mechanism of histamine release induced by levofloxacin, a fluoroquinolone antibacterial agent. European journal of pharmacology. 2000;394:51–55. doi: 10.1016/s0014-2999(00)00147-3. [DOI] [PubMed] [Google Scholar]
- 28.Doyle E, Trosien J, Metz M. Protocols for the induction and evaluation of systemic anaphylaxis in mice. Methods in molecular biology. 2013;1032:133–138. doi: 10.1007/978-1-62703-496-8_10. doi:10.1007/978-1-62703-496-8_10. [DOI] [PubMed] [Google Scholar]
- 29.Bergman RK, Munoz J. Efficacy of beta-adrenergic blocking agents in inducing histamine sensitivity in mice. Nature. 1968;217:1173–1174. doi: 10.1038/2171173a0. [DOI] [PubMed] [Google Scholar]
- 30.Matsumura Y, Tan EM, Vaughan JH. Hypersensitivity to histamine and systemic anaphylaxis in mice with pharmacologic beta adrenergic blockade: protection by nucleotides. J Allergy Clin Immunol. 1976;58:387–394. doi: 10.1016/0091-6749(76)90119-6. [DOI] [PubMed] [Google Scholar]
- 31.Han L, et al. A subpopulation of nociceptors specifically linked to itch. Nature neuroscience. 2013;16:174–182. doi: 10.1038/nn.3289. doi:10.1038/nn.3289. [DOI] [PMC free article] [PubMed] [Google Scholar]
- 32.Siraganian RP. An automated continuous-flow system for the extraction and fluorometric analysis of histamine. Analytical biochemistry. 1974;57:383–394. doi: 10.1016/0003-2697(74)90093-1. [DOI] [PubMed] [Google Scholar]
- 33.Weigand LA, Myers AC, Meeker S, Undem BJ. Mast cell-cholinergic nerve interaction in mouse airways. The Journal of physiology. 587:3355–3362. doi: 10.1113/jphysiol.2009.173054. doi:10.1113/jphysiol.2009.173054. [DOI] [PMC free article] [PubMed] [Google Scholar]
- 34.Maurer M, et al. Mast cells promote homeostasis by limiting endothelin-1-induced toxicity. Nature. 2004;432:512–516. doi: 10.1038/nature03085. doi:10.1038/nature03085. [DOI] [PubMed] [Google Scholar]
Associated Data
This section collects any data citations, data availability statements, or supplementary materials included in this article.


