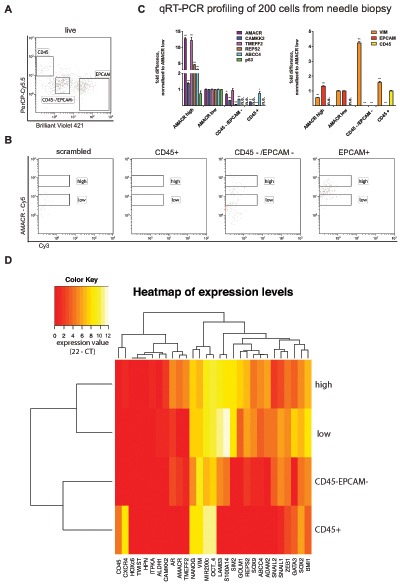
Figure 3. Cell type resolved analysis of human prostate cancer needle biopsy.

(A) Gating strategy for CD45 positive lymphocytes, Epcam positive epithelial cells and CD45/Epcam double negative stromal cells; (B) AMACR-Cy5 signal detected in indicated subpopulations (CD45+, CD45–/EPCAM–, EPCAM+ and scramble); (C) Gene expression analysis for tumor marker shows significant expression in AMACR high cells compared to AMACR low cells (normalization to AMACR low cells, right panel). Gene expression analysis for lineage markers (Vimentin = stromal cells, CD45 0 lymphocytes, Epcam = epithelial cells) correlates to protein expression-based FACS separation; (D) hierarchical euclidean clustering from gene expression analysis of 29 genes in each population separates the sorted four populations (expression value = 22 – CT).
