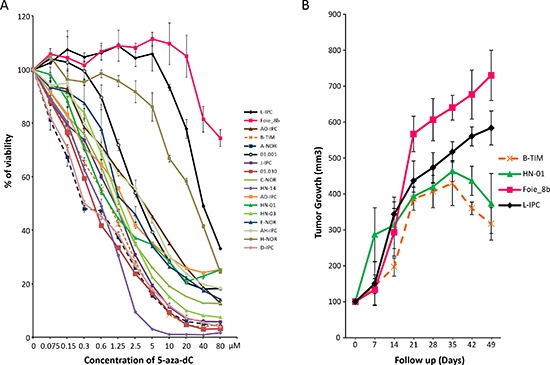
Figure 1. Sensitivity to the 5-aza-dC in vitro and in vivo.

(A) Chemogram of 5-aza-dC. PDAC-derived cells were treated with increasing concentrations of 5-aza-dC and the survival cells were measured after 72 h of treatment. (B) in vivo 5-aza-dC sensitivity. PDAC xenografted mice were treated with 5-aza-dC and tumor measured weekly. Treatment starts at day 21 after implantation. In grey is marked the length of the treatment. Error bars ± SEM; n = 3 per group.
