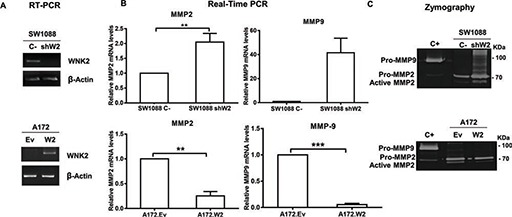
Figure 2. WNK2 downregulation leads to an increase in MMP2 RNA levels and activity.

(A) The expression of WNK2 was analyzed by RT-PCR, using specific primers, and β-actin was used as endogenous control. (B) MMP2 and MMP9 expression was analyzed by qRT-PCR. MMPs expression levels were normalized to GAPDH expression and results are presented as fold differences relative to SW1088 C- or A172.Ev cells. Data correspond to the mean values ± standard errors and are representative of, at least, three independent experiments. **, significantly different from SW1088 C- or A172.Ev cells (p < 0.01), ***, significantly different from A172.Ev cells (p < 0.001). (C) Conditioned medium of indicated cells were run on a gelatin zymogram to detect MMP activity. Proteolytic bands were revealed in white on a Coomassie Blue-stained background.
