Abstract
This study provides thermal expansion data for blood vessels permeated with the cryoprotective cocktail DP6, when combined with selected synthetic ice modulators (SIMs): 12% polyethylene glycol 400, 6% 1,3-cyclohexanediol, and 6% 2,3-butanediol. The general classification of SIMs includes molecules that modulate ice nucleation and growth, or possess properties of stabilizing the amorphous state, by virtue of their chemical structure and at concentrations that are not explained on a purely colligative basis. The current study is part of an ongoing effort to characterize thermo-mechanical effects on structural integrity of cryopreserved materials, where thermal expansion is the driving mechanism to thermo-mechanical stress. This study focuses on the lower part of the cryogenic temperature range, where the cryoprotective agent (CPA) behaves as a solid for all practical applications. By combining results obtained in the current study with literature data on the thermal expansion in the upper part of the cryogenic temperature range, unified thermal expansion curves are presented.
Keywords: Cryopreservation, Vitrification, Synthetic Ice Modulators, Thermal Stress, Solid Mechanics, Thermal Expansion
INTRODUCTION
One of the most significant limiting factors in the development of successful cryopreservation techniques for large-size specimens is the development of thermo-mechanical stress, potentially compromising the structural integrity of the specimen. In continuum mechanics, stress is a physical quantity that expresses the internal forces that neighboring particles of a continuous material exert on each other. Thermo-mechanical stress is commonly used to describe mechanical stress resulting from thermal expansion (or contraction when the material is cooled), which is the tendency of matter to change in volume in response to a change in temperature.
Thermo-mechanical stress may develop when adjacent regions of the material tend to expand differently, or when the material’s expansion is constrained. In a pure material, differential thermal expansion develops in phase-change sites [17,19] or as a result of temperature gradients [18,19,24]. When a biological specimen is cryopreserved, the various constituents of the material may also possess different thermal expansion properties, further enhancing thermo-mechanical stresses [22]. The bag or container used to store the cryopreservation product may also expand at a different rate, mechanically loading the specimen [21,23].
Irreversible changes to the structure of the specimen as a result of thermo-mechanical stress may be expressed at different scales. For example, shear stress—the component of stress coplanar with a material cross section—has shown to lead to DNA fragmentation [6,28], although not demonstrated in a cryogenic environment. The level of mechanical stresses reported in [6,28] can easily be exceeded during a cryopreservation protocol [19]. At the cellular level, extracellular ice formation may lead to an efflux of water from the cell, the forces from which may possibly be sufficient to rupture the membrane [12]. Fracture formation is often an indication of structural failure of larger specimens such as heart valves [1], and blood vessels [2,13]. A new device has been developed recently—the cryomacroscope—to investigate fracturing events during the processes of cryopreservation [4,15,20]. Unfortunately, the correlation of structural damage with the development of thermo-mechanical stress in cryopreserved specimens represents a largely unexplored area in cryopreservation research.
The evolution of events leading to structural damage is dependent upon the phase of state of the material. For example, engineering concepts related to mechanical failure in crystallized materials can be used to investigate structural damage during cryosurgery [18]. As another example, engineering concepts related to glass formation can be used to analyze structural integrity of materials cryopreserved by vitrification [21–23]. More recently, the application of cryopreservation with the aid of synthetic ice modulators (SIM) has been investigated [5], but engineering concepts related to such a process are still in their infancy.
In broad terms, SIMs are compounds that influence the formation and growth of ice nuclei and crystals by various purported mechanisms as discussed in more detail in [5]. This general classification embraces several categories of molecules that have been shown to modulate ice formation and growth. For example, molecules such as 1,3-cyclohexanediol (1,3-CHD) that specifically attenuates the growth of ice crystals by virtue of its chemical structure have been referred to as synthetic ice blockers (SIBs) [3,27]. Other SIMS such as 2,3-butanediol (2,3-BD) and polyethylene glycol (PEG400) facilitate the stability of the amorphous state by virtue of their interactions with water. As such, ice modulators make useful stabilizing supplements to vitrification solutions to enhance their amorphous stability and help reduce both the concentrations of other cryoprotectant solutes necessary and the likelihood of ice formation. To a large extent, the SIM classification is a practical one—it is derived from the outcome of adding the corresponding compounds into the cryopreservation cocktail, rather than attributing that outcome to a unique physical mechanism.
As with any cryoprotectant, the practical utility of SIMs in cryobiology represents a balance between physical and chemical properties and their interactions with living cells. It is generally recognized that toxicity is dependent upon concentration, and often temperature, irrespective of intrinsic physical properties. The rational approach of reducing the inherent chemical toxicity of the CPA cocktail by reducing the total concentration of solutes while retaining desirable physical attributes is an underlying value of incorporating SIMs [26,27].
The combination of ordinary CPA cocktails with SIMs is further expected to reduce the high cooling rate necessary for vitrification, which is critical to scale-up cryopreservation for two primary reasons: (i) regardless of the cooling mechanism at the outer surface, the maximum achievable cooling rate at the center of a bulky specimen is never greater than that at the surface—limited by principles of heat conduction through the tissue, and (ii) lower cooling rates often mean lower thermo-mechanical stress and diminishing risk to structural damage.
While the concept of SIM as a controlling agent of crystal growth is not new, very limited corresponding information is available in the literature of cryobiology. Of particular relevance is a recent report on the application of the CPA cocktail DP6 combined with 1,3-cyclohexanediol (1,3-CHD) as an experimental SIB, which demonstrated significantly improved tendency for vitrification in the preservation of pancreatic islets [26]. That study showed higher islet viability post cryopreservation when compared with established reference vitrification solutions.
As part of an ongoing effort to investigate thermo-mechanical effects in cryopreservation [5,8–11,14,16,20,22–25], the current study focuses on measuring thermal expansion, which is the driving mechanism for thermo-mechanical stress. Since the vitrifying material changes behavior from fluid-like [5,14,16] to solid like [8,9], two different experimental systems are required for mapping the effects of thermal expansion. The current study is focused on the lower part of the cryogenic temperature range where the CPA-SIM cocktail behaves as a solid. Thermal expansion of DMSO in various concentrations as well as the CPA cocktails: VS55, DP6, DP6 + 12% PEG400, DP6 + 6% 1,3-CHD and DP6 + 6% 2,3-BD have been measured in the presence and absence of biological samples in the upper part of the cryogenic temperature range [5,14,16]. Additionally, thermal expansion of goat arteries permeated with DMSO, VS55, and DP6 have all been measured in the lower part of the cryogenic temperature range [9]. By combining the data obtained in the current study with previously obtained data corresponding to the upper part of the cryogenic temperature range [5], the thermal expansion behavior of DP6 combined with various SIMs is presented for the first time from 0°C down to sub-glass transition temperatures.
MATERIALS AND METHODS
Experimental Setup
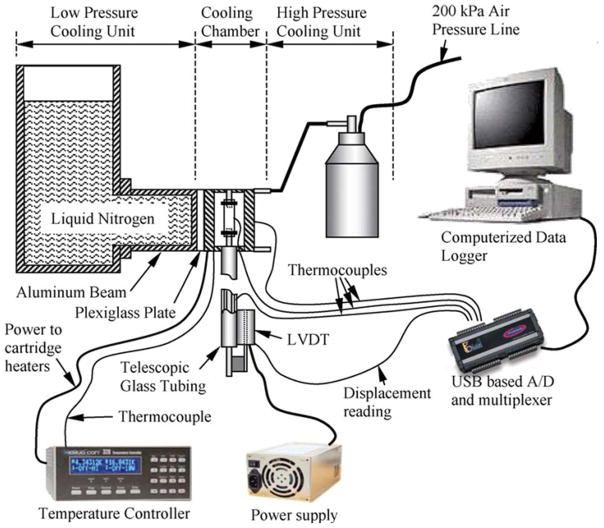
The device used to measure thermal expansion in the lower part of the cryogenic temperature range was previously developed and validated [8], and is presented here in brief for the completeness of presentation. With reference to Fig. 1, the experimental system consists of six units: (1) a cooling chamber; (2) a low pressure cooling unit for slow cooling; (3) a high pressure cooling unit for rapid cooling; (4) a closed-loop electrical heating unit for thermal control of the cooling chamber; (5) a computerized sensory unit to record specimen elongation and thermal history; and (6) a specimen gripping unit and telescopic glass tubing for displacement measurements, where the displacement sensor operates at room temperature. The experimental system was designed and constructed at the Biothermal Technology Laboratory at Carnegie Mellon University.
Figure 1.
Schematic illustration of the experimental setup to measure the thermal expansion in the current study [8].
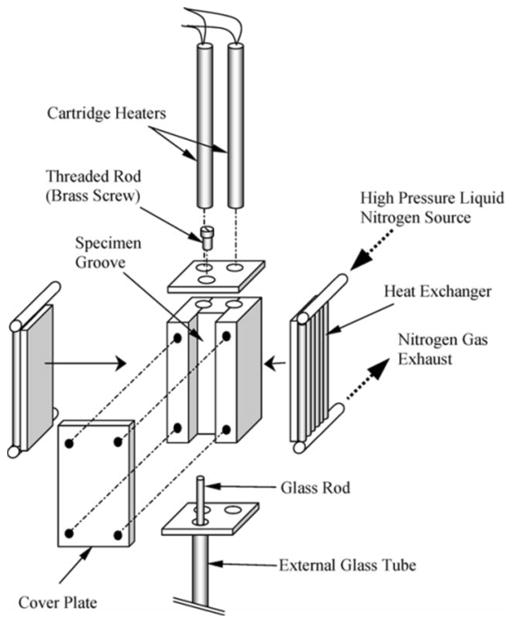
Figure 2 displays a schematic illustration of the cooling chamber assembly. The cooling chamber is constructed of a yellow brass block. Due to the high thermal conductivity of brass, (k = 83 W/m-K) the cooling chamber behaves as a lumped system in the thermal sense. A groove is machined along one side of the block in order to accommodate the blood vessel specimen and is covered with a brass plate. The cooling chamber is attached to an aluminum beam which extends from the low pressure cooling unit, which operates at atmospheric temperature. Between the cooling chamber and the aluminum beam is a thin Plexiglass plate which acts as a thermal barrier (as shown in Fig. 1). This slows down the heat transfer and conserves liquid nitrogen stored in the low pressure cooling unit. The contact face of the chamber with the Plexiglass plate is on the face opposite of the cooling chamber groove. The high pressure cooling unit consists of two heat exchangers, one on each side of the cooling chamber, liquid nitrogen container, and a portable air pressure container. The heat exchangers are connected in parallel to the high pressure liquid nitrogen container. The high pressure cooling unit is manually operated while the low pressure cooling unit is active throughout the experiment.
Figure 2.
Schematic illustration of the cooling chamber of the experimental setup displayed in Fig. 1 [8].
Two cylindrical holes are drilled along the cooling chamber, to accommodate a pair of cartridge-electrical heaters, which are connected in parallel to the temperature controller and power supply. A copper-constantan thermocouple (type T) is connected to the cooling chamber in a drilled hole between the electrical heaters and the groove of the chamber, which closes the feedback loop of the control system.
The computerized sensory unit comprises a regular desktop computer, an analog to digital converter and multiplexer in one unit (OMEGA, OMB-DAQ 55) an array of T-type thermocouples, a linear variable differential transformer (LVDT) sensor and a power supply to excite the LVDT. In order to thermally isolate the LVDT from the rest of the experiment, a system of telescopic glass tubing was used—a tube and a rod. The glass tube is vertically connected to the cooling chamber at one end, and to the LVDT coil at the other end. The glass rod is connected to the specimen at one end, and to the LVDT core at the other end. With reference to Fig. 2, the blood vessel specimen is connected onto a threaded screw, which extends from the plate covering the top side of the cooling chamber groove.
To operate the system, first the liquid nitrogen reservoir of the low pressure cooling system is filled—in order to pre-cool the system, while the cartridge heaters are turned on—in order to hold the cooling chamber at a steady initial temperature of 0°C. After the system has reached steady state, the heater is turned off and the high-pressure cooling system is activated. The high pressure cooling unit, working simultaneously with the low pressure cooling unit, allows the cooling rate to be high enough (~ −40°C/min) to prevent crystallization while the system is cooled down to the minimum temperature (typically between −160°C and −170ºC). Next, the high pressure system is turned off and the heater is turned back on until the system reaches room temperature. The average rewarming rate is 8.25°C/min, starting at 11°C/min upon activation and reaching 5.5°C/min at −80°C, which is the upper temperature range for data collection in this study (see [8] for further details on system operation).
The contraction of the cooling chamber, the telescopic tubing, and the blood vessel differ, which causes an axial movement of the glass rod inside the glass tube. This moves the core of the LVDT relative to its coil. The LVDT core movement is recorded through the USB-A/D converter and multiplexer, concurrently with the thermal history of the specimen and cooling chamber. With both the axial displacement and the temperature history, the thermal strain of the blood vessel specimen and its thermal expansion coefficient can be calculated as described below.
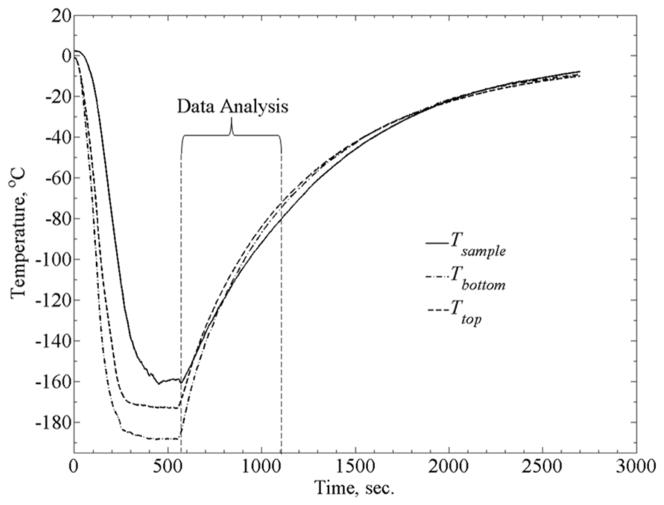
Each experiment produces a continuously varying thermal strain response as temperature rises and is sampled at a rate of 1 Hz. The multiplexer was set to measure data from seven different inputs with a measurement duration of 110ms. This led to a maximum time delay of 0.77s between the first and last measurements. The maximum rewarming rate for analyzed data (Fig. 3) is about 9.5°C/min. It follows that the maximum temperature increment between consecutive measurements is 0.16°C. Due to uncertainty relating to the actual time of measurement within each sampling cycle (7 inputs at 110 ms each, results in a sampling cycle of 0.77s), the uncertainty in sampled temperature may reach up to 0.12°C. This uncertainty is significantly smaller than the inherent uncertainty for the T-type thermocouple (0.5°C) used in the current system. Nonetheless, the linear thermal expansion coefficient—the inferred property in the current experimental investigation—is a monotonic and very slow changing property. The effect of 0.16ºC temperature increment on the correlation between the thermal expansion coefficient and temperature is deemed negligible (see [8] for more detailed uncertainty analysis).
Figure 3.
Typical thermal history during experimentation, where Tsample is the blood vessel temperature at its mid-height, and Ttop and Tbottom are the temperatures measured at the top and bottom of the cooling chamber.
With reference to [8], two modifications are integrated into the experimental setup: (i) the glass rod and threaded screw diameter used in this study were changed from 3mm to 1.5mm, to be compatible with smaller size blood vessel specimens, and (ii) a higher precision power supply was used in the current study—Hewlett, Packard 6228B, instead of a Bested, Model BPS-2004-4U. These modification necessitated recalibration of the experimental system, following the process outlined in [8].
Artery Sample Preparation
All tissues used in this experiment were donated by a local slaughterhouse. No animals were sacrificed specifically for the purpose of the current study. The main carotid artery was harvested from goats (which were sacrificed for other purposes). Tested samples had a diameter in the range of 3 to 5 mm, length in the range from 40 to 52 mm, and a wall thickness of about 1 mm (diameter and wall thickness have no effect on the thermal expansion measurements). Samples were immersed in SPS-1 organ preservation solution (Organ Recovery Systems, Inc. Itasca, IL) immediately after harvesting and stored at 4°C for a period between one and five days. This time period was selected due to availability of specimens and appeared to have no effect on experimental results. While storing the specimens in such conditions is likely to affect viability and functionality of the blood vessel, it has no effect on its thermo-physical properties, as has been demonstrated previously [5,9]. Following the procedure outlined in [5], each specimen was immersed in the DP6 + SIM solution for 2 h before testing.
DP6 is a cocktail of 234.4 g/L DMSO (3M), 228.3 g/L propylene glycol (3M), and 2.4 g/L HEPES in EuroCollins solution. VS55 is a cocktail of 242.14 g/L DMSO (3.1M), 168.38 g/L propylene glycol (2.2M), 139.56 g/L formamide (3.1M), and 2.4 g/L HEPES in EuroCollins solution. The two cocktails are similar, excepting the omission of formamide from DP6 to reduce its toxicity. In return, DP6 contains a higher concentration of propylene glycol. While VS55 has been found to be a much better glass promoting cocktail [16,20], DP6 appears to be more promising due to its reduced overall CPA concentration, and therefore its toxicity. The downside in the application of DP6 is the high cooling rate typically required for vitrification. Hence, this proposal focuses on DP6 combined with SIMs, in an effort to improve its performance.
While many SIMs could be selected, the choice of practice is based on recent experience developed by the current research team [5,27], the following cocktails have been tested: DP6 + 12% PEG400 (n = 5), DP6 + 6% 1,3-CHD (n = 5), and DP6 + 6% 2,3-BD (n = 4), where n is the number of specimens and each specimen was tested twice (a total of 2n experiments). Two experiments were performed on each specimen to investigate the effect of repeated cooling-thawing cycles. Experiments were repeated on multiple arteries in order to investigate variance among tissue samples as well as to eliminate any systemic and preparation errors. All SIMs, PEG400, 1,3-cyclohexanediol (98% mixture of cis and trans isomers), and 2,3-butanediol (2R,3R isomer), were obtained from Sigma-Aldrich (St. Louis, MO) and DP6 was obtained from Cell and Tissue Systems, Inc. (North Charleston, SC).
Data Analysis
The experimental protocol, a detailed mathematical analysis of the system, and uncertainty analysis have all been presented previously [8,9]. Key equations and a brief description of the data analysis process are presented here for the completeness of presentation. Due to the two modifications described above, the system had to be recalibrated. First, a voltage-displacement curve was obtained, by driving the glass rod with a depth micrometer and recording the LVDT voltage output.
The LVDT displacement reading is the sum of:
| (1) |
where ΔLs is the tissue sample elongation, ΔLg is the elongation of the portion of the glass rod that extends into the cooling chamber, and ΔLc is the elongation of the cooling chamber. In order to obtain ΔLs, the unknown quantity (ΔLg - ΔLc) has to be measured experimentally, following the procedure described in [8]—this quantity is unique to the specific experimental setup.
Finally, the thermal strain (the relative contraction) of the blood vessel is calculated by:
| (2) |
where Ls is the initial length of the specimen. The linear thermal expansion coefficient is the rate of change of thermal strain with respect to temperature:
| (3) |
where □ is a polynomial approximation of the temperature dependence of the strain, ε. While the property of thermal expansion is intrinsic, the thermal strain is a relative measure specific to a particular process (i.e. the integral of thermal expansion over temperature along the process).
RESULTS AND DISCUSSION
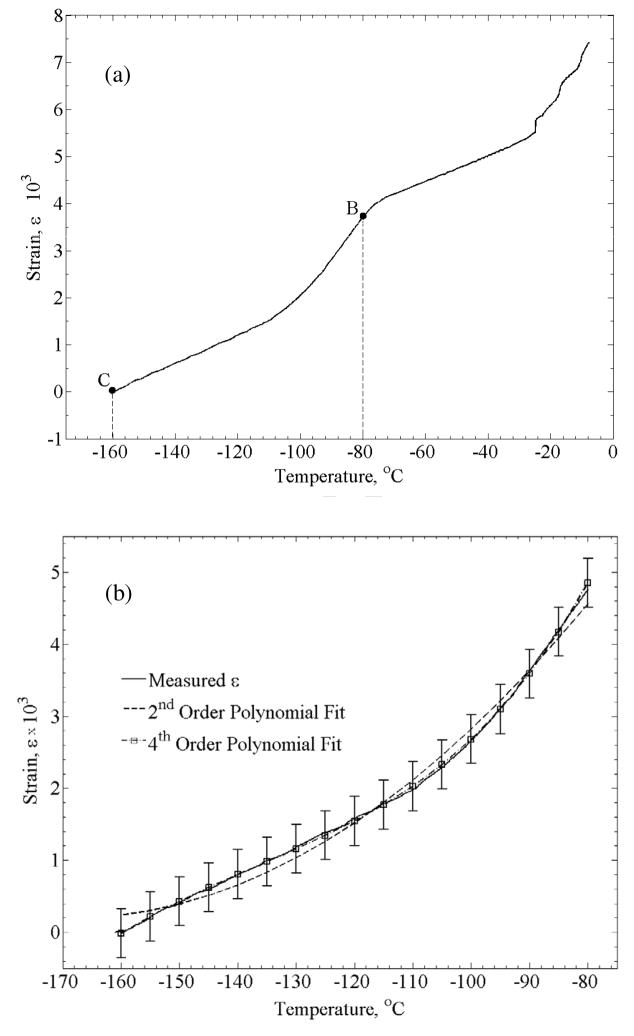
Figure 3 displays a typical thermal history in a thermal strain experiment. Due to the large temperature distribution in the cooling chamber during the cooling phase of the experiment, data analysis in the current study is focused on the rewarming phase, when the temperature distribution is moderate (less that ±7°C from the average in the experiment displayed in Fig. 3). Data collection starts at the lowest temperature achieved and continues until the specimen reaches a certain temperature, TB, (Fig. 4a) where the material can no longer be approximated as solid. While the precise location of TB may vary between experiments, based on the data collected in the current study and the conclusions drawn in [9], −80°C appears to be below that temperature threshold for all experiments. Hence, data analysis in the current study is focused on the temperature range of −80°C (point B) to the lowest temperature obtainable for a given experiment (point C)—typically in the range of −170ºC to −160ºC. A second order polynomial has been used in a previous study to approximate the thermal strain at low temperatures [12], attempting a 2nd order fit, resulted in a coefficient of determination (R2) value of 0.9914. Results of this study suggest a better fit with a 4th order polynomial, resulting in an R2 value of 0.9995 (Fig. 4(b)). Data obtained in this study on the thermal expansion of DP6 matched reasonably well previously obtained data [9]. However, due to the slow rewarming rate (between 5.5 and 9.5°C/min), which is below the critical rate of 185ºC/min, we are unable to exclude rewarming phase crystallization effects, and that data was not included in the current report.
Figure 4.
A typical strain-temperature curve obtained with the experimental system: (a) section B–C is the analyzed segment, where the material follows the expected thermal behavior of a vitrifying material, and (b) analyzed data from the same experiment using a 2nd and 4th order polynomial; error bars indicate ±2σ.
While the property of thermal expansion is intrinsic, the thermal strain is an integral property (the integral of the thermal expansion coefficient with respect to temperature), which is dependent upon an initial condition. In these experiments, the initial condition is the initial temperature, which varies between experiments. Since each experiment starts at a slightly different temperature, the approximation of êj from a specific experiment, j (j = 1,…,2n), needs to be shifted in the ε direction (vertical direction) within the ε-T plane so that the data sets overlap. Once one experiment is arbitrary selected as a reference, êk (k = j, j = 1,…,2n), experimental results from all other experiments are shifted by a constant value Δêj, so that the parameter Fj is minimized (a different value for each experiment):
| (4) |
where i represents all the overlapping points from the polynomial approximations êk and êj Due to the exponentially decaying rewarming rate, Eq. (4) is used on polynomial approximations of the original experimental datasets, rather than on raw data; otherwise it would have overweighted the differences at higher temperatures. In practice, the temperature range of interest was discretized in 5°C increments, with m value typically equal to 16. Decreasing that temperature increment to 0.16°C, which is the maximum temperature increment at 1Hz (as discussed above), had insignificant effect on Δêj of less than 1.52% of full scale.
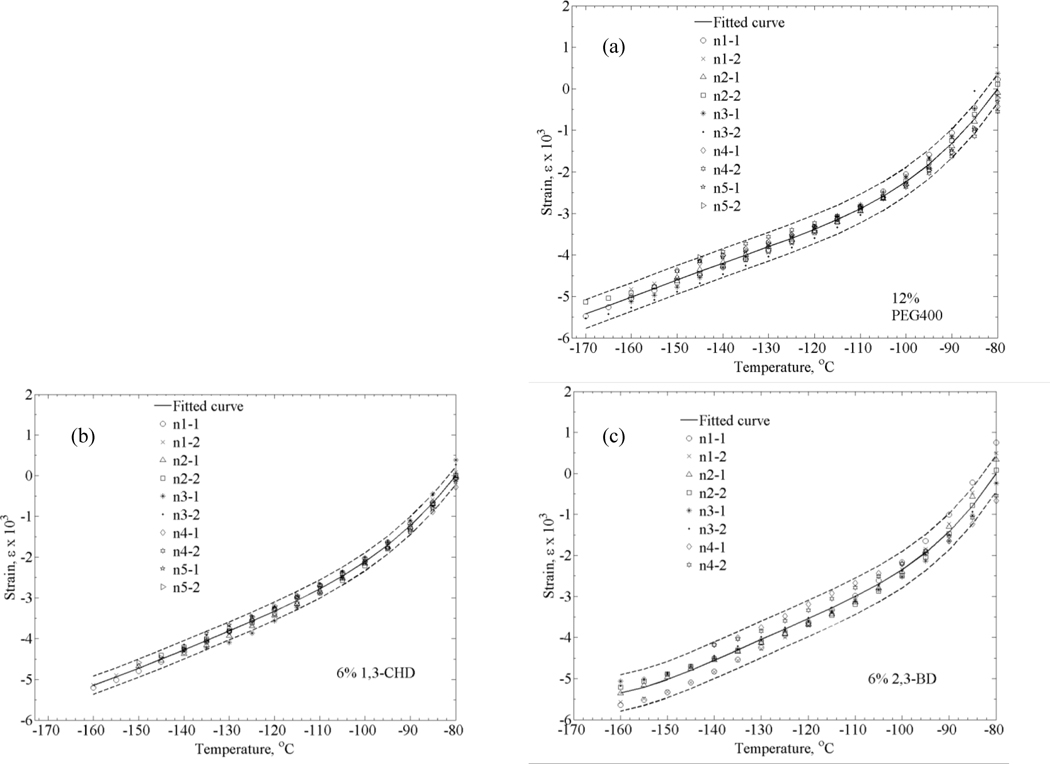
Finally, a polynomial approximation, ê, is estimated for the combined shifted data from all the experiments. Figure 5 displays the thermal expansion data for goat arteries permeated with each of the three SIMs under investigation. The uncertainty range illustrated in Fig. 5 represents a 2σ range, which is consistent with the odds of 1:20 for a particular measurement to be outside of this range [7]).
Figure 5.
Thermal strain of DP6 combined with (a) 12% PEG400, (b) 6% 1,3-CHD, and (c) 6% 2,3-BD. Symbols represent individual data points, solid lines represent polynomial approximation, and dashed lines represent an uncertainty range of ±2σ.
In the process of estimating uncertainty, a consideration must be given to the fact that the measured parameter is the strain but the inferred parameter is its slope—the linear thermal expansion coefficient. Furthermore, the average slope from all experiments is calculated only after strain curves are shifted to minimize their offset, as described above. It follows that a standard deviation value of the strain distribution, when calculated independently at a particular temperature for all data sets after curve shifting, may represent an overly optimistic estimation of certainty (most likely to occur at the middle of the temperature range). Instead, the uncertainty range in Fig. 5 is calculated as the average of all individual uncertainty values calculated at each temperature point, a value which is assumed to better represent the overall uncertainty in experimentation and analysis technique.
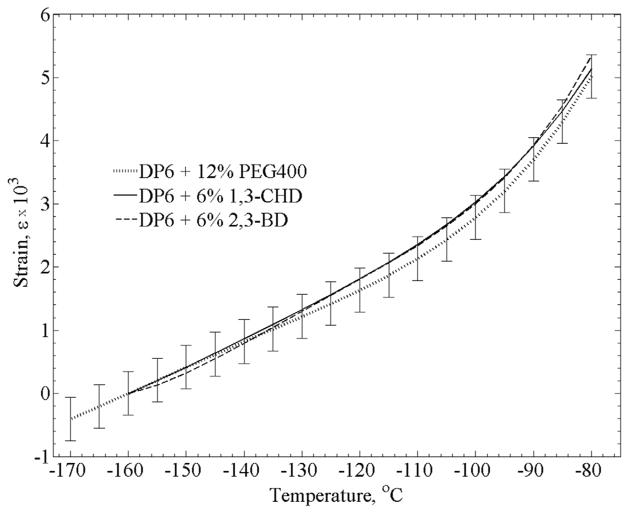
Distribution of results for each cocktail out of full range is: ±6.9% for DP6+PEG400, ±4.3% for DP6+1,3-CHD, and ±8.3% for DP6+2,3-BD. The differences between the best fit for each cocktail is within the above uncertainty range as shown in Fig. 6, which suggests that differences in thermal expansion between the different cocktails are relatively small. For clarity in presentation, an uncertainty range is presented for DP6+PEG400 only, to display a representative distribution of results.
Figure 6.
Polynomial approximations of the three DP6 + SIM solutions. Since data compilation was performed for the rewarming stage, which started in the temperature range of −170ºC to −160ºC, a strain value of zero was selected at the reference temperature of −160ºC. For clarity in presentation, representative error bars (±2σ) are displayed for the DP6+12% PEG400 curve only.
Unified Thermal Expansion Curves
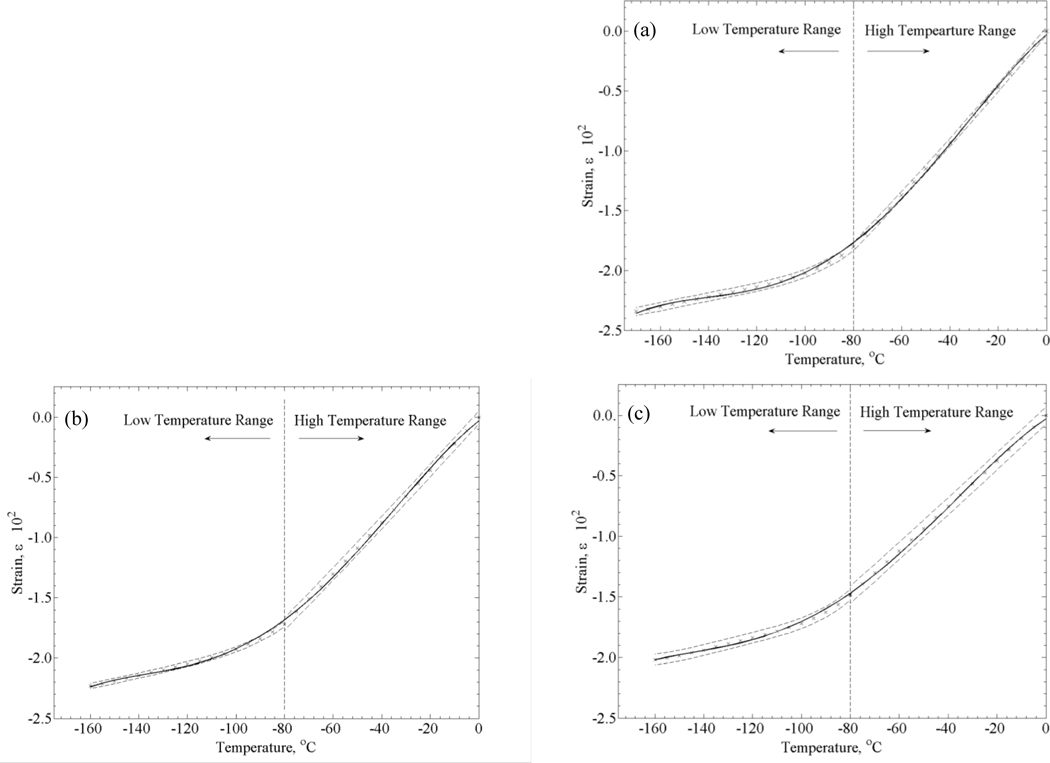
The thermal expansion in the upper part of the cryogenic temperature range, where the material behaves as a fluid, has been recently studied [5], while the current study is focused on the lower part of the cryogenic temperature range, where the material behaves as a solid for the time scale of experimentation. Both datasets include overlapping thermal strain measurements, centered around −80°C, which enables merging the separate sets of data into a unified curve covering the entire cryogenic temperature range. The process for creating the unified thermal expansion curve followed these steps: (i) While taking 0°C as a reference temperature for datasets in the upper part of the cryogenic temperature range, each polynomial approximation for a specific cocktail was shifted in the ε direction within the ε-T plane, until the strain at this temperature became zero. (ii) While taking −80°C as a reference temperature for datasets in the lower part of the cryogenic temperature range, each corresponding polynomial approximation was shifted, until both datasets for the same cocktail received the same strain value at −80°C. (iii) A fourth order polynomial approximation was fitted to the combined datasets.
Figure 7 displays the corresponding three unified curves and Table 1 lists the corresponding fitted parameters. For a 2σ range (twice the standard deviation; including 95% of all measured data), distribution of results for each cocktail is found within: ±1.5% for DP6+PEG400, ±1.0% for DP6+1,3-CHD, and ±2.2% for DP6+2,3-BD, all with respect to full range measurements. It was essential to construct the unified thermal expansion curve from the individual polynomial approximations of the subsets (upper and lower parts of the cryogenic temperature range) rather than from the raw data of all experiments combined, in order to resolve issues associated with the variation in conditions inherent to the different experimental studies, such as sampling rate, minimum temperature achieved, and the number of experiments.
Figure 7.
Unified thermal-expansion curves including data from the upper [5] and lower [current study] parts of the cryogenic temperature range, for DP6 combined with (a) 12% PEG400, (b) 6% 1,3-CHD, and (c) 6% 2,3-BD. Symbols represent data points calculated from the polynomial approximation for each subset (Table 1), solid lines represent polynomial approximations of the unified thermal strain, and dashed lines represents the ±2σ range.
Table 1.
Coefficients of best-fit approximation of the thermal strain, ε = a1T4+a2T3+a3T2+a4T+a5, for selected DP6-SIM mixtures, where the thermal expansion coefficient is given by β = 4a1T3+3a2T2+2a3T+a4, and where R2 is the coefficient of determination.
| SIM | Temperature Range, °C | a1×1010 [°C−4] | a2×107 [°C−3] | a3×105 [°C−2] | a4×103 [°C−1] | a5×102 | R2 | n | Source |
|---|---|---|---|---|---|---|---|---|---|
| 12% PEG400 | 0 to −80 | 0 | 0 | 0.01777 | 0.2392 | 0 | 0.9896 | 6 | [5] |
| −80 to −160 | 1.065 | 0.6240 | 1.364 | 1.358 | 4.911 | 0.9833 | 5 | Current | |
| 0 to −160 | −0.8668 | −0.2995 | −0.2358 | −0.1757 | −0.0275 | 0.9995 | - | Current | |
| 6% 1,3-CHD | 0 to −80 | 0 | 0 | 0.01054 | 0.2232 | 0 | 0.9974 | 5 | [5] |
| −80 to −160 | 1.155 | 0.639 | 1.330 | 1.283 | 4.550 | 0.9943 | 5 | Current | |
| 0 to −160 | −0.7969 | −0.2771 | −0.2210 | 0.1666 | −0.0236 | 0.9994 | - | Current | |
| 6% 2,3-BD | 0 to −80 | 0 | 0 | 0.007383 | 0.1912 | 0 | 0.9937 | 5 | [5] |
| −80 to −160 | 2.672 | 1.379 | 2.668 | 2.342 | 7.562 | 0.9791 | 4 | Current | |
| 0 to −160 | −0.5587 | −0.2066 | −0.1747 | 0.1442 | −0.0209 | 0.9994 | - | Current |
In a previous study on DP6 in the absence of SIMs [9], a significant portion of the unified curve had to be interpolated, since the two inherently different measurement techniques did not enable overlapping results. Thermal expansion data of DP6 for the upper part of the cryogenic temperature region [16] only extended down to about −40°C, due to the onset of crystallization for the achievable cooling rate. That necessitated data interpolation, which reduced the quality of the previously published unified curves [9]. No onset of crystallization was observed for DP6 combined with SIMs in the upper part of the cryogenic temperature range [5], for the same thermal conditions previously applied in the absence of SIMs [16]. Due to this additional ice suppressing ability, data from [5] was combined with data from the current study to form a unified thermal strain curve without the need for any interpolated region. It should be noted that due to the inherent uncertainties associated with fitting and re-fitting, if possible, it is probably better to use the individual fits from either the upper or lower cryogenic temperature regions instead of the unified fit for thermal strain calculations.
SUMMARY
Thermal expansion of goat arteries permeated with DP6, combined with selected SIMs, was measured in the lower part of the cryogenic temperature range. Results obtained in the current study were combined with recently obtained data from the upper part of the cryogenic temperature range, in order to formulate unified thermal expansion curves. This database is essential for computation of the formation of thermo-mechanical stress in vitrifying CPAs. The application of SIMs enabled obtaining thermal expansion data in the temperature range of −160°C to 0°C, which was not achievable in the same cooling rates in previous studies in the absence of SIMs.
While thermal expansion is the driving mechanism of thermo-mechanical stress, which may shed light on the likelihood of compromising the structural integrity of the material, additional physical properties must be measured in order to fully characterize the special cocktails combining SIMs. Given the demonstrated low cooling rates with no significant crystallization effect (discussed in greater detail in [5]), the application of SIMs appears very promising for the development of new cryopreservation techniques.
Acknowledgments
This project has been supported by Award Number R21EB011751 from the National Institute of Biomedical Imaging and Bioengineering. The content is solely the responsibility of the authors and does not necessarily represent the official views of the National Institute of Biomedical Imaging and Bioengineering or the National Institutes of Health
Footnotes
Publisher's Disclaimer: This is a PDF file of an unedited manuscript that has been accepted for publication. As a service to our customers we are providing this early version of the manuscript. The manuscript will undergo copyediting, typesetting, and review of the resulting proof before it is published in its final citable form. Please note that during the production process errors may be discovered which could affect the content, and all legal disclaimers that apply to the journal pertain.
References
- 1.Adam M, Hu JF, Lange P, Wolfinbarger L., Jr The effect of liquid nitrogen submersion on cryopreserved human heart valves. Cryobiology. 1990;27:605–614. doi: 10.1016/s0011-2240(05)80028-8. [DOI] [PubMed] [Google Scholar]
- 2.Buján J, Pascual G, López R, Corrales C, Rodríguez M, Turégano F, Bellón JM. Gradual thawing improves the preservation of cryopreserved arteries. Cryobiology. 2001;42:256–265. doi: 10.1006/cryo.2001.2329. [DOI] [PubMed] [Google Scholar]
- 3.Fahy GM. Organ Recovery Systems, Inc; US Patent number 6773877. Methods of using ice-controlling molecules. 2004
- 4.Feig JSG, Williams AC, Lin CC, Rabin Y. Developing the cryomacroscope for cryopreservation applications. 38th Annual Northeast Bioengineering Conference; Philadelphia, PA. March 16–18, 2012. [Google Scholar]
- 5.Eisenberg DP, Taylor MJ, Rabin Y. Thermal expansion of cryoprotective cocktail, DP6, combined with synthetic ice modulators in the presence and absence of biological tissues. Cryobiology. 2012;65(2):117–125. doi: 10.1016/j.cryobiol.2012.04.011. [DOI] [PMC free article] [PubMed] [Google Scholar]
- 6.Hatch K, Danilowicz C, Coljee V, Prentiss M. Demonstration that the shear force required to separate short double-stranded DNA does not increase significantly with sequence length for sequences longer than 25 base pairs. Phys Rev E. 2008;78(1):011920. doi: 10.1103/PhysRevE.78.011920. [DOI] [PubMed] [Google Scholar]
- 7.Holman JP. Experimental methods for engineers. 7. Chap 3. McGraw-Hill; 2000. [Google Scholar]
- 8.Jimenez-Rios JL, Rabin Y. Thermal expansion of blood vessels in low cryogenic temperatures. Part I: A new experimental device. Cryobiology. 2006;52(2):269–283. doi: 10.1016/j.cryobiol.2005.12.005. [DOI] [PMC free article] [PubMed] [Google Scholar]
- 9.Jimenez-Rios JL, Rabin Y. Thermal expansion of blood vessels in low cryogenic temperatures. Part II: Measurements of blood vessels vitrified with atVS55, DP6, <>and 7.05M DMSO. Cryobiology. 2006;52(2):284–294. doi: 10.1016/j.cryobiol.2005.12.006. [DOI] [PMC free article] [PubMed] [Google Scholar]
- 10.Jimenez-Rios JL, Rabin Y. A new device for mechanical testing of blood vessels at cryogenic temperatures. Journal of Experimental Mechanics. 2007;47:337–346. doi: 10.1007/s11340-007-9038-8. [DOI] [PMC free article] [PubMed] [Google Scholar]
- 11.Jimenez-Rios JL, Steif PS, Rabin Y. Stress-strain measurements and viscoelastic response of blood vessels cryopreserved by vitrification. Annals of Biomedical Engineering. 2007;35(12):2077–2086. doi: 10.1007/s10439-007-9372-0. [DOI] [PMC free article] [PubMed] [Google Scholar]
- 12.Muldrew K, McGann LE. The osmotic rupture hypothesis of intracellular freezing injury. Biophys J. 1994;66:532–541. doi: 10.1016/s0006-3495(94)80806-9. [DOI] [PMC free article] [PubMed] [Google Scholar]
- 13.Pegg DE, Wusteman MC, Boylan S. Fractures in cryopreserved elastic arteries. Cryobiology. 1997;34:183–192. doi: 10.1006/cryo.1996.1997. [DOI] [PubMed] [Google Scholar]
- 14.Plitz J, Rabin Y, Walsh J. The effect of thermal expansion of ingredients on the cocktails VS55 and DP6. Cell Preservation Technology. 2004;2(3):215–226. [Google Scholar]
- 15.Rabin Y, Feig JSG, Williams AC, Lin CC, Thaokar C. Cryomacroscopy in 3D, A device prototype for the study of cryopreservation. ASME 2012 Summer Bioengineering Conference - SBC 2012; Fajardo, Puerto Rico, USA. June 20–23, 2012. [Google Scholar]
- 16.Rabin Y, Plitz J. Thermal expansion of blood vessels and muscle specimens permeated with DMSO, DP6, and VS55 in cryogenic temperatures. Annals of Biomedical Engineering. 2005;33(9):1213–1228. doi: 10.1007/s10439-005-5364-0. [DOI] [PubMed] [Google Scholar]
- 17.Rabin Y, Steif PS. Thermal stresses in a freezing sphere and its application to cryobiology. ASME Journal of Applied Mechanics. 1998;65:328–333. [Google Scholar]
- 18.Rabin Y, Steif PS. Thermal stress modeling in cryosurgery. International Journal of Solids and Structures. 2000;37:2363–2375. [Google Scholar]
- 19.Rabin Y, Steif PS. Solid mechanics aspect of cryobiology. In: Baust JG, Baust JM, editors. Advances in Biopresevation. CRC Press; Boca Raton: 2006. pp. 359–382. [Google Scholar]
- 20.Rabin Y, Taylor MJ, Walsh JR, Baicu S, Steif PS. Cryomacroscopy of vitrification, Part I: A prototype and experimental observations on the cocktails VS55 and DP6. Cell Preservation Technology. 2005;3(3):169–183. doi: 10.1089/cpt.2005.3.169. [DOI] [PMC free article] [PubMed] [Google Scholar]
- 21.Scholtze H. Glass: nature, structure, and properties. New York: Springer-Verlag; 1991. [Google Scholar]
- 22.Steif PS, Noday DA, Rabin Y. Can Thermal expansion differences between cryopreserved tissue and cryoprotective agents alone cause cracking? CryoLetters. 2009;30(6):414–421. [PMC free article] [PubMed] [Google Scholar]
- 23.Steif PS, Palastro MC, Rabin Y. Continuum mechanics analysis of fracture progression in the vitrified cryoprotective agent DP6. ASME Biomechanical Engineering. 2008;130(2):021006. doi: 10.1115/1.2898716. [DOI] [PMC free article] [PubMed] [Google Scholar]
- 24.Steif PS, Palastro MC, Rabin Y. The effect of temperature gradients on stress development during cryopreservation via vitrification. Cell Preservation Technology. 2007;5:104–115. doi: 10.1089/cpt.2007.9994. [DOI] [PMC free article] [PubMed] [Google Scholar]
- 25.Steif PS, Palastro MC, Rabin Y. Analysis of the effect of partial vitrification on stress development in cryopreserved blood vessels. Medical Engineering & Physics. 2007;29(6):661–670. doi: 10.1016/j.medengphy.2006.07.010. [DOI] [PMC free article] [PubMed] [Google Scholar]
- 26.Taylor MJ, Baicu S. Review of vitreous islet cryopreservation: some practical issues and their resolution. Organogenesis. 2009;5 (3):155–166. doi: 10.4161/org.5.3.9812. [DOI] [PMC free article] [PubMed] [Google Scholar]
- 27.Taylor MJ, Song YC, Brockbank KGM. Vitrification in tissue preservation: new developments. In: Fuller BJ, Lane N, Benson E, editors. Life in the Frozen State. Taylor and Francis Books; London: 2004. pp. 603–642. [Google Scholar]
- 28.Triyoso DH, Good TA. Pulsatile shear stress leads to DNA fragmentation in human SH-SY5Y neuroblastoma cell line. J Physiol. 1999;515:355–65. doi: 10.1111/j.1469-7793.1999.355ac.x. [DOI] [PMC free article] [PubMed] [Google Scholar]


