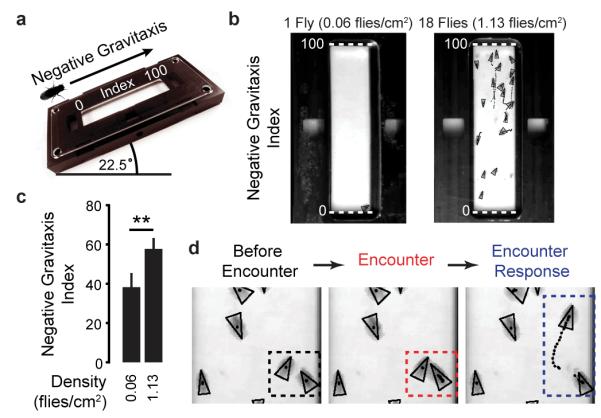
Extended Data Figure 7. Collective negative gravitaxis in Drosophila.
a, A schematic of the negative gravitaxis experiment. Flies are placed at the lowest point of a behavioural arena tilted at 22.5°. The flies’ positions are normalised to the long-axis of the arena ranging from 0 (arena bottom, lowest elevation) to 100 (arena top, highest elevation). b, Image of flies (black triangles) and their trajectories during 1 s (black dotted lines) in the negative gravitaxis experiment. Shown are representative images of an experiment with one fly (density = 0.06 flies/cm2) and an experiment with 18 flies (density = 1.13 flies/cm2). Negative Gravitaxis Index value positions of 0 (lowest elevation in the arena) and 100 (highest elevation in the arena) are shown (white-dashed lines). c, To obtain a Negative Gravitaxis Index for a given fly, its position was averaged during the second minute of the experiment. Shown are the mean and s.d. of Negative Gravitaxis Indices for wild-type animals at densities of either 0.06 or 1.13 flies/cm2 (n = 28 and 30 experiments respectively). d, Images of two flies (left, black triangles in black dashed box) undergoing an Encounter (middle, red dashed box) that results in an Encounter Response (right, blue dashed box) during a negative gravitaxis experiment.

