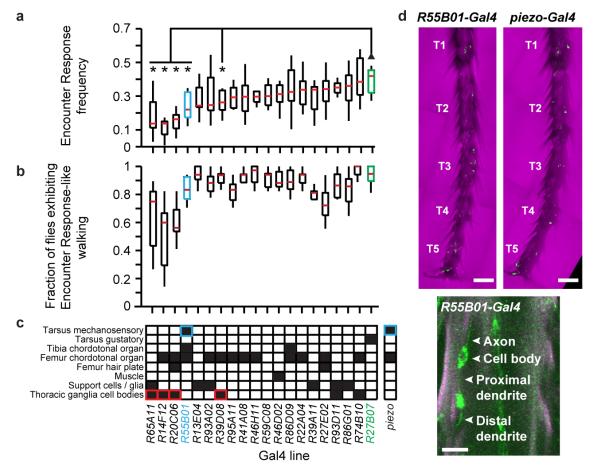
Extended Data Figure 4. A behavioural screen for neurons mediating Encounter Responses and their leg expression patterns.
a, Frequency of Encounter Responses for each Gal4 driver expressing UAS-Tnt. Driver lines are sorted by median frequency of Encounter Responses. A single asterisk (*) indicates P <0.05 for a Bonferroni-corrected Mann-Whitney U-test comparing a given line against a gustatory neuron expression line, R27B07-Gal4 (green). Density = 1.13 flies/cm2 and n = 10 experiments for each line. The selected line, R55B01-Gal4, drives expression in distal leg mechanosensory neurons (cyan). b, The fraction of flies in each experiment exhibiting walking velocities that meet the criteria for Encounter Responses (mean velocity magnitude greater than 5 mm/s for more than 0.5 s) at any time during the experiment. Lines are sorted and colour-coded as in panel a. c, The identity and leg expression patterns of Gal4 drivers tested in the screen. Black boxes denote the presence of a given cell class. A cyan outline indicates distal leg mechanosensory neuron expression. A red outline indicates thoracic ganglion expression in lines with significant reductions in Encounter Response frequency. The expression pattern is also shown for piezo-Gal4, which was used in subsequent experiments to refine identification of the leg mechanosensory neuron class required for Encounter Responses. d, Tarsal segments for w;UAS-tdCD4:GFP;R55B01-Gal4 (left) and w;UAS-tdCD4:GFP;piezo-Gal4 (right) flies. Each tarsal segment is labelled from proximal to distal (T1-T5). Endogenous GFP fluorescence (green) is superimposed upon a transmitted light image (magenta). The scale bars are 30 μm. Below is a high-resolution image of a mechanosensory sensilla neuron on the tarsus of a w;UAS-tdCD4:GFP;R55B01-Gal4 fly. Endogenous GFP fluorescence (green) is superimposed on cuticular autofluorescence (magenta). The axon, cell body, and dendrite of this neuron are labelled. The scale bar is 10 μm.

