Abstract
The germ layer concept has been one of the foremost organizing principles in developmental biology, classification, systematics and evolution for 150 years1-3. Of the three germ layers, the mesoderm is found in bilaterian animals but is absent in species in the phyla Cnidaria and Ctenophora, which has been taken as evidence that the mesoderm was the final germ layer to evolve1,4,5. The origin of the ectoderm and endoderm germ layers, however, remains unclear with models supporting the antecedence of each as well as a simultaneous origin4,6-9. Here, we determine the temporal and spatial components of gene expression spanning embryonic development for all Caenorhabditis elegans genes and use it to determine the evolutionary ages of the germ layers. The gene expression program of the mesoderm is induced after those of the ectoderm and endoderm, thus making it the last germ layer to both evolve and develop. Strikingly, the C. elegans endoderm and ectoderm expression programs do not co-induce; rather the endoderm activates earlier, and this is observed also in the expression of endoderm orthologs during the embryology of Xenopus tropicalis, Nematostella vectensis, and the sponge Amphimedon queenslandica. Querying for the phylogenetic ages of specifically expressed genes revealed that the endoderm is comprised of older genes. Taken together, we propose that the endoderm program dates back to the origin of multicellularity, while the ectoderm originated as a secondary germ layer freed from ancestral feeding functions.
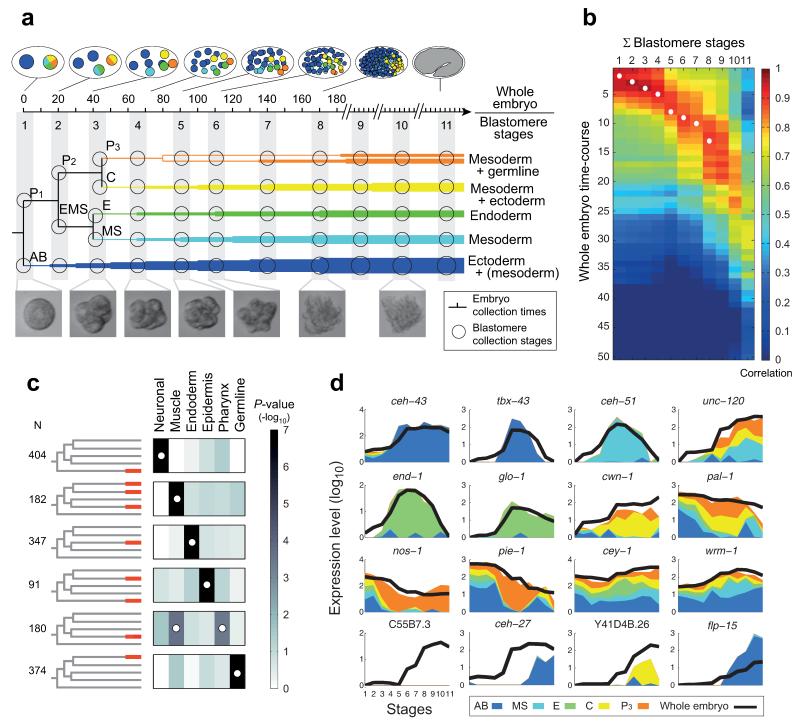
Embryonic development in C. elegans begins with a series of asymmetric cell divisions producing five somatic founder cells (AB, MS, E, C, D), each giving rise to a limited number of tissue types, and a single germline founder cell (P4) (Fig. 1a)10. To globally determine spatiotemporal gene expression in the C. elegans embryo, we isolated five blastomeres (AB, MS, E, C, and P3) that collectively amount to the entire embryo and cultured them in vitro11 to obtain a time course (Fig. 1a and Extended Data Fig. 1). The blastomeres divided well in vitro, maintaining the expected relative division rates: all AB cells maintained a synchronized division rate, while E divided slower than MS (Extended Data Fig. 1). We analyzed the transcriptomes of these collected blastomeres using our recently described CEL-Seq method12 for performing single-cell RNA-Seq13,14. To assay the degree to which the cultured blastomeres exhibit the expected expression, we also generated a whole-embryo CEL-Seq time-course, spanning the 1-cell stage to the free-living larva, at 10 minute resolution up to muscle movement, and then roughly every 30 minutes (Fig. 1a).
Figure 1. Determining the expression profiles of the C. elegans embryonic founder cell lineages.
a, Sample collections are indicated for the shown C. elegans blastomere lineages (circles, Extended Data Fig. 1 and Extended Data Table 2) and whole embryos (notches, in minutes). b, Heat map showing Pearson’s correlation coefficients among the transcriptomes of the whole embryo and the sum of the individual blastomere lineages. White circles indicate pairs of blastomere stages and embryonic time-points expected to be most similar (Extended Data Table 2). c, P-values of enrichment across curated lists of genes for the indicated lineage-specific gene expression clusters (Extended Data Table 3 and Extended Data Fig. 2d). The white circles indicate the expected differentiation of each expression cluster (Extended Data Table 1). d, Spatial and temporal gene expression profiles.
The quality of the dataset was assessed in several ways. First, a 0.9 average Pearson’s correlation coefficient of the biological replicates indicates both that the blastomeres follow similar paths as they differentiate in isolation and that the CEL-Seq method is reproducible (Extended Data Fig. 2a). Second, we compared the whole-embryo transcriptomes to a weighted sum of the time-courses of the five lineages (Fig. 1b), and found that the blastomere data mirror the gene expression of the whole embryo, at the expected times (circles in Fig. 1b). Third, we show that the overall differentiation in vitro is intact, as the blastomere lineages express the expected differentiation events (Fig. 1c). Finally, we found that these profiles compared well with a previously published set of embryonic expression profiles15 (Extended Data Fig. 2e and Supplementary Table 1). Our data reveals the spatial and temporal expression profile for each gene (Fig. 1d). For example, unc-120/SRF has expression in MS, C, and P3, as expected from its known role as a myogenic master regulator16.
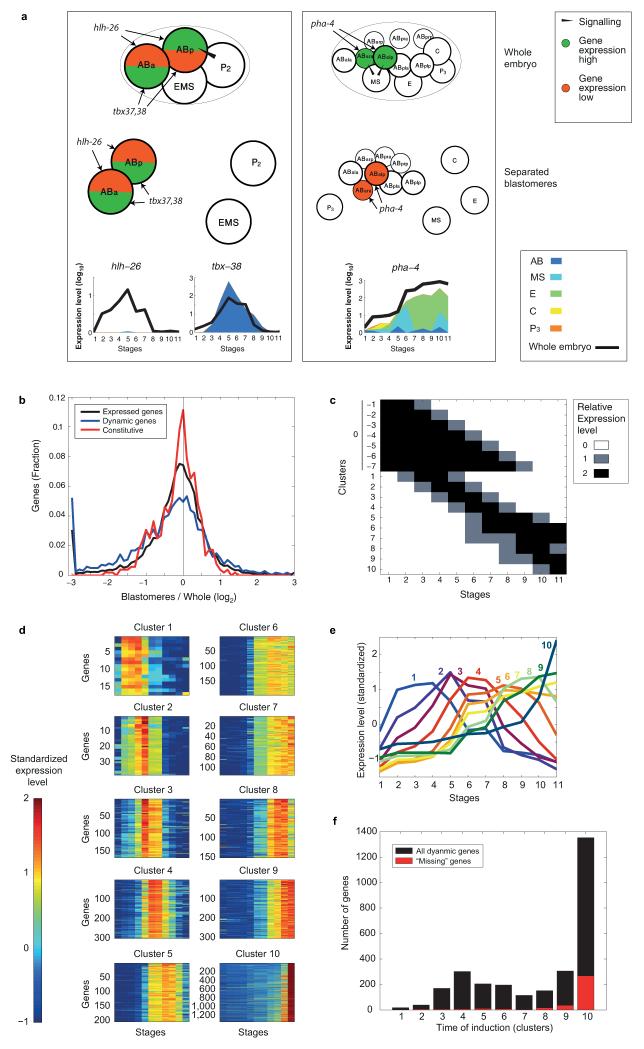
Since the five lineages each develop in isolation from one another, their context in the embryo is lost and, consequently, absence of signaling between cell lineages must affect some gene regulation. Most noticeably, the specification of the pharynx in the AB lineage is dependent upon two Notch signaling events17 and indeed we do not see expression of pharyngeal specification genes in the AB lineage (Extended Data Fig. 3a). Thus, while we found that for some genes expected levels are maintained (for example, wrm-1, a beta-catenin-like protein, pal-1/Caudal, and pie-1, a zinc-finger protein; Fig. 1d), for some genes, expression is higher than in the whole embryo (flp-15, Fig. 1d), and for others expression is at lower levels (ceh-27, a homeodomain protein and Y41D4B.26; Fig. 1d). We found a general coherence between the time-courses: 82% of the genes are within one log2 unit difference (Extended Data Fig. 3b). Of the genes that do differ, we found a strong bias for genes with lower expression in the blastomere time-course as opposed to higher expression. For 380 genes expressed in the whole-embryo time-course, we detected no expression at all in the blastomere time-courses (Supplementary Table 2; for example C55B7.3 in Fig. 1d). Genes with “missing” expression tend to be expressed late in development (Extended Data Fig. 3f), indicating that, while in earlier development very few genes are unaccounted for in the dataset, by the end of the time-course noticeable deviations from standard development are apparent.
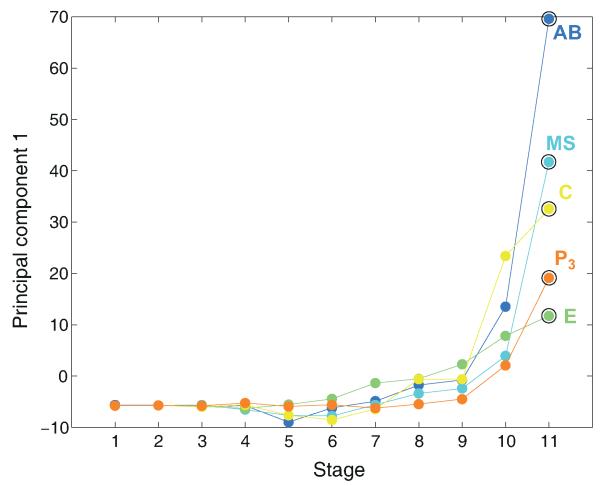
Performing principal component analysis (PCA) on the blastomere transcriptomes distinguished the three germ layers (Fig. 2a). The three principal components collectively explained 41% of the variation in gene expression across the five lineages. PC1 correlated with developmental time reflecting the expression of genes with non-specific expression (Extended Data Fig. 4). In general, PC2 distinguished the endoderm while PC3 distinguished ectoderm from mesoderm (Fig. 2a). The C lineage clusters with the other mesodermal lineages, though it produces both muscle and epidermis, probably because it contains twice as many muscle cells as epidermal cells10. The overall distribution of the time-courses into germ layers provides evidence for their distinction at the transcriptomic level.
Figure 2. Dynamics of germ layer gene expression throughout development.
a, PCA on dynamically expressed genes for the five lineage time-courses (See Extended Data Fig. 4 for PC1). Adjacent stages of the same lineage are connected by a line, the terminal stage is indicated by a circle. b, Heat map indicating Pearson’s correlation coefficients between blastomere expression profile of dynamically expressed genes. The right-side bars indicate the time of expression (temporal clusters, as in Extended Data Fig. 3c-e) and the location of expression. c, Summary of location of expression for genes according to temporal clusters.
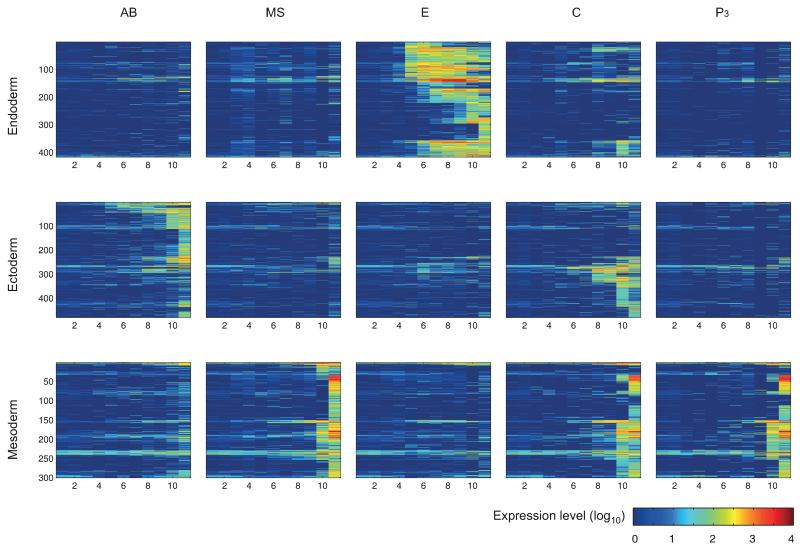
To identify the specific genes uniquely expressed in each germ layer, we computed the correlation of the expression profile of each of the dynamically expressed genes to all others, and clustered them using hierarchical clustering (Fig. 2b). We detected 25 clusters, each comprising at least 10 genes. Gene members in a given cluster tended to have the same timing and location of expression (Fig. 2b, see right bars). 54% of dynamically expressed genes are not specific to particular lineages (Fig. 2b), with nearly half deriving from the maternal transcriptome. The dynamically expressed genes with lineage specificity were divided according to their germ layer of expression (Extended Data Fig. 5), while further requiring each germ layer annotated gene to have at least two thirds of its expression in that germ layer (Supplementary Table 4). Mapping these to their time of induction in the whole embryo, we found that germ layer specific expression increases with developmental time (Fig. 2c). Moreover, different germ layers initiate their programs at different times – first the endoderm, then the ectodermal expression, and finally the mesodermal expression (Fig. 2c). This general pattern is also reflected when examining the dynamics of the germ layers through their average expression of the genes (Fig. 3).
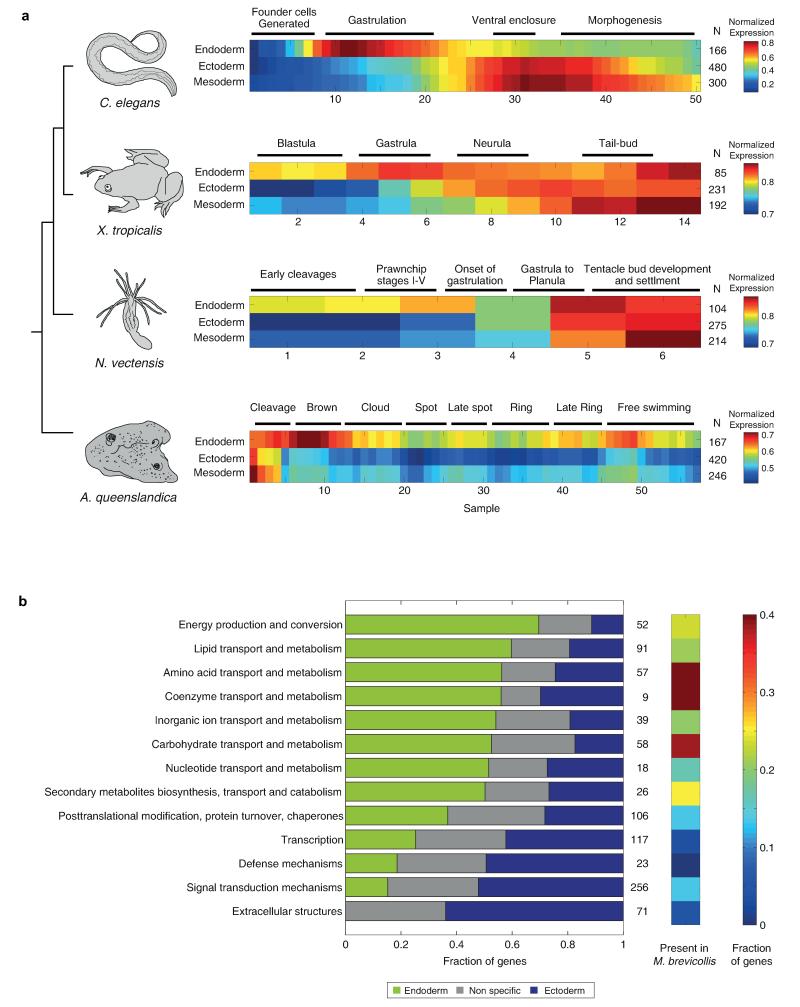
Figure 3. The endoderm expression program precedes the ectoderm program in diverse species.
Expression of germ layer genes in C. elegans, and their orthologs in X. tropicalis, N. vectensis, and A. queenslandica. The average is computed on the maximum-normalized gene profiles.
The dynamics of the germ layer expression programs may be unique to C. elegans or a general property of animal development. To test this, we analyzed the previously characterized transcriptomes of the distantly related species Xenopus tropicalis18, Nematostella vectensis19, and the sponge Amphimedon queenslandica20. For each species, we mapped the orthologs of the C. elegans germ layer genes in the respective genome and computed their average developmental expression profiles. We found a general recapitulation of the order found in C. elegans (Fig. 3). The onset of the endodermal program in Xenopus occurs during gastrulation, well before that of the ectodermal and mesodermal programs (P<0.01, Kolmogorov-Smirnov test). In Nematostella, we also detected a major rise in the expression of endoderm orthologs during gastrulation (P<10−3). The observation that mesoderm orthologs in Nematostella are expressed in the planula is consistent with the notion that the Bilaterian mesoderm was co-opted from late-expressed genes. In Amphimedon, endoderm orthologs are enriched for expression during the ‘brown’ stage, in which two layers first become visible. Expression of the orthologs of the ectoderm and mesoderm germ layer genes, in contrast, is seen only in the early stages (P<10−4), reflecting that they are solely deposited as maternal transcripts.
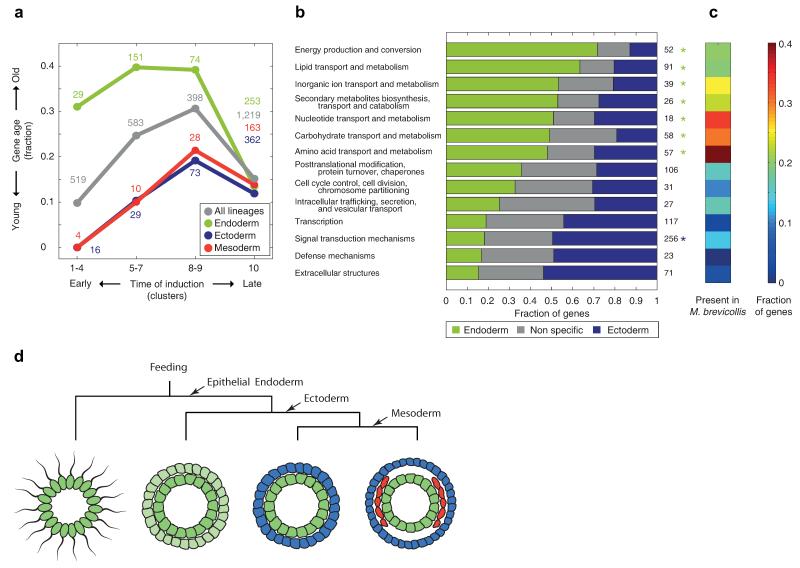
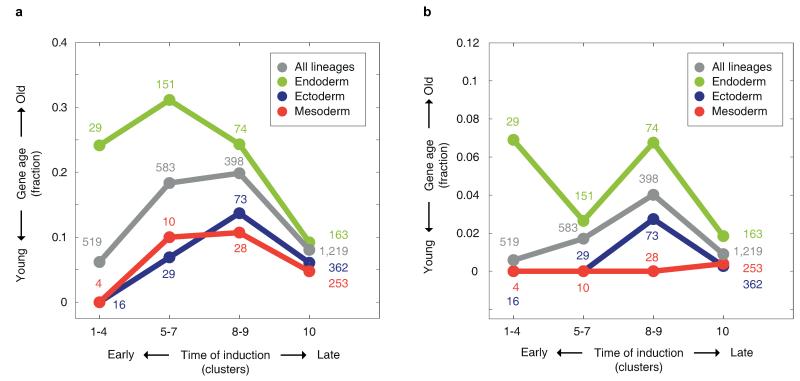
The distinct and conserved temporal inductions of germ layer specific expression (Fig. 3), with the mesoderm both appearing last in evolutionary time-scales and developing last in the embryo, support accretion of processes as a mechanism in the evolution of development7. Extending this reasoning to the endoderm suggests that it originated prior to the ectoderm. According to this scenario, the endoderm is expected to express genes of older origin. To test this, we studied gene ages using the phylostratigraphy approach which infers a gene’s age from the phylogenetic breadth of its orthologs21. For a set of temporal stages, we computed for genes dynamically expressed at those times, the fraction that have orthologs in non-metazoan opisthokont Eukaryotes. Using this analysis, we found that genes expressed in mid-development are generally of older origin than those expressed at other embryonic stages (Fig. 4a), consistent with previous analyses21-23. Examining the evolutionary age of the individual germ layers, we found that genes specifically expressed in the endoderm have a significantly higher fraction of older genes (P<10−5, Chi-squared test). In contrast, the ectoderm and mesoderm genes are significantly younger (P<10−3, Chi-squared test).
Figure 4. The germ layers exhibit distinct gene ages and functional category enrichments.
a, Fraction of ‘old’ genes – defined as presence of orthologs in other opisthokont Eukaryotes – across the indicated temporal induction clusters and germ layers. Different gene age thresholds show similar results (Extended Data Fig. 6). b, For the shown functional categories, the bars indicate the fraction of genes in the endoderm gene set, ectoderm gene set, and other dynamic and zygotically expressed genes. Asterisks indicate significant endoderm (green) and ectoderm (blue) enrichments (P<0.01, Hypergeometric distribution). c, The fraction of orthologs in M. brevicollis is indicated for each functional category. d, A model for germ layer evolution.
Since the phylogenetic analysis revealed that endoderm genes are comprised of genes of older origin, we enquired into their functional properties. We found that endoderm-specific genes are enriched for energy production, metabolism and transport functions (Fig. 4b, Extended Data Fig. 7). The observation that the endoderm is enriched in general feeding functions suggests that it is closer, relative to the ectoderm, in its characteristics to the choanoflagellate-like ancestor. To test this, we examined the level of orthology with the choanoflagellate M. brevicollis24 for each of the functional classes. Indeed we found a higher fraction of M. brevicollis orthologs in endoderm enriched functional classes, such as transport and metabolism (Fig. 4c), suggesting that the endoderm is most closely aligned with the feeding capabilities of the free-living choanoflagellates. Moreover, while transport and metabolism appear to be related to “housekeeping” functions, we observe, in contrast, that they are induced early on in embryogenesis in the endoderm germ layer program.
Our results shed light on the evolutionary history of the endoderm germ layer (Fig. 4d). At the dawn of the metazoans, choanoflagellate-like colonial organisms comprised individual cells that likely all retained feeding functions. However, with the evolution of epithelial cells, the possibility of distinct cell-types emerged, as cells could communicate by strong membrane connections. Our analysis of the composition and dynamics of the germ layer transcriptomes leads us to propose that the endoderm program has retained the feeding functions of its choanoflagellate-like ancestor. Expression in the Amphimedon sponge is informative since physical layers of epithelia25 exist in this organism. The expression of sponge orthologs of the endoderm gene set suggests that Amphimedon only has a functional “proto-endoderm” germ layer. This is also supported by recent evidence that the GATA gene in Amphimedon is expressed in the internal layer in the sponge26.
In the lineage leading to the eumetazoans, the transport and metabolic functions carried out by internal cells may have allowed the external cells to specialize into an ectodermal germ layer (Fig. 4d). In this model, the ancestry of the endoderm follows from its role in feeding, while only later in evolution it was coupled with its current function as the gastrulating internal layer. This scenario is in line with Haeckel’s gastrea hypothesis27,28 which posits a layered spherical organism as the urmetazoan. However, our model of feeding processes driving selection of the endodermal identity is also consistent with an ancestral flattened placula, as proposed by Bütschli29,30, that subsequently evolved into a two-layered stage where the lower epithelia specialized in digestion.
METHODS
Blastomere isolation and culturing
Egg shells were removed from C. elegans embryos and the resulting blastomeres cultured as previously described11. The egg shell and vitelline membrane were removed at the two cell stage, and the embryo separated to the AB and P1 blastomeres by pipetting. P1 was allowed to undergo one cell division and separated to EMS and P2, or two cell divisions before being separated to the MS, E, C and P3 blastomeres, in order to allow the Wnt signaling from P2 to EMS (Extended Data Fig. 1)31. The five lineages were cultured in a humid chamber in EGM11, and division of the E blastomere was used as a clock (Extended Data Table 2). All lineages from a single embryo were frozen at the same time. Individual samples were transferred with a micro-pipette into a 0.5μl drop of egg salts placed on the cap of a 0.5 ml Lobind Eppendorf tube, excess liquid was aspirated off, and frozen in liquid nitrogen. Samples were stored at −80°C. Samples were collected in triplicates, correlation between replicates are shown in Extended Data Figure 2a. Throughout this work, ‘correlation’ denotes Pearson’s correlation coefficient.
Whole-embryo time-course
Precisely-staged single embryos were collected at the 1-cell, 2-cell, and 4-cell stages, and 10 minute intervals henceforth up to muscle movement, and then roughly every 30 minutes; 50 embryos in total. RNA from each single embryo was prepared using TRIzol as previously described22 with one modification: 1μl of the ERCC spike-in kit32 (1:500,000 dilution) was added with the TRIzol to each sample.
Single cell and whole-embryo transcriptomics
CEL-Seq12 was used to amplify and sequence both RNA from the whole embryos and the cultured blastomeres. For the whole embryos - RNA was re-suspended in 5 μl water and 1 μl primer added. 1.2 μl are taken for the amplification. For the blastomeres, 1 μl of a 1:500,000 dilution of the ERCC spike-in kit and 0.2 μl of the primer were mixed (a total of 1.2 μl) and added directly to the lid of the Eppendorf tube where the cell was frozen. Linear amplification and library preparation were as previously described12. Libraries were sequenced on the Illumina HiSeq2000 according to standard protocols. Paired-end sequencing was performed, reading at least 11 bases for read 1, and 35 bases for read 2, and the Illumina barcode when needed. The complete data set and has been deposited in the Gene Expression Omnibus with accession code GSE50548.
Expression analysis pipeline
Transcript abundances were obtained from the sequencing data as previously described12. Briefly, libraries were sequenced on the Illumina HiSeq2000 according to standard, paired-end sequencing, using the CEL-Seq protocol12. Mapping of the reads was performed using BWA33, version 0.6.1, against the Caenorhabditis elegans WBCel215 genome (bwa aln −n 0.04 −o 1 −e −1 −d 16 −i 5 −k 2 −M 3 −O 11 −E 4). Read counting performed using htseq-count version 0.5.3p1 defaults, against WS230 annotation exons. The counts were normalized by dividing by the total number of mapped reads for each gene and multiplying with 106, yielding the estimated gene expression levels in transcripts per million (tpm).
Warped whole-embryo time-course
The whole embryo time-course (Extended Data Fig. 2c) was compared to the blastomere time-courses (Fig. 1b) using a restricted set of 4,527 genes with a log2 fold-change of at least 5 across the 50-embryo time-course, >100 tpm maximum expression, and <10 tpm minimum expression. These cutoffs were used to limit analysis to only the most dynamically expressed genes given the distinct dynamics of the whole-embryo time-course. The minimum expression threshold further selects for temporally restricted expression. For each blastomere time point, the five lineages were summed up to represent the whole embryo, taking in to account the fraction of the whole embryo represented by the specific lineage (half for AB, one eighth each for E, MS, C, and P3). An eleven-stage warped whole embryo time-course was generated by taking for each stage a weighted average across the 50 embryos based upon the correlations with the blastomere time-course, raised to the tenth power. Different definitions of this set resulted in very similar warped profiles.
Spatial and temporal gene expression profiles
In the profiles shown in Figure 1d, the log expression is split among the lineages according to the fraction in the natural scale expression. The black line indicates the expression of the whole embryo time-course.
Definition of gene sets for dynamically expressed and differentiation genes
The 3,910 dynamically expressed genes were defined based upon the warped whole-embryo time-course with >3 log2 fold-change, >10 tpm maximum expression, and <100 tpm minimum expression (Extended Data Fig. 2b). These parameters were adapted to the warped time-course which is less dynamic due to averaging effects. ‘Constitutively expressed’ genes (Extended Data Fig. 3b) were defined as highly expressed genes (>500 tpm maximum expression) but not members of the dynamically expressed genes. ‘Expressed genes’ (Extended Data Fig. 3b) were defined as those with >10 tpm maximum expression. The differentiation gene sets (Fig. 1c and Extended Data Fig. 2d) were generated for each group – neurons (AB), muscle (MS, C, and P3), endoderm (E), epidermis (AB and C), pharynx (MS), and germline (P3) – by examining terminal expression in the time-courses. Genes were assigned to one of the seven sets if they exhibited expression ≥50 tpm in that group and a correlation coefficient greater than 0.7 of expression across the lineages with the expected expression pattern as highlighted in red on the lineage trees. The parameters were set according to their definition of similarly sized sets.
Clusters of temporal gene expression patterns
A correlation coefficient was computed for each gene’s temporal warped whole embryo time-course against each of 17 idealized expression profiles (Extended Data Fig. 3c). The idealized profiles were constructed based upon average expression of clusters using the k-means algorithm and represent the general patterns of the transcriptome. The idealized profiles are vectors of the same length (11) as the warped time-course profile but with digital expression of three possible values: 0, 1, and 2. Each dynamically expressed gene was then assigned to the idealized profile to which it best correlates. Seven of the 17 idealized profiles correspond to ‘maternal’ profiles (Extended Data Fig. 3c) in which expression is initially high and then drops. We collapsed these seven profiles to one profile and denoted it as the ‘0’ cluster in Figure 2b.
Hierarchical clustering and definition of germ layer genes
Hierarchical clustering was performed using the ‘linkage’ function in MATLAB using the unweighted center of mass distance (UPGMC) algorithm. The top 20 clusters with at least ten genes were examined (Fig. 2b). Clusters with at least 65% of the genes of the same germ layer contributed their genes with the dominant germ layer. Germ layers were assigned by correlating the average expression with germ layer-specific patterns with a cutoff of 0.6 correlation with the following idealized vectors: endoderm = [00100], ectoderm = [10000]; and mesoderm is [01011]; where the order is AB, MS, E, C, and P3. Germ layer genes were defined according to the sum of the genes identified by the clusters and are indicated in Figure 2b. We further filtered the germ layer gene sets by keeping only those genes whose expression is partitioned across the germ layers such that at least two thirds of the expression is in that germ layer.
Gene age
Orthologies were retrieved from the MetaPHoR project using the 2010 release34. Taxonomies were retrieved from the NCBI Taxonomy. For each C. elegans gene, if the gene is also present in at least 25% of the examined non-metazoan Ophistokopnts eukaryotes it was annotated as “old”. Similar results were also observed for the definition of “old” genes at the level of Eukaryotes and Cellular life (Extended Data Fig. 6). MetaPHoR were also used to delineate the orthologies shown in Figure 4c for M. brevicollis.
Orthologous gene expression profiles
The developmental time-courses of Amphimedon queenslandica, Xenopus tropicalis, and Nematostella vectensis have been previously described18,20,19. For these species, the latest protein annotations were used to detect orthologies: Amphimedon queenslandica - Aqu2, Xenopus tropicalis - JGI_4.2, and Nematostella vectensis - GCA_000209225. Amphimedon queenslandica orthologies were delineated using OrthoMCL35 and those of Xenopus tropicalis and Nematostella vectensis were retrieved from Biomart36 which contained the annotations on the noted versions. We included in the analysis genes whose maximum expression is greater than the dataset-specific threshold; computed as the median average expression across all genes. Expression profiles passing this threshold were each normalized to their own maximum expression. The Kolmogorov-Smirnov test was used to test for significantly different temporal dynamics between endoderm and ectoderm expression. For this analysis the timing of expression for each gene was computed as the stage at which half of the sum expression has occurred.
Functional categories analysis
COG37 functional category annotations were retrieved from WormMart38. For simplicity, annotations of “general function prediction only” and “function unknown” were ignored, as well as those categories capturing less than 3% of the genes. Enrichments were computed using the hypergeometric distribution.
Extended Data
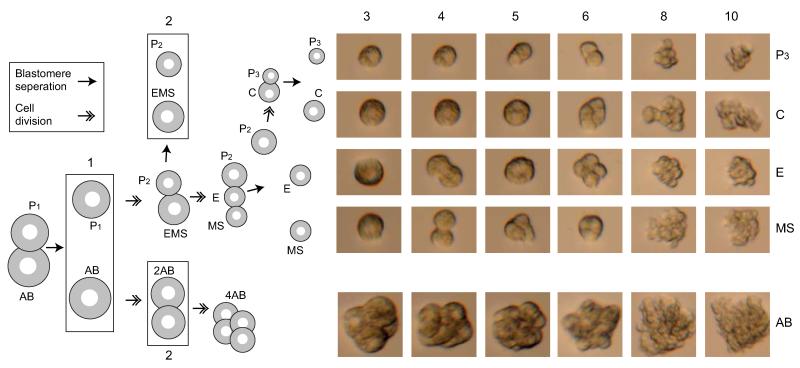
Extended Data Figure 1. In vitro culturing of the C. elegans embryonic founder blastomeres.
The cells are separated as shown in the left schematic and then cultured in embryonic growth medium11 as shown in the micrographs on the right. The numbers indicate the stages in which the cells were collected for transcriptome analysis. Six of the eleven stages are shown in the micrographs.
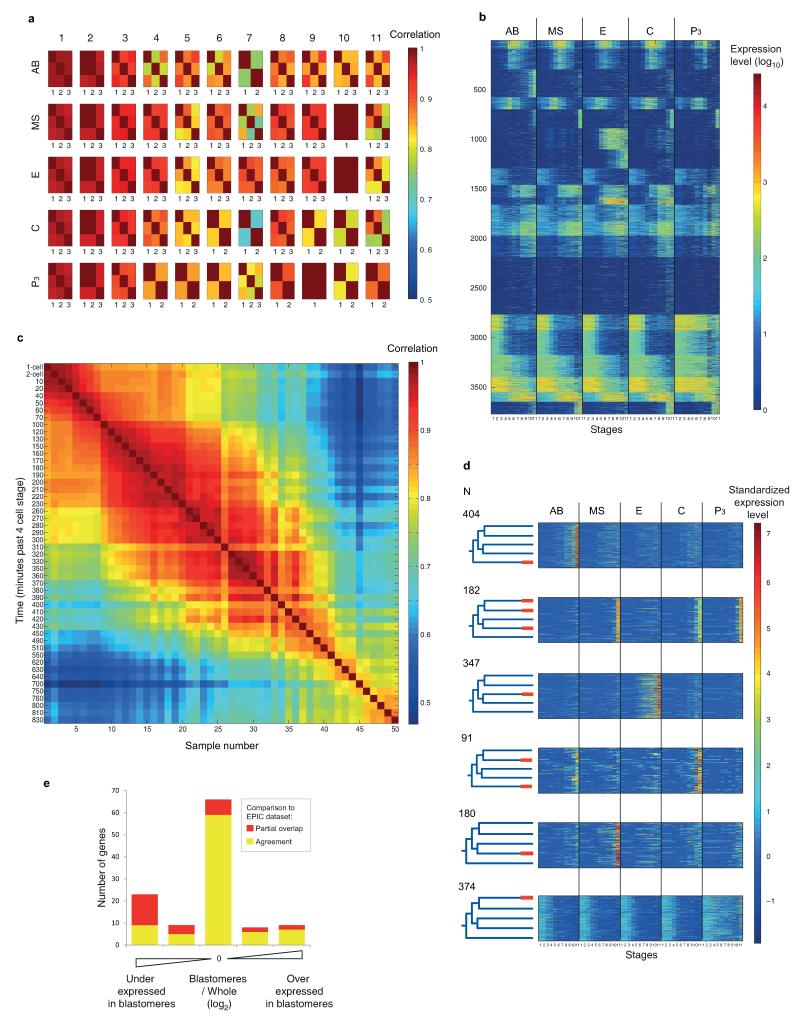
Extended Data Figure 2. A transcriptomic survey of C. elegans embryonic founder cell lineages.
a, Replicates of the embryonic blastomere time-courses. The heatmaps show the correlations among the replicates for each blastomere lineage at each of the eleven examined stages. For three blastomere/stages there were no replicates. The median correlation coefficient is 0.9. Samples were collected in triplicates. Only samples with at least 750,000 reads were used which has been previously shown to be of sufficient sequencing depth for CEL-Seq12. Supplementary Table 3 provides the sequencing statistics for each sample. b, Expression profiles of the 3,910 dynamic genes across the blastomere lineage time-courses. See methods for definition of dynamic genes. c, Correlation coefficients between samples of the whole embryo time-course. Each of the 50 samples comprises a single embryo, collected at the indicated minutes past the 4-cell stage. Again, only samples with at least 750,000 reads were used and Supplementary Table 3 provides the sequencing statistics for each sample. d, The expression profiles of the 1,664 genes with differentiated expression analyzed in Figure 1c. Each profile was “standardized” by subtracting its mean and dividing by its standard deviation. e, Comparison of the blastomere time-courses to the EPIC dataset15. For 115 genes, we could compare gene expression to previously published embryonic expression profiles generated by microscopic lineaging until the ~300-cell stage15,39. Of these, 75% of our profiles had consistent localized expression (Supplementary Table 1). Of those, 54% matched completely, and 21% of the genes, expressed in all of the lineages in our dataset had some missing expression in the EPIC dataset because the lineaging was not carried out until the end of the developmental process. The remaining genes have some overlap in expression. Such differences in expression could be caused by the transgene in the EPIC dataset not recapitulating the profile of the endogenous gene, or missing signals between cells in the blastomere dataset, as is seen from the whole embryo/blastomeres expression level ratio (See Supplementary Table 1, ratios defined as equal, slightly higher/lower or much higher/lower). Expression profile compared to the EPIC dataset deviates more when expression in the blastomeres is low compared to the whole embryo, but the blastomere dataset has the advantage that all genes are assayed simultaneously, no transgenes are used, maternal transcripts are seen, and down-regulation of genes is observable.
Extended Data Figure 3. Lineage restricted gene expression identifies genes dependent upon coherence of the lineages and tissue specificity.
a, Expression profiles of genes involved in pharynx specification. The left and right panels correspond to the two Notch signaling events. The top and bottom images correspond to the expected regulatory patterns in the whole embryo and isolated blastomeres, respectively. tbx-37 is not shown since it is identical to tbx-38 in expression profile. b, Comparison of the overall sum of expression between the two time-courses, plotted on a log2 scale (black). Genes “missing” in the separated lineage time-course were manually added to the graph at −3. The additional plots indicate the same measure for dynamically expressed genes (blue) and constitutive genes (red). c, Idealized expression profiles used to identify gene expression clusters. d, The gene expression profiles for the temporally restricted gene expression profiles. Each profile was “standardized” by subtracting its mean and dividing by its standard deviation. e, Average expression profiles of ten clusters of dynamically expressed genes determined based upon the whole embryo expression data (see Methods). f, The number of dynamic genes in each temporal period In each group, the genes not expressed in the lineage time-course (b) are marked in red.
Extended Data Figure 4. The first principal component correlates with developmental time.
Principal components analysis as described in Figure 2a. Color codes are same as in Figure 1. PC1, PC2 and PC3 capture 18%, 12% and 11%, respectively, of the variation in the expression, respectively, in the 1,320 dynamically expressed genes with no expression in the first stage (to exclude genes with maternal expression).
Extended Data Figure 5. Germ layer specific expression.
Expression profiles of the germ layer specific genes in each of the lineages. The x- and y-axes are the eleven examined temporal stages and individual genes, respectively. Germ layer specific genes were identified by hierarchical clustering based upon correlation among dynamically expressed genes (see Methods).
Extended Data Figure 6. Robustness of gene age analysis.
a, Same format as Figure 4a but with the definition of old genes as those present in at least 25% of the examined Eukaryotes (see Methods) that are not Ophisthokonts. b, Same as Figure 4a with a definition of “old” as those present in 25% of the examined organisms that are not Eukaryotes (Eubacteria and Archaea).
Extended Data Figure 7. Truncated endoderm gene set control.
To exclude the possibility that general genes are included as “endoderm-specific” since the endoderm program is induced earlier, we excluded temporal clusters 8, 9, 10 from the endoderm genes and repeated the relevant analyses. We found that there is no dramatic change in the results. The results are shown in the same format as Figure 3 and 4b-c.
Extended Data Table 1. The fates of the progeny of each blastomere in vivo and in isolated cultured blastomeres.
| Fates in whole embryo10 | Expected in vitro | References | ||
|---|---|---|---|---|
| AB | Neurons | Unknown | ||
| Epidermis | Yes | 40 | ||
| Pharynx | No | 41 | ||
| 1 muscle cell | Unknown | |||
| MS | Muscle | Yes | 42 | |
| Pharynx | Yes | 42 | ||
| E | Endoderm | Yes | 43,44 | |
| C | Muscle | Yes | 40 | |
| Epidermis | Yes | 40 | ||
| P3 | D | Muscle | Yes | 40 |
| P4 | Germ line | Unknown |
Extended Data Table 2. Description of the developmental stages queried in this study.
| Stage number | Stage name | Description | Time* |
|---|---|---|---|
| 1 | 2-cell | 2-cell embryo | 0 |
| 2 | 4-cell | 4-cell embryo | 20 |
| 3 | E | After division of EMS to E and MS | 40 |
| 4 | 2E | After division of E to Ea and Ep | 60 |
| 5 | 2E+ | After division of MSa and MSp to MSaa, MSap, MSpa and MSpp | 90 |
| 6 | 4E | After division of Ea and Ep to Eal, Ear, Epl and Epr | 110 |
| 7 | 4E+ | 60 minutes after division of Ea and Ep to Eal, Ear, Epl and Epr | 140 |
| 8 | 8E | After division of Eal, Ear, Epl and Epr to Eala, Ealp, Eara, Earp, Epla, Eplp, Epra and Eprp | 180 |
| 9 | 8E+ | 90 minutes after division of Eal, Ear, Epl and Epr to Eala, Ealp, Eara, Earp, Epla, Eplp, Epra and Epr | na |
| 10 | 8E++ | 180 minutes after division of Eal, Ear, Epl and Epr to Eala, Ealp, Eara, Earp, Epla, Eplp, Epra and Epr | na |
| 11 | o.n. | After an over-night incubation - more than 8 E cells are visible. | na |
Timing of the stage in the Sulston lineage10. Timing is indicated as minutes from the 2-cell stage
Extended Data Table 3. Tissue specific gene sets.
| Tissue | Gene sets |
|---|---|
| Neuronal | Genes with the following GO terms: |
| GO:0001764 neuron migration | |
| GO:0004983 neuropeptide Y receptor activity | |
| GO:0005328 neurotransmitter:sodium symporter activity | |
| GO:0006836 neurotransmitter transport | |
| GO:0007218 neuropeptide signaling pathway | |
| GO:0007268 synaptic transmission | |
| GO:0007411 axon guidance | |
| GO:0008021 synaptic vesicle | |
| GO:0030424 axon | |
| GO:0030425 dendrite | |
| GO:0030594 neurotransmitter receptor activity | |
| GO:0043005 neuron projection | |
| GO:0045202 synapse | |
| GO:0045211 postsynaptic membrane | |
| GO:0048489 synaptic vesicle transport | |
| GO:0048666 neuron development | |
| Muscle | Genes identified by Fox et al.45 |
| Endoderm | Genes identified by McGhee et al.46 |
| Epidermis | Genes with the following GO term: |
| GO:0018996 molting cycle, collagen and cuticulin-based cuticle | |
| Pharynx | Genes with the following GO term: |
| GO:0007631 feeding behavior | |
| Germline | Genes with the following GO terms: |
| GO:0051729 germline cell cycle switching, mitotic to meiotic cell cycle | |
| GO:0048477 oogenesis | |
| GO:0045132 meiotic chromosome segregation | |
| GO:0043186 P granule | |
| GO:0007276 gamete generation | |
| GO:0007281 germ cell development | |
| GO:0007126 meiosis | |
| GO:0001556 oocyte maturation | |
| GO:0000003 reproduction |
Supplementary Material
Acknowledgements
We gratefully acknowledge the contribution of computational analyses by David H. Silver, Leon Anavy, and Florian Wagner in an early stage of this project. We also acknowledge helpful advice from Bernie Degnan, Alison Cole, Maja Adamska, Avital Polsky, and three anonymous referees. We thank the Technion Genome Center for technical assistance. This work was supported by an EU-ERC grant (EvoDevoPaths) and the EMBO Young Investigator Program.
Footnotes
The complete data set has been deposited to the NCBI GEO database GSE50548. The authors declare no competing financial interests.
REFERENCES
- 1.Hall BK. Evolutionary developmental biology. 2nd ed. Chapman & Hall; 1998. [Google Scholar]
- 2.Wolpert L. Principles of development. 4th ed. Oxford University Press; 2011. [Google Scholar]
- 3.Technau U, Scholz CB. Origin and evolution of endoderm and mesoderm. Int J Dev Biol. 2003;47:531–539. [PubMed] [Google Scholar]
- 4.Ryan JF, et al. The genome of the ctenophore Mnemiopsis leidyi and its implications for cell type evolution. Science. 2013;342:1242592. doi: 10.1126/science.1242592. [DOI] [PMC free article] [PubMed] [Google Scholar]
- 5.Martindale MQ, Pang K, Finnerty JR. Investigating the origins of triploblasty: ‘mesodermal’ gene expression in a diploblastic animal, the sea anemone Nematostella vectensis (phylum, Cnidaria; class, Anthozoa) Development. 2004;131:2463–2474. doi: 10.1242/dev.01119. [DOI] [PubMed] [Google Scholar]
- 6.Buss LW. The evolution of individuality. Princeton University Press; 1987. [Google Scholar]
- 7.Gould SJ. Ontogeny and phylogeny. Belknap Press of Harvard University Press; 1977. [Google Scholar]
- 8.Nielsen C. Animal evolution: interrelationships of the living phyla. 3rd ed. Oxford University Press; 2012. [Google Scholar]
- 9.Valentine JW. On the origin of phyla. University of Chicago Press; 2004. [Google Scholar]
- 10.Sulston JE, Schierenberg E, White JG, Thomson JN. The embryonic cell lineage of the nematode Caenorhabditis elegans. Dev Biol. 1983;100:64–119. doi: 10.1016/0012-1606(83)90201-4. [DOI] [PubMed] [Google Scholar]
- 11.Edgar LG, Goldstein B. Culture and manipulation of embryonic cells. Methods Cell Biol. 2012;107:151–175. doi: 10.1016/B978-0-12-394620-1.00005-9. [DOI] [PMC free article] [PubMed] [Google Scholar]
- 12.Hashimshony T, Wagner F, Sher N, Yanai I. CEL-Seq: single-cell RNA-Seq by multiplexed linear amplification. Cell Rep. 2012;2:666–673. doi: 10.1016/j.celrep.2012.08.003. [DOI] [PubMed] [Google Scholar]
- 13.Shalek AK, et al. Single-cell transcriptomics reveals bimodality in expression and splicing in immune cells. Nature. 2013;498:236–240. doi: 10.1038/nature12172. [DOI] [PMC free article] [PubMed] [Google Scholar]
- 14.Shapiro E, Biezuner T, Linnarsson S. Single-cell sequencing-based technologies will revolutionize whole-organism science. Nat Rev Genet. 2013;14:618–630. doi: 10.1038/nrg3542. [DOI] [PubMed] [Google Scholar]
- 15.Murray JI, et al. Multidimensional regulation of gene expression in the C. elegans embryo. Genome Res. 2012;22:1282–1294. doi: 10.1101/gr.131920.111. [DOI] [PMC free article] [PubMed] [Google Scholar]
- 16.Fukushige T, Brodigan TM, Schriefer LA, Waterston RH, Krause M. Defining the transcriptional redundancy of early bodywall muscle development in C. elegans: evidence for a unified theory of animal muscle development. Genes Dev. 2006;20:3395–3406. doi: 10.1101/gad.1481706. [DOI] [PMC free article] [PubMed] [Google Scholar]
- 17.Neves A, Priess JR. The REF-1 family of bHLH transcription factors pattern C. elegans embryos through Notch-dependent and Notch-independent pathways. Dev Cell. 2005;8:867–879. doi: 10.1016/j.devcel.2005.03.012. [DOI] [PubMed] [Google Scholar]
- 18.Yanai I, Peshkin L, Jorgensen P, Kirschner MW. Mapping gene expression in two Xenopus species: evolutionary constraints and developmental flexibility. Dev Cell. 2011;20:483–496. doi: 10.1016/j.devcel.2011.03.015. [DOI] [PMC free article] [PubMed] [Google Scholar]
- 19.Helm RR, Siebert S, Tulin S, Smith J, Dunn CW. Characterization of differential transcript abundance through time during Nematostella vectensis development. BMC Genomics. 2013;14:266. doi: 10.1186/1471-2164-14-266. [DOI] [PMC free article] [PubMed] [Google Scholar]
- 20.Anavy L, et al. BLIND ordering of large-scale transcriptomic developmental timecourses. Development. 2014;141:1161–1166. doi: 10.1242/dev.105288. [DOI] [PubMed] [Google Scholar]
- 21.Domazet-Loso T, Tautz D. A phylogenetically based transcriptome age index mirrors ontogenetic divergence patterns. Nature. 2010;468:815–818. doi: 10.1038/nature09632. [DOI] [PubMed] [Google Scholar]
- 22.Levin M, Hashimshony T, Wagner F, Yanai I. Developmental milestones punctuate gene expression in the Caenorhabditis embryo. Dev Cell. 2012;22:1101–1108. doi: 10.1016/j.devcel.2012.04.004. [DOI] [PubMed] [Google Scholar]
- 23.Kalinka AT, et al. Gene expression divergence recapitulates the developmental hourglass model. Nature. 2010;468:811–814. doi: 10.1038/nature09634. [DOI] [PubMed] [Google Scholar]
- 24.King N, et al. The genome of the choanoflagellate Monosiga brevicollis and the origin of metazoans. Nature. 2008;451:783–788. doi: 10.1038/nature06617. [DOI] [PMC free article] [PubMed] [Google Scholar]
- 25.Leys SP, Riesgo A. Epithelia, an evolutionary novelty of metazoans. J Exp Zool B Mol Dev Evol. 2012;318:438–447. doi: 10.1002/jez.b.21442. [DOI] [PubMed] [Google Scholar]
- 26.Nakanishi N, Sogabe S, Degnan BM. Evolutionary origin of gastrulation: insights from sponge development. BMC Biol. 2014;12:26. doi: 10.1186/1741-7007-12-26. [DOI] [PMC free article] [PubMed] [Google Scholar]
- 27.Haeckel E. Die Gastraea-Theorie, die phylogenetische Classification des Thierreichs und die Homologie der Keimblätter. Jenaische Zeitschr. Naturwiss. 1874;8:1–55. [Google Scholar]
- 28.Leininger S, et al. Developmental gene expression provides clues to relationships between sponge and eumetazoan body plans. Nat Commun. 2014;5:3905. doi: 10.1038/ncomms4905. [DOI] [PubMed] [Google Scholar]
- 29.Schierwater B, et al. Concatenated analysis sheds light on early metazoan evolution and fuels a modern “urmetazoon” hypothesis. PLoS Biol. 2009;7:e20. doi: 10.1371/journal.pbio.1000020. [DOI] [PMC free article] [PubMed] [Google Scholar]
- 30.Bürtschli O. Bemerkungen zur Gastraea-Theorie. Morph Jahrb 18. 1884;9:415–427. [Google Scholar]
- 31.Goldstein B. Induction of gut in Caenorhabditis elegans embryos. Nature. 1992;357:255–257. doi: 10.1038/357255a0. [DOI] [PubMed] [Google Scholar]
- 32.Baker CS, et al. The External RNA Controls Consortium: a progress report. Nat Methods. 2005;2:731–734. doi: 10.1038/nmeth1005-731. [DOI] [PubMed] [Google Scholar]
- 33.Li H, Durbin R. Fast and accurate short read alignment with Burrows-Wheeler transform. Bioinformatics. 2009;25:1754–1760. doi: 10.1093/bioinformatics/btp324. [DOI] [PMC free article] [PubMed] [Google Scholar]
- 34.Pryszcz LP, Huerta-Cepas J, Gabaldon T. MetaPhOrs: orthology and paralogy predictions from multiple phylogenetic evidence using a consistency-based confidence score. Nucleic Acids Res. 2011;39:e32. doi: 10.1093/nar/gkq953. [DOI] [PMC free article] [PubMed] [Google Scholar]
- 35.Fischer S, et al. Using OrthoMCL to assign proteins to OrthoMCL-DB groups or to cluster proteomes into new ortholog groups. Curr Protoc Bioinformatics. 2011;Chapter 6(Unit 6.12):11–19. doi: 10.1002/0471250953.bi0612s35. [DOI] [PMC free article] [PubMed] [Google Scholar]
- 36.Guberman JM. BioMart Central Portal: an open database network for the biological community. Database (Oxford) 2011;2011:bar041. doi: 10.1093/database/bar041. [DOI] [PMC free article] [PubMed] [Google Scholar]
- 37.Tatusov RL, Koonin EV, Lipman DJ. A genomic perspective on protein families. Science. 1997;278:631–637. doi: 10.1126/science.278.5338.631. [DOI] [PubMed] [Google Scholar]
- 38.Schwarz EM, et al. WormBase: better software, richer content. Nucleic Acids Res. 2006;34:D475–478. doi: 10.1093/nar/gkj061. [DOI] [PMC free article] [PubMed] [Google Scholar]
- 39.Murray JI, et al. Automated analysis of embryonic gene expression with cellular resolution in C. elegans. Nat Methods. 2008;5:703–709. doi: 10.1038/nmeth.1228. [DOI] [PMC free article] [PubMed] [Google Scholar]
- 40.Cowan AE, McIntosh JR. Mapping the distribution of differentiation potential for intestine, muscle, and hypodermis during early development in Caenorhabditis elegans. Cell. 1985;41:923–932. doi: 10.1016/s0092-8674(85)80073-8. [DOI] [PubMed] [Google Scholar]
- 41.Good K, et al. The T-box transcription factors TBX-37 and TBX-38 link GLP-1/Notch signaling to mesoderm induction in C. elegans embryos. Development. 2004;131:1967–1978. doi: 10.1242/dev.01088. doi:10.1242/dev.01088. [DOI] [PubMed] [Google Scholar]
- 42.Goldstein B. An analysis of the response to gut induction in the C. elegans embryo. Development. 1995;121:1227–1236. doi: 10.1242/dev.121.4.1227. [DOI] [PubMed] [Google Scholar]
- 43.Laufer JS, Bazzicalupo P, Wood WB. Segregation of developmental potential in early embryos of Caenorhabditis elegans. Cell. 1980;19:569–577. doi: 10.1016/s0092-8674(80)80033-x. [DOI] [PubMed] [Google Scholar]
- 44.Goldstein B. Establishment of gut fate in the E lineage of C. elegans: the roles of lineage-dependent mechanisms and cell interactions. Development. 1993;118:1267–1277. doi: 10.1242/dev.118.4.1267. [DOI] [PubMed] [Google Scholar]
- 45.Fox RM, et al. The embryonic muscle transcriptome of Caenorhabditis elegans. Genome biology. 2007;8:R188. doi: 10.1186/gb-2007-8-9-r188. doi:10.1186/gb-2007-8-9-r188. [DOI] [PMC free article] [PubMed] [Google Scholar]
- 46.McGhee JD, et al. ELT-2 is the predominant transcription factor controlling differentiation and function of the C. elegans intestine, from embryo to adult. Developmental biology. 2009;327:551–565. doi: 10.1016/j.ydbio.2008.11.034. doi:10.1016/j.ydbio.2008.11.034. [DOI] [PMC free article] [PubMed] [Google Scholar]
Associated Data
This section collects any data citations, data availability statements, or supplementary materials included in this article.


