

Abstract
Navigation relies on the neural processing of sensory cues about observer self-movement and spatial location. Neurons in macaque dorsal medial superior temporal cortex (MSTd) respond to visual and vestibular self-movement cues, potentially contributing to navigation and orientation. We moved monkeys on circular paths around a room while recording the activity of MSTd neurons. MSTd neurons show a variety of sensitivities to the monkey's heading direction, circular path through the room, and place in the room. Changing visual cues alters the relative prevalence of those response properties. Disrupting the continuity of self-movement paths through the environment disrupts path selectivity in a manner linked to the time course of single neuron responses. We hypothesize that sensory cues interact with the spatial and temporal integrative properties of MSTd neurons to derive path selectivity for navigational path integration supporting spatial orientation.
Keywords: optic flow, visual motion, extrastriate, cortex
macaque dorsal medial superior temporal cortex (MSTd) contains neurons that respond to the radial patterns of visual motion in optic flow (Duffy and Wurtz 1991a; Lappe et al. 1996; Saito et al. 1986). These responses show selectivity for stimuli representing specific heading directions (Duffy and Wurtz 1995; Bremmer et al. 2010) with population responses reflecting the real-world heading of self-movement (Hamed et al. 2003; Page and Duffy 2003).
MSTd neurons also respond to object motion cues that simulate the appearance of earth-fixed landmarks seen in passing by a moving observer (Kishore et al. 2011; Logan et al. 2006) and to vestibular signals about self-movement (Duffy 1998; Gu et al. 2007). Together, these response properties make MSTd neurons well suited to their playing role in self-movement perception for navigation and spatial orientation (Heuer and Britten 2004).
Neuronal self-movement sensitivity may be of greater practical utility if it reflects net movement through the environment, potentially as a perceptual mechanism supporting cognitive mapping. Such path sensitivity could integrate across successive changes in a moving observer's heading direction along a path of self-movement. However, sustained presentations of optic flow, depicting a fixed heading direction, yield stable MSTd neuronal responses for at least 12 s (Duffy and Wurtz 1997). More to the point, successive heading changes have little effect on the optic flow responses of MSTd neurons. That is, successive optic flow stimuli, presented as random sequences of heading directions, elicit responses that are more or less the same regardless of the sequence in which they are imbedded (Paolini et al. 2000).
In contrast, more sustained sequences of heading changes substantially alter the optic flow responses of MSTd neurons. That is, successive optic flow stimuli, presented as a regular sequence of heading directions depicting a curved path through the environment, greatly affect responses to particular heading stimuli imbedded in those sequences. In individual neurons, those effects depended on the particular curved path presented. (Froehler and Duffy 2002).
These apparently conflicting observations might be reconciled by hypothesizing longer-lasting effects of stimuli presented in the context of a regular pattern of MSTd neuronal activation. Here we present the findings of studies in which we varied real self-movement and optic flow stimulus characteristics to assess their impact on heading, path, and place effects. In sum, we find evidence of the temporal integration of MSTd neuronal responses that may extend their utility in navigational path integration.
METHODS
Animal preparation.
Monkeys were prepared for single neuron recording with surgery preceded by sedation with ketamine (15 mg/kg im) and robinul (0.011 mg/kg im) and underwent the shearing of hair on the head and limbs. This was followed by venous catheterization, endotracheal intubation, oro-gastric intubation, and general anesthesia using inhaled isoflurane. During surgery we monitored heart rate, core temperature, expired CO2, and the surgical plane of anesthesia.
The monkeys were placed in a cranial stereotaxic apparatus, and the surgical field was repeatedly washed with a betadine scrub and then enclosed in sterile draping. We excised a ∼3 cm × ∼6 cm section of calvarial scalp, debrided the exposed skull, and inserted 35–50 dental pins into bone at the wound edge as implant anchors. Scleral search coils were placed by bilateral perilimbotomy, and the leads were passed transorbitally, and then subcutaneously, to connectors that were imbedded in the head implant (Judge et al. 1980). A head positioning socket was implanted in the frontal midline with bilateral recording cylinders over 2-cm trephine holes above MSTd (AP: −2 mm, ML: ±15 mm, angle: 0). Thereafter, all appliances were encased in several layers of dental acrylic to form the implant cap.
After surgery and recovery from anesthesia, the animal was returned to its home cage where it was monitored to guide the administration of banamine (1 mg/kg im) analgesia under veterinary supervision. The excised scalp edge and recording chambers were gently debrided and wiped with betadine daily. All protocols were approved by the University of Rochester Committee on Animal Research and complied with U.S. Public Health Service and Society for Neuroscience policy on the care of laboratory animals.
When fully recovered from surgery, the animals were trained to maintain visual fixation that was monitored using the magnetic search coils. The monkeys maintained centered fixation (±3°) in all stimulus presentation epochs. When a trial was interrupted by a saccade out of the centered fixation window, that trial was aborted, a “boop” tone was delivered, a brief time-out was imposed, and data from that trial were not saved. Successful trials led to an audible tone and liquid reward. Fixation duration was increased over months of training.
Experimental design.
In the first series of experiments, visual stimulation was provided using two, alternative approaches. In the real translational movement studies of neuronal response profiles and path-length effects (Figs. 1 and 2), the monkeys maintained visual fixation on a laser point projected on the facing wall. That point remained directly in front of the monkey by moving across a 2-in. wide flat-black board extending horizontally across the front wall of the room at the monkeys' eye height. In those studies, the monkeys' field of view extended across the central 90 × 90° of its visual field, the remainder of the visual field being occluded by chair-mounted flat-black panels. As the monkey was moved throughout the room that view included the front and side walls that was covered with ∼500 small lights (Christmas tree lights, DC powered to limit radiative interference with neuron recordings).
Fig. 1.

Circular paths of translational self-movement are presented on a room-sized sled that is enclosed by an array of small lights to combine vestibular and visual cues. A: clockwise (CW, left) and counterclockwise (CC, right) paths present 360° of heading directions in the ground plane, differing only in the heading sequence. B–D: 3 patterns of macaque dorsal medial superior temporal cortex (MSTd) single neuron responses were obtained during the presentation of circular path movement. B: heading selectivity is seen as responses to the same heading direction, in this case rightward movement, regardless of the path on which it occurs. C: path selectivity consists of heading selective responses that are much larger on one path, in this case CW, than on the other path. D: place selectivity consists of self-movement responses with a near 180° shift in heading selectivity between paths, resulting in a preference for movement through a particular place in the room. Each circular spike density plot represents averaged neuronal firing rate at the corresponding location on the circular path as the width of the green area extending from the enclosed open circle. The radially oriented line on each plot indicates the net vector direction and mean resultant length for that circular distribution.
Fig. 2.

Circular path length affects the CC/CW path selectivity of MSTd neurons. A: 4 path lengths and 2 circular directions (CC, blue and CW, red) were interleaved, all terminating near the neuron's preferred direction as recorded during movement on its preferred path. This resulted in different premovement positions at which the monkey was stationary for several seconds (colored boxes). B: single neuron responses showing increasing activation with longer paths leading to the preferred heading direction on the preferred path (CW). Filled segments of the spike density functions indicate the movement period. The blue and red frames highlight the heading direction intervals that are comparable across path lengths within the CW paths and across path lengths in the CC paths. This neuron also shows differences in activity while the monkey was stationary at different room locations (similarly higher firing rates in the green and purple boxes while on the left side of the room, similarly lower firing rates in the orange and yellow boxes while on the right side of the room). C: percent peak firing rate difference between the CC and CW responses on the preferred path showing increasing differences with increasing path length. D: percent peak firing rate difference between the shortest (90°) path and the other three path lengths for the preferred and nonpreferred (CC vs. CW) paths.
In the visual-visual and visual-vestibular cue interaction studies (Fig. 3), the monkey's chair was turned 180° on the movement platform to face a rear-projection screen. As the monkeys moved in the room, that screen afforded a view of the central 90°× 90° of the visual field that was covered by the optic flow, object motion, and visual pattern stimuli.
Fig. 3.

The prevalence of heading, path, and place response patterns is sensitive to visual cues. Circular paths of translational self-movement were combined with matching headings of visually simulated self-movement. A: dot pattern optic flow with sled movement yielded a preponderance of path responses (right). B: adding object motion cues to optic flow resulted in a subtle increase in the number of place responses, with (right) or without (left) sled movement. C: adding regular pattern cues to optic flow with sled movement resulted in a substantial increase in place responses. Black frames represent visual cues presented in each condition. Bar graphs show the percentage of neurons (n = 51) that showed the indicated response pattern.
In the second series of experiments (Figs. 4–7), the monkey was placed in a floor-mounted recording booth. The frontal wall of the booth included a rear-projection screen on which we presented simulated optic flow stimuli covering the central 90 × 90° of the monkeys' visual field.
Fig. 4.

Simulated optic flow presented as a series of 16 discrete 500-ms interval stimuli covering heading directions around 360° in the ground plane. A: representation of the correspondence between optic flow stimuli (frames) and heading direction relative to the monkey. B–D: examples of the 3 types of optic flow stimulus sequences presented. B: in a random sequence. C: in a CW (shown) or CC alternating sequence with every other stimulus shifted 180° as illustrated by green arrows in A. D: in a CW (shown) or CC circular path sequence across the 16 intervals as illustrated by the red arrows in A. E–G: neuronal responses illustrating profiles evoked by the five optic flow stimulus conditions showing response amplitude (black for low firing rates, yellow for high firing rates) for each of the 16 optic flow stimuli in a random sequence (left), CC or CW alternating sequence (middle), and CC or CW circular sequence (right). E: heading neuron with similar responses under all 5 stimulus conditions. F: path neuron showing strong responses only to the CC circular path condition. G: place neuron showing strong responses to opposite headings on the circular path conditions.
Fig. 7.

Relationship between response time-course and response profiles in MSTd neurons. Comparison of response time course to random stimulus sets (abscissa) and alternating (A, ordinate) or circular (B, ordinate) sequences seen in exemplary heading (left), path (middle), and place (right) neurons. Alternating and circular sequence stimuli evoke more rapidly increasing responses in path and place neurons.
Translational movement stimuli.
We used a two-axis, dual-rail, computer-controlled, motorized sled to present real movement stimuli. The monkey chair, eye coil, and video display systems were mounted on a 1 × 1 m platform (Fig. 1A). Platform movements were controlled with position, speed, and acceleration feedback from the drive motors, which was sampled at 125 Hz and stored as an analog record. Stimulus presentation and experimental conditions were controlled by the PC-based real-time experimental system (Hays et al. 1982).
Each movement trial began with the sled centered at one of eight starting positions. The platform first accelerated at 45°/s2 of 1 s and then moved on a circular path around the room at 45°/s, and finally, the platform decelerated at 45°/s2 for 1 s. During these movements, the platform moved through 360° on a 1-m radius circular path at a steady speed of 45 cm/s for 8 s. Platform movement brought the monkey to within 1.5 m of the facing wall (1.15° convergence) and 3.5 m at its furthest point from the facing wall (0.49° convergence).
During studies in which platform movement was accompanied by visual motion stimuli, the visual stimuli were presented on a 90 × 90° rear-projection screen and simulated the optic flow that might naturally accompany that platform movement (as detailed below). The duration of real movement trials, in the context of constraints on recording time, precluded the inclusions of control trials in which real movement stimuli were presented without accompanying visual stimulation.
Visual motion stimuli.
Optic flow stimuli were created on a personal computer driving a television projector at 60 Hz to illuminate a rear projection screen covering the central 90 × 90° of the monkeys' visual field during centered fixation at a viewing distance of 42 cm (0.49° convergence). Optic flow stimuli consisted of ∼2,500 single pixel white dots (0.19° at 2.61 cd/m2) on a dark background (0.18 cd/m2) and moving to simulate observer self-movement. The stimuli simulated a three-dimensional cloud of illuminated points filling a window and average of 1.5 m from the front of a 9-m depth field. In the first frame, dots were distributed in a random pattern that had been rearranged to smooth dot density across the screen. Dots were removed either by passing out of the 90 × 90° field of view or by the expiration of a randomly distributed dot duration ranging from 1 to 3 s. Dot speed was a sin2 function of dot eccentricity measured as the angle between the monkey's line of sight and each dot's location on the screen and at that dot's randomly assigned simulated depth. We used an average dot speed of ∼20°/s across all stimuli to match the speed preferences of MSTd neurons (Duffy and Wurtz 1997; Orban et al. 1995).
In a second series of studies, we combined real-movement and optic flow with visual object or pattern stimuli to assess their cumulative effects (Fig. 3). The object cues consisted of a side-by-side pair of three concentric triangles and three concentric circles, each with transparent areas between the concentric figures. The triangles and circles were composed of lines formed by 35 to 120 stimulus dots, depending on object size. Their distance from the observer was simulated by changes in their size varying in diameter from 11 to 22° and their center separation varying over twice that range. The objects moved along the horizontal meridian, matching the speed of dots in the superimposed optic flow to simulate earth-fixed objects. Both objects were on the screen throughout the circular path stimuli and were consistently visible by the monkeys as judged by accurate saccades to the objects in error trials. A close approximation to the stimuli can be viewed at: www.urmc.rochester.edu/labs/Cognitive-Neuroscience-Lab/projects (see particularly “Ecoding Path and Place”).
Pattern stimuli consisted of nonintersecting angled lines formed into a regular grid. Like the objects, the pattern lines were composed of stimulus dots that varied in density and spacing to simulate distance from the moving observer. The pattern moved along with the optic flow dots to simulate an earth-fixed structure that covered the entire stimulus area (Fig. 3).
Finally, in a third series of studies, we used optic flow stimuli simulating self-movement to examine the impact of three different heading sequences (Figs. 4–7): 1) randomly changing headings, like those used by Paolini et. al. (2000); 2) circular path heading sequences, like those used by Froehler and Duffy (2002); and 3) alternating circular path headings and their opposite heading directions, directed particularly at probing the opposite direction selectivities seen in place neurons.
Single neuron recording.
Epoxy-coated tungsten microelectrodes were passed through trans-dural guide tubes mounted in a recording chamber grid (Crist et al. 1988). Neuronal activity was monitored as the electrode advanced to identify gray and white matter layers and the relative depth of physiological landmarks. On isolating the action potentials of a single neuron, its receptive field was mapped using hand-held projectors to create stationary and moving images on the tangent screen while the monkey fixated a screen-centered target. We used the rule that gray matter layers at stereotaxic locations consistent with MSTd, which include neurons with large (>20°), direction-selective, pattern motion-preferring receptive fields, are considered to be part of MSTd (Duffy and Wurtz 1991a, 1995; Komatsu and Wurtz 1988a). A template matching algorithm (Alpha Omega, Atlanta, GA) was used to digitize neuronal discharge times. These were stored with stimulus and behavioral event markers from the REX system (Hays et al. 1982) for offline analysis in MATLAB (Mathworks, Natick, MA).
Recording sites.
When the experiments were completed, we made electrolytic marks (25 μA × 25 s) at selected depths along electrode tracks in one of the two monkeys. After pentobarbital euthanasia, the animal was perfused with heparinized saline followed by formalin and the brain was removed. After formalin fixation, cortical blocks were cut in 50-μm sections with every fourth section Nissl stained for cell body layers and every fifth section Luxol Fast Blue stained for myelinated fibers. Examination of stained sections confirmed that the neuronal recordings were in the anterior bank of the superior temporal sulcus within MSTd (Komatsu and Wurtz 1988b).
Data analysis.
Neuronal spike times were convolved with Gaussian function having a sigma from 20 to 50 ms to produce spike density response functions averaging the 6–12 stimulus presentations. Average spike densities were plotted on a timeline relative to stimulus onset to compare firing rate profiles across conditions or on a circle representing the position of the moving platform at the time of recording. Average firing rates were normalized across conditions for each neuron. The highest mean firing rate for any stimulus, in any condition, was treated as the peak rate for response normalization in that neuron. The data were statistically analyzed using the measures described in the text (SPSS 2011).
Throughout these studies, we classified neuronal responses to clockwise (CW) and counterclockwise (CC) circular paths of real or simulated self-movement as being of three varieties, operationalized using two-way ANOVAs with main effects of heading direction (16 levels) and circular path (2 levels) as well as their interactions. Neurons with significant direction effects, without significant condition or interaction effects, were classified as heading selective. Neurons with significant direction and condition, or direction × condition interactions, were classified as path or place selective. If those effects reflected different response amplitudes on the CW or CC paths, they were considered path selective. If those effects reflected similar responsiveness but different heading preferences on the CW or CC paths (>135° differences in the net vectors of the circular distributions), they were considered place selective.
RESULTS
We recorded the activity of 96 neurons from three hemispheres of three adult Rhesus monkeys: 44 neurons using combined optic flow and real translational self-movement stimuli, and 52 neurons using optic flow alone in a variety of stimulus sequences. In each hemisphere, all neurons were recorded at sites that showed large receptive fields, at least a quadrant of the visual field, including the fovea. In all recording periods from which firing rate data were analyzed, the monkeys maintained visual fixation at the center of the screen.
Self-movement response profiles.
Circular paths of translational self-movement present a complete series of heading directions in the ground plane (Fig. 1A). CW and CC circular paths differ only in the sequential order of headings. We tested single neuron heading selectivity during the combined presentation of real circular path translational self-movement and matching headings in optic flow stimuli.
We encountered three patterns of MSTd neuronal responses to circular path stimuli (Fig. 1B): heading-selective neurons show similar heading direction preferences during movement on CW and CC paths, with matching headings occurring on opposite sides of the CW and CC path. Path-selective neurons also preferred the same headings on the CW and CC paths but with stronger responses on one path than on the other. Place-selective neurons preferred opposite heading directions on the CW and CC paths, such that their best responses were at the same place in the room regardless of the path. These criteria were operationalized using statistical criteria (see methods). This analysis is not meant to imply that these are discrete classes of neurons but rather classifications along a broad continuum of response profiles.
Path length effects.
The path selectivity of many MSTd neurons prompted us to question how long a path would have to be to evoke CW/CC response differences. We hypothesized that there may be a cumulative effect of path length leading up to the preferred heading stimulus. We tested this hypothesis in studies of 16 path neurons, presenting arc segments covering 90, 180, 270, or 360° of a neuron's CW and CC paths, in all cases terminating at the location of its preferred path's, preferred heading direction (Fig. 2A).
Single neurons showed increased responses to the preferred heading with increased path length on the preferred path (Fig. 2B, left). Responses to the antipreferred path generally did not change. However, one neuron showed emerging activation near the antipreferred heading in the 360° length stimulus on the opposite path, suggesting nascent place selectivity (Fig. 2B, right). That neuron also showed stationary location effects, with premovement differences in baseline activity while the monkey awaited the next movement stimulus at different room locations with the same vergence states. Such start position effects are seen in 25% (4/16) of the neurons with which we completed the path length study (Kruskal-Wallis, P < 0.05). Such effects have been seen previously in MSTd neurons with sled relocation to various stationary positions around the room (Froehler and Duffy 2002).
In the path length study, path length effects were seen as the incremental increase in differences between the preferred heading and path and the nonpreferred heading and path (Fig. 2C). One-way ANOVA shows significant response amplitude differences in the final second of the four path lengths paths [F(3,40) = 4.61, P = 0.007]. In a related analysis, we compared increasing path differences across path lengths and found increasing responses on the preferred path but no net change on the nonpreferred path (Fig. 2D). A two-way ANOVA of response amplitude differences across three path length comparisons and the CC/CW paths yields significant path length effects [F(2,90) = 3.64, P = 0.03] with the expect CC/CW path differences (P < 0.001).
Self-movement cue interactions.
We manipulated the strength of self-movement and place cues in the optic flow stimuli to determine whether heading, path, and place response profiles might vary with visual stimulus cue conditions. Four test cue conditions were used: 1) optic flow with real movement (as above), 2) adding a place cue as simulated earth-fixed objects with or 3) without real movement, and 4) augmenting movement and place cues by adding a full-screen, textured, earth-fixed pattern (Fig. 3, icons). We applied statistical criteria to classify neuronal response profiles based on a two-way ANOVA (P < 0.05) with main effects of heading direction (16 levels), circular path (two levels), and their interactions. Presenting optic flow with sled movement yields significant effects in 98% (51/52) of the neurons: 16% (8/51) heading selective, 65% (33/51) path selective, and 20% (10/51) place selective (Fig. 3A). Thirty-two neurons were tested with all four cue conditions. The optic flow, object motion, and sled movement studies yielded similar distributions of heading, path, and place profiles responses (Fig. 3B). However, augmenting both the location and motion cues with the addition of an earth-fixed pattern enhances the number of place profiles at the expense of both heading and path profiles (Fig. 3C).
Although the net distribution of responses was affected only by the full-screen pattern, all four conditions resulted in response profile changes in some of neurons. The 32 neurons tested with all four conditions each provided six pairwise comparisons to yield a total of 192 comparisons: 48% (92/192) of these show the same response profiles (chance 33%) but only two neurons show the same response profile across all four conditions. Thus about half of the neurons show changes, with 94% (30/32) changing in at least one condition.
Together, these findings suggest that self-movement response profiles are sensitive to stimulus attributes: The path length study shows that path selectivity depends on prolonged self-movement stimulation. The visual cues study shows that response profiles can be altered by stimulus conditions. We explored both of these effects in more detailed studies of optic flow heading sequence effects.
Optic flow sequence effects.
We used optic flow stimuli to assess the impact of heading sequences and visual stimulus composition on the response profiles of MSTd neurons. We compared responses to circular path sequences with those evoked by heading stimulus sequences that did not simulate circular paths. All of the heading sequences were composed of the same 500-ms presentations of 16 heading directions distributed at 22.5° intervals around 360° (Fig. 4A).
Three types of heading sequences were presented: 1) random sequences presented the 16 headings in a nonrepeating random series (Fig. 4B); 2) alternating sequences presenting heading stimuli from CW or CC series around 360°, with each heading followed by the 180° opposite heading (Fig. 4C); these alternating headings maintained the overall CC and CW patterns, but disrupted heading continuity, and probed mechanisms underlying the opposite heading responsiveness of place neurons; and 3) circular path sequences presented heading stimuli forming continuous CW or CC series around 360° (Fig. 4D).
We classified neuronal response profiles as in the cue interactions study: heading neurons show the same heading direction preferences in all five sequences, regardless of which stimuli precedes the preferred heading (Fig. 4E). Path neurons showed their largest responses to only one of the two circular path sequences, with smaller responses to random and alternating sequences (Fig. 4F). Place neurons show opposite heading direction preferences in the two circular path sequences, typically with smaller responses to random and alternating sequences (Fig. 4G).
We summarized the effects of heading sequences by comparing responses evoked in alternating and circular sequences to those seen with a random series of stimuli (Fig. 5). We selected the preferred heading in the responses to the random series of stimuli of heading, path, and place neurons. The alternating heading sequences did not evoke systematically different response amplitudes to those evoked by the random series (Fig. 5A). In contrast, all neurons showed some increase in responses on the preferred path, most evident in path and place neurons (Fig. 5B). This effect was of comparable magnitude in path and place neurons, the latter being distinguished only by responses to the opposite heading in the nonpreferred circular path.
Fig. 5.
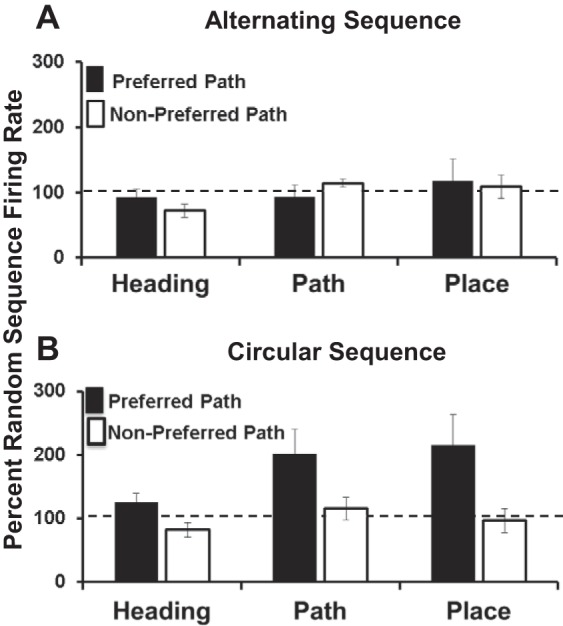
Comparison on path effects across optic flow stimulus conditions for neurons having heading, path, and place response profiles. A: preferred heading direction response amplitudes (ordinate) for heading, path, and place neurons (abscissa) in the alternating sequence conditions. Responses are shown as a percentage of the response to that heading direction in the random sequence condition. Neither the preferred nor the nonpreferred alternating sequence (based on CW vs. CC preferences in the circular sequence condition) shows substantial changes in response amplitudes from the random sequence condition. B: preferred heading direction response amplitudes for heading, path, and place neurons in the circular sequence stimulus conditions (format as in A). The preferred circular sequence shows substantial increases in response amplitudes over that recorded in the random sequence condition.
A three-way ANOVA with main effects of sequence (alternating, circular), path (preferred, nonpreferred), and neuronal response profile (heading, path, place) revealed main effects of sequence [F(1,72) = 8.22, P = 0.006], path [F(1,72) = 9.27, P = 0.003], and neuronal response profile [F(2 72) = 3.69, P = 0.031, Tukey's honestly significant difference: heading < place, P < 0.05], with significant sequence-by-path interactions [F(1,72)= 8.20, P = 0.006]. A follow-up two-way ANOVA confirmed significant path effects in the circular sequence condition [F(1,35) = 12.49, P = 0.001] attributable to larger preferred path responses. Thus we conclude that the circular sequence of heading stimuli plays an important role the path preferences of these neurons.
Response time-course effects.
A potential factor contributing to heading sequence effects is seen in the time course of neuronal responses to heading stimuli. We divided the 500-ms period of each heading stimulus presentation, plus a 50-ms minimal latency offset, into four overlapping periods (50–250, 150–350, 250–450, and 350–550 ms). Three neurons illustrate the effects seen in the sample: a heading neuron showed the gradual buildup of firing rate to the preferred stimulus in random series and alternating sequence stimulus presentations, with rapid buildup in both circular sequences (Fig. 6A). However, the path and place neurons showed the rapid buildup of responses in their preferred conditions and directions (Fig. 6, B and C), with the path neuron showing its largest net responses to circular sequence stimuli and the place neuron showing its largest net responses to alternating sequence stimuli.
Fig. 6.

Temporal dynamics of responses in three optic flow stimulus conditions can distinguish heading, path, and place neurons. Each of the 500-ms stimulus periods was divided into four 100-ms offset response intervals (see key to colored lines). A: heading neuron shows the gradual increase of its response amplitudes across the 500 ms of stimulus presentation in the random stimulus condition. B: path neuron shows lower peak firing rates in the random stimulus condition contrasted with the rapid rise of larger response amplitudes in the preferred circular conditions, with greatly diminished responsiveness in the nonpreferred circular condition. C: place neuron shows lower peak firing rates in the random stimulus condition contrasted with the rapid rise of its dual peak response amplitudes in the preferred circular conditions, with a single peak in the nonpreferred circular condition.
To better characterize response time-course relations to response profiles we focused on the most characteristic heading, path, and place neurons. We assessed response time course by measuring the slope of change in firing rates across the stimulus interval of the preferred headings, comparing responses in the random and alternating stimulus sequences (Fig. 7A) and in the random and circular stimulus sequences (Fig. 7B). Response time-course slopes of with random and alternating stimulus sequences did not differ significantly (paired t-tests: T35 = 0.548, P = 0.59), whereas comparison of random and circular stimulus sequences revealed significant differences (T35 = 2.23, P = 0.032). We conclude that differences in the neuronal time course of response integration serve as a mechanism supporting stimulus sequence-dependent responses in MSTd.
DISCUSSION
Circular path response profiles.
We confirm our previous description of three types of MSTd neuronal response profiles evoked by circular path stimuli (Froehler and Duffy 2002): heading-selective neurons showing comparable responses to their preferred heading direction on CC and CW paths; path-selective neurons showing larger responses on either the CC or CW path with smaller responses at that heading on the other path; and place-selective neurons showing opposite heading direction preferences on the CC and CW paths such that they respond best when the monkey is in a particular part of the room. Our findings extend our previous observations with evidence of a continuum across these response profiles.
The current studies also show that a neuron's degree of path selectivity varies with the length of excursion around the circular path (Fig. 2). This effect is seen as an increasing difference in the responses to the preferred heading direction with longer excursions around the circle. Primarily, this is from increased responsiveness to the preferred heading on the preferred path, but our studies do not allow us to settle the issue of a potential contribution of decreased responsiveness on the nonpreferred path.
These findings differ from responses to the sustained presentation of a single optic flow heading direction stimulus (Duffy and Wurtz 1997) where tonic responses are stable for as long as 12 s after the first 50- to 75-ms phasic response period. Hence, we conclude that the successive changes of heading direction in circular path stimuli are fundamental to the dynamics of path selectivity. Our studies did not test whether path length effects might be seen with real-movement presented without visual stimulation, as such controls were not included in this study.
We have also found that the nature of the visual stimulus can alter MSTd neuronal response profiles. On the one hand, adding simulated earth-fixed objects or sled movement to optic flow stimuli changes the responses of individual neurons, but it has little effect on the relative proportion of heading, path and place neurons. On the other hand, the imposition of a full-field visual pattern on the optic flow stimulus causes a substantial increase the number of place neurons, at the expense of both the heading and path neurons (Fig. 3). These findings might seem to conflict with our earlier evidence of robust interactions between superimposed object motion and optic flow stimuli (Sato et al. 2010). However, the previous study focused on response amplitude additivity, whereas the current study focuses on circular path response profiles. In addition, in the current study, many individual neurons did show responses changes with the addition of objects to optic flow, only the percentage of heading, path, and place neurons did not change. Finally, we have also found that interactions between superimposed object motion and optic flow stimuli are greatly affected by top-down behavioral task influences, and such affects were not explored in the current study (Kishore et al. 2011).
Heading sequence effects.
The stability of response profiles in the absence of sled movement stimuli enabled our analysis of its underlying mechanisms using systematically varied visual stimuli (Fig. 4, A–D). We used the random presentation of 16 optic flow stimuli to define a baseline of responsiveness. Responses to the random series were compared with responses to systematically alternating opposite heading directions and to responses to the circular sequential presentation of those same heading stimuli to simulate movement on a circular path.
These studies revealed different patterns of responses in different classes of neurons. Heading neurons showed similar responses across all stimulus sequence conditions (Fig. 4E). Path neurons showed distinctly less responsiveness to random and alternating stimulus sequences, with robust responses to circular sequence stimuli, preferring either the CW or CC circular path's heading sequence (Fig. 4F). Finally, place neurons showed more complex response patterns, with the alternating stimuli evoking residual effects of the juxtaposed preferred and nonpreferred stimuli, along with their nearly opposite heading direction preferences with circular sequence stimuli (Fig. 4G).
These studies revealed little net effect of the alternating heading stimulus sequences (Fig. 5A) but robust effects of the circular path in both the path and place neurons (Fig. 5B). Thus full or partial disruption of the heading stimulus sequence that creates a naturalistic path substantially impairs path selectivity in these neurons.
Closer analysis of the responses to these stimuli revealed evidence of other distinctions between heading neurons and path or place neurons based on the time course of their responses. Heading neurons showed a gradual buildup of their responses during the presentation of their preferred stimuli during random sequence stimulus presentation. However, those neurons showed the gradual development of their highest firing rates when the same stimuli were presented as part of circular sequence (Fig. 6A). In contrast, path neurons did not build up to the full responses during random stimulus presentation but showed much clearer rapid onset of their responses during circular sequence stimulus presentation (Fig. 6B). The place neurons tended to be like the path neurons in this regard (Fig. 6C). A role for response time course in shaping stimulus sequence effects is supported by time-course changes within single neurons between random, alternating, and circular sequence stimuli (Fig. 7).
These findings are consistent with comparisons between Froehler's circular sequences of optic flow stimuli that showed path selectivity (Froehler and Duffy 2002) and Paolini's random sequences of optic flow heading stimuli that did not reveal substantial effects of stimulus sequences (Paolini et al. 2000). The apparent conflict between those findings may be explained by the temporal sequence phenomena and suggests that path sensitivity and susceptibility to place effects may be the product of difference in the time course of response integration in these neurons.
Higher-order optic flow selectivity.
We modeled response time course as an exponential function of their half-lives varying from 0.001 to 55 s. As the optic flow center of motion (COM) moves across monophasic excitatory receptive fields, time course has little effect on path selectivity (Fig. 8, A–C, left), where biphasic receptive fields with excitatory and inhibitory zones yields clear path selectivity with longer time courses (Fig. 8, A–C, right). This model predicts a wide spectrum of interactions between response time course and receptive field structure (Fig. 8D) interacting with the speed of heading changes and the axis of those changes across the visual field (Emerson et al. 1987).
Fig. 8.
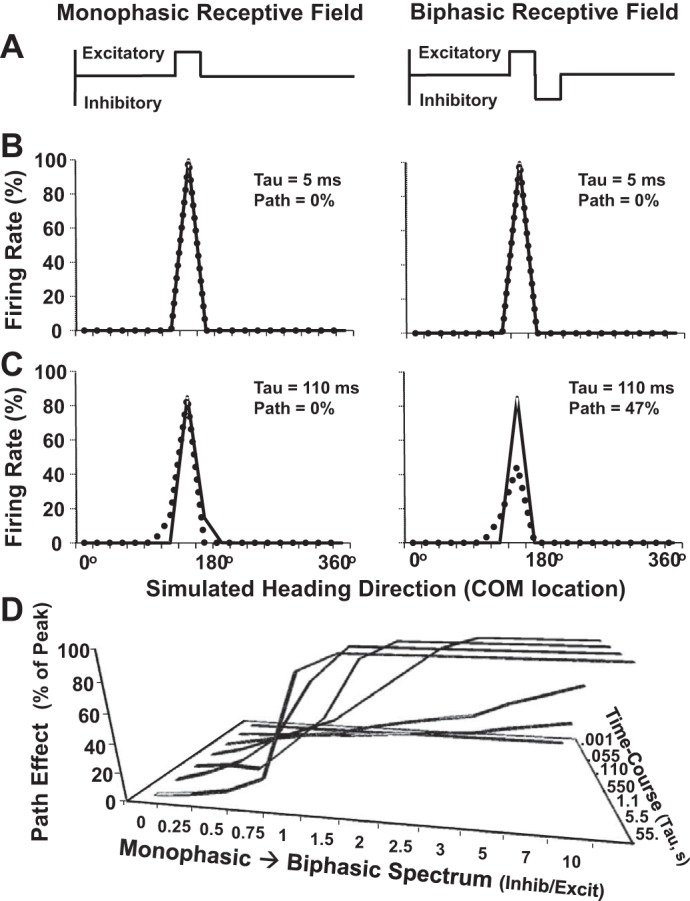
Model of MSTd neuronal responses to naturalistic sequences of optic flow stimuli seen during movement along a circular path. A: optic flow center of motion (COM)-sensitive receptive fields vary along a continuum from monophasic (left) to biphasic (right). Here, the ordinate represents relative neuronal excitation or inhibition and the abscissa represents the location of the COM for headings in the ground plane; directly backwards (0 or 360°), to straight ahead (180°). B: heading responses along CW and CC paths with rapid response time courses (low tau) yield heading selectivity with monophasic (left) and biphasic (right) receptive fields. C: heading responses along CW and CC paths with prolonged response time courses yield heading selectivity with monophasic receptive fields (left) and path selectivity with biphasic receptive fields (right). D: effect of COM-sensitive receptive field asymmetry (abscissa) on path sensitivity (ordinate) is depicted from a range of response time courses (lines). In this model, path sensitivity results from the concurrence of COM receptive field asymmetry along the axis of COM movement, and a response time course that is appropriate to the receptive field's dimensions as well as the speed of the headings changes.
Optic flow-sensitive MSTd neuronal receptive fields contain planar directional subfields (Tanaka et al. 1989; Tanaka and Saito 1989). The large-field visual motion patterns of optic flow coactivate these subfields to shape single neuron optic flow selectivities (Duffy and Wurtz 1991a,b). These effects reflect dynamic interactions between planar subfields whose direction preferences vary with the context created by motion in other parts of the visual field: subfield planar direction preferences change depending on the planar directions that are coactivating other subfields. These spatial integrative response interactions contribute to MSTd neuronal response selectivity for the global pattern of motion in optic flow (Yu et al. 2010).
In these respects, MSTd subfields show properties like those of neurons in the adjacent middle temporal area (MT) (Felleman and Kaas 1984; Livingstone et al. 2001) that projects to MST (Boussaoud et al. 1990). MT neuronal receptive fields are much smaller than those of optic flow-sensitive MSTd neurons but often have spatiotemporally dynamic properties comparable to those of MSTd neuronal subfields (Born et al. 2006; Pack et al. 2006; Zaksas and Pasternak 2005). In addition, MT neuronal response selectivities are shaped by the modulation of their planar directional subfield responses by direction selective surrounds via agonist and antagonist interactions (Britten and Heuer 1999; Huang et al. 2007; Rust et al. 2006). Thus spatial integrative interactions across directional selective subfields may be a common property of MT and MSTd neurons (Braddick 1993), the main distinction potentially being a matter of spatial scale and the resultant receptive field complexity. Thus our previous evidence that MSTd combines directional information across planar directional subfields to create optic flow selectivities is consistent with a more general principle of cortical neuronal spatial integration (Yu et al. 2010).
In addition, we now find that spatially integrated optic flow selectivities are subject to modulation by the temporal duration and sequence of optic flow stimuli. We make no assumptions or assertions regarding the origin of these temporal response properties, recognizing the potential role of factors from membrane biophysics to network dynamics. Thus, our current findings extend the view that receptive field subunits mediate the interactive spatial integration of directional responses by adding the further dimension of the temporal integration of directional responses.
We liken these temporal influences on MSTd neuronal responses to the receptive field mechanisms described for the more elementary form of visual motion processing mediated by retinal ganglion cells. In the frog retina, object motion activates ganglion cell direction-selective responses through a sequence-discrimination mechanism mediated by delayed lateral excitatory or inhibitory interactions that yield cumulative effects that establish preferred and antipreferred directions (Barlow and Levick 1965) (Fig. 9A).
Fig. 9.

Hypothetical neuronal architecture supporting MSTd neuronal path selectivity with reference to an analogous mechanism of elementary motion direction selectivity. A: in frog retinal ganglion cells, as in other systems, moving objects evoke direction selective responses based on the successive activation of intermediate elements that interact through time-dependent excitatory and inhibitory effects. B: moving headings may evoke path selective responses in MSTd neurons based on the successive activation of receptive field subfields that interact through time-dependent excitatory and inhibitory connections.
We hypothesize that MSTd neuronal responses may use similar mechanisms to derive self-movement path selectivity. In the case of MSTd, radial motion selectivity is the elementary response sensitivity, with the sequential presentation of offset foci of expansion having the cumulative effect of creating a preference for one direction of heading change over another. As in the retina, this would depend on the time courses of integration and decay in the involved neurons (Levick 2006), as is suggested by our findings in MSTd neurons (Fig. 9B).
The net effect of sequential stimulation, as occurs during the motion of a discrete point stimulus across the retina, and the motion of the radial focus of expansion across MSTd receptive fields is the emergent property of direction selectivity. In the retina, simple motion creates simple direction selectivity. In MSTd, the motion of the center of a motion pattern creates path selectivity. Thus analogous mechanisms for spatiotemporal integration may create lower or higher-order directional response selectivities.
GRANTS
This work was supported by National Eye Institute Grant R01-EY-022062 and Office of Naval Research Grant N000141110525.
DISCLOSURES
No conflicts of interest, financial or otherwise, are declared by the author(s).
AUTHOR CONTRIBUTIONS
Author contributions: W.K.P., N.S., M.T.F., W.V., and C.J.D. conception and design of research; W.K.P., N.S., M.T.F., W.V., and C.J.D. analyzed data; W.K.P., N.S., M.T.F., W.V., and C.J.D. interpreted results of experiments; W.K.P., N.S., M.T.F., and C.J.D. prepared figures; W.K.P. and C.J.D. drafted manuscript; W.K.P. and C.J.D. edited and revised manuscript; W.K.P., N.S., M.T.F., W.V., and C.J.D. approved final version of manuscript; N.S. and M.T.F. performed experiments.
ACKNOWLEDGMENTS
We gratefully acknowledge animal care and training assistance of Sherry Estes.
REFERENCES
- Barlow HB, Levick WR. The mechanism of directionally selective units in rabbit's retina. J Physiol 178: 477–504, 1965. [DOI] [PMC free article] [PubMed] [Google Scholar]
- Born RT, Pack CC, Ponce CR, Yi S. Temporal evolution of 2-dimensional direction signals used to guide eye movements. J Neurophysiol 95: 284–300, 2006. [DOI] [PubMed] [Google Scholar]
- Boussaoud D, Ungerleider LG, Desimone R. Pathways for motion analysis: cortical connections of the medial superior temporal and fundus of the superior temporal visual areas in the macaque. J Comp Neurol 296: 462–495, 1990. [DOI] [PubMed] [Google Scholar]
- Braddick O. Segmentation versus integration in visual motion processing. Trends Neurosci 16: 263–268, 1993. [DOI] [PubMed] [Google Scholar]
- Bremmer F, Kubischik M, Pekel M, Hoffmann KP, Lappe M. Visual selectivity for heading in monkey area MST. Exp Brain Res 200: 51–60, 2010. [DOI] [PubMed] [Google Scholar]
- Britten KH, Heuer HW. Spatial summation in the receptive fields of MT neurons. J Neurosci 19: 5074–5084, 1999. [DOI] [PMC free article] [PubMed] [Google Scholar]
- Crist CF, Yamasaki DS, Komatsu H, Wurtz RH. A grid system and a microsyringe for single cell recordings. J Neurosci Methods 26: 117–122, 1988. [DOI] [PubMed] [Google Scholar]
- Duffy CJ. MST neurons respond to optic flow and translational movement. J Neurophysiol 80: 1816–1827, 1998. [DOI] [PubMed] [Google Scholar]
- Duffy CJ, Wurtz RH. Medial superior temporal area neurons respond to speed patterns in optic flow. J Neurosci 17: 2839–2851, 1997. [DOI] [PMC free article] [PubMed] [Google Scholar]
- Duffy CJ, Wurtz RH. Response of monkey MST neurons to optic flow stimuli with shifted centers of motion. J Neurosci 15: 5192–5208, 1995. [DOI] [PMC free article] [PubMed] [Google Scholar]
- Duffy CJ, Wurtz RH. Sensitivity of MST neurons to optic flow stimuli. I. A continuum of response selectivity to large-field stimuli. J Neurophysiol 65: 1329–1345, 1991a. [DOI] [PubMed] [Google Scholar]
- Duffy CJ, Wurtz RH. Sensitivity of MST neurons to optic flow stimuli. II. Mechanisms of response selectivity revealed by small-field stimuli. J Neurophysiol 65: 1346–1359, 1991b. [DOI] [PubMed] [Google Scholar]
- Emerson RC, Citron MC, Vaughn WJ, Klein SA. Nonlinear directionally selective subunits in complex cells of cat striate cortex. J Neurophysiol 58: 33–65, 1987. [DOI] [PubMed] [Google Scholar]
- Felleman DJ, Kaas JH. Receptive-field properties of neurons in middle temporal visual area (MT) of owl monkeys. J Neurophysiol 52: 488–513, 1984. [DOI] [PubMed] [Google Scholar]
- Froehler MT, Duffy CJ. Cortical neurons encoding path and place: where you go is where you are. Science 295: 2462–2465, 2002. [DOI] [PubMed] [Google Scholar]
- Gu Y, DeAngelis GC, Angelaki DE. A functional link between area MSTd and heading perception based on vestibular signals. Nat Neurosci 10: 1038–1047, 2007. [DOI] [PMC free article] [PubMed] [Google Scholar]
- Hamed SB, Page W, Duffy C, Pouget A. MSTd neuronal basis functions for the population encoding of heading direction. J Neurophysiol 90: 549–558, 2003. [DOI] [PubMed] [Google Scholar]
- Hays AV, Richmond BJ, Optican LM. A UNIX-based multiple process system for real-time data acquisition and control. WESCON Conf Proc 2: 1–10, 1982. [Google Scholar]
- Heuer HW, Britten KH. Optic flow signals in extrastriate area MST: comparison of perceptual and neuronal sensitivity. J Neurophysiol 91: 1314–1326, 2004. [DOI] [PubMed] [Google Scholar]
- Huang X, Albright TD, Stoner GR. Adaptive surround modulation in cortical area MT. Neuron 53: 761–770, 2007. [DOI] [PMC free article] [PubMed] [Google Scholar]
- Judge SJ, Richmond BJ, Chu FC. Implantation of magnetic search coils for measurement of eye position: an improved method. Vision Res 20: 535–538, 1980. [DOI] [PubMed] [Google Scholar]
- Kishore S, Hornick N, Sato N, Page WK, Duffy CJ. Driving strategy alters neuronal responses to self-movement: cortical mechanisms of distracted driving. Cereb Cortex 22: 201–208, 2011. [DOI] [PMC free article] [PubMed] [Google Scholar]
- Komatsu H, Wurtz RH. Relation of cortical areas MT and MST to pursuit eye movements. I. Localization and visual properties of neurons. J Neurophysiol 60: 580–603, 1988a. [DOI] [PubMed] [Google Scholar]
- Komatsu H, Wurtz RH. Relation of cortical areas MT and MST to pursuit eye movements. III. Interaction with full-field visual stimulation. J Neurophysiol 60: 621–644, 1988b. [DOI] [PubMed] [Google Scholar]
- Lappe M, Bremmer F, Pekel M, Thiele A, Hoffmann KP. Optic flow processing in monkey STS: a theoretical and experimental approach. J Neurosci 16: 6265–6285, 1996. [DOI] [PMC free article] [PubMed] [Google Scholar]
- Levick WR. Direction selectivity in rabbit retina. J Physiol 577: 1–2, 2006. [DOI] [PMC free article] [PubMed] [Google Scholar]
- Livingstone MS, Pack CC, Born RT. Two-dimensional substructure of MT receptive fields. Neuron 30: 781–793, 2001. [DOI] [PubMed] [Google Scholar]
- Logan DJ, Duffy CJ, Logan DJ, Duffy CJ. Cortical area MSTd combines visual cues to represent 3-D self-movement. Cereb Cortex 16: 1494–1507, 2006. [DOI] [PubMed] [Google Scholar]
- Orban GA, Lagae L, Raiguel S, Xiao D, Maes H. The speed tuning of medial superior temporal (MST) cell responses to optic-flow components. Perception 24: 269–285, 1995. [DOI] [PubMed] [Google Scholar]
- Pack CC, Conway BR, Born RT, Livingstone MS. Spatiotemporal structure of nonlinear subunits in macaque visual cortex. J Neurosci 26: 893–907, 2006. [DOI] [PMC free article] [PubMed] [Google Scholar]
- Page WK, Duffy CJ. Heading representation in MST: sensory interactions and population encoding. J Neurophysiol 89: 1994–2013, 2003. [DOI] [PubMed] [Google Scholar]
- Paolini M, Distler C, Bremmer F, Lappe M, Hoffmann KP. Responses to continuously changing optic flow in area MST. J Neurophysiol 84: 730–743, 2000. [DOI] [PubMed] [Google Scholar]
- Rust NC, Mante V, Simoncelli EP, Movshon JA. How MT cells analyze the motion of visual patterns. Nat Neurosci 9: 1421–1431, 2006. [DOI] [PubMed] [Google Scholar]
- Saito H, Yukie M, Tanaka K, Hikosaka K, Fukada Y, Iwai E. Integration of direction signals of image motion in the superior temporal sulcus of the macaque monkey. J Neurosci 6: 145–157, 1986. [DOI] [PMC free article] [PubMed] [Google Scholar]
- Sato N, Kishore S, Page WK, Duffy CJ. Cortical neurons combine visual cues about self-movement. Exp Brain Res 206: 283–297, 2010. [DOI] [PMC free article] [PubMed] [Google Scholar]
- SPSS Inc. SPSS for Windows V11.01. Chicago, IL: SPSS, 2011. [Google Scholar]
- Tanaka K, Fukada Y, Saito HA. Underlying mechanisms of the response specificity of expansion/contraction and rotation cells in the dorsal part of the medial superior temporal area of the macaque monkey. J Neurophysiol 62: 642–656, 1989. [DOI] [PubMed] [Google Scholar]
- Tanaka K, Saito H. Analysis of motion of the visual field by direction, expansion/contraction, and rotation cells clustered in the dorsal part of the medial superior temporal area of the macaque monkey. J Neurophysiol 62: 626–641, 1989. [DOI] [PubMed] [Google Scholar]
- Yu CP, Page WK, Gaborski R, Duffy CJ. Receptive field dynamics underlying MST neuronal optic flow selectivity. J Neurophysiol 103: 2794–2807, 2010. [DOI] [PMC free article] [PubMed] [Google Scholar]
- Zaksas D, Pasternak T. Area MT neurons respond to visual motion distant from their receptive fields. J Neurophysiol 94: 4156–4167, 2005. [DOI] [PubMed] [Google Scholar]