Abstract
Collecting duct-derived endothelin (ET)-1 is an autocrine inhibitor of Na+ and water reabsorption; its deficiency causes hypertension and water retention. Extracellular fluid volume expansion increases collecting duct ET-1, thereby promoting natriuresis and diuresis; however, how this coupling between volume expansion and collecting duct ET-1 occurs is incompletely understood. One possibility is that volume expansion increases tubular fluid flow. To investigate this, cultured IMCD3 cells were subjected to static or flow conditions. Exposure to a shear stress of 2 dyn/cm2 for 2 h increased ET-1 mRNA content by ∼2.3-fold. Absence of perfusate Ca2+, chelation of intracellular Ca2+, or inhibition of Ca2+ signaling (calmodulin, Ca2+/calmodulin-dependent kinase, calcineurin, PKC, or phospholipase C) prevented the flow response. Evaluation of possible flow-activated Ca2+ entry pathways revealed no role for transient receptor potential (TRP)C3, TRPC6, and TRPV4; however, cells with TRPP2 (polycystin-2) knockdown had no ET-1 flow response. Flow increased intracellular Ca2+ was blunted in TRPP2 knockdown cells. Nonspecific blockade of P2 receptors, as well as specific inhibition of P2X7 and P2Y2 receptors, prevented the ET-1 flow response. The ET-1 flow response was not affected by inhibition of either epithelial Na+ channels or the mitochondrial Na+/Ca2+ exchanger. Taken together, these findings provide evidence that in IMCD3 cells, flow, via polycystin-2 and P2 receptors, engages Ca2+-dependent signaling pathways that stimulate ET-1 synthesis.
Keywords: collecting duct, endothelin, flow, purinergic
the collecting duct (CD) endothelin (ET)-1 system plays a key role in regulating arterial pressure and urinary Na+ excretion. The CD produces relatively high amounts of ET-1 (possibly more than any other cell type in the body) and expresses abundant ET receptors (27). ET-1 directly inhibits CD Na+ and water reabsorption (5, 51), raising the possibility that ET-1 functions as an autocrine natriuretic and diuretic factor in the CD. This has been confirmed by studies wherein CD-specific knockout of ET-1 or ET receptors caused impaired urinary Na+ and water excretion and salt-sensitive hypertension (2, 11, 12). Notably, ET receptor antagonist-induced fluid retention, a major factor limiting the success of these agents in clinical trials (4, 30), is due in large part to blockade of CD ET receptors (50). Thus, the CD ET system has emerged as a major factor in controlling arterial pressure and body fluid volume (BFV).
Given that CD-derived ET-1 modulates body volume homeostasis, it is important to understand how this system is regulated by changes in body volume status. Numerous studies in experimental animals and humans have demonstrated that urinary ET-1 excretion is increased in response to salt (6, 7, 23, 29, 34) or water loading (26, 56). Since urinary ET-1 derives entirely from the kidney (1), and in large part from the CD (2), these findings suggest that BFV regulates CD ET-1 production. This notion is supported by studies showing that salt loading increases CD ET-1 mRNA content in rats (28). Thus, the natriuretic and diuretic response to BFV expansion appears to be mediated in part by enhanced CD ET-1 production.
The mechanisms by which BFV expansion enhances CD ET-1 synthesis are incompletely understood. Aldosterone paradoxically stimulates CD ET-1 production (17), whereas atrial natriuretic peptide, ANG II, and vasopressin have minimal effects on the CD ET-1 system (13, 24). Hence, circulating hormones do not clearly explain BFV effects on CD ET-1. Increased interstitial NaCl concentration, as may occur in the renal cortex and outer medulla during salt loading, has been implicated in stimulating thick ascending limb ET-1 production (19). However, the effect of extracellular NaCl or osmolality on CD ET-1 production is controversial, with conflicting findings being reported (27). Recent studies by our group have suggested that tubule fluid flow may be involved: exposure of mpkCCD cells, a cortical CD cell line, to shear stress increased ET-1 mRNA (28, 36). Interestingly, this flow augmentation of mpkCCD ET-1 mRNA content was due to Na+ delivery; increasing Na+ delivery increased epithelial Na+ channel (ENaC)-mediated Na+ entry, which led to enhanced mitochondrial Na+/Ca2+ exchange (NCLX), increased intracellular Ca2+ concentration ([Ca2+]i), activation of Ca2+ signaling pathways, and, ultimately, increased ET-1 gene transcription (36). Thus, BFV expansion, leading to enhanced tubule fluid flow and Na+ delivery, may be at least one mechanism by which CD ET-1 production is increased.
The above studies do not, however, explain how water loading increases CD ET-1 production. Furthermore, they are unlikely to explain how inner medullary CD (IMCD) ET-1 production is increased by BFV expansion, since this nephron segment transports relatively less Na+ under basal and hormone stimulated conditions compared with the cortical CD (CCD) (44). This question is particularly relevant since the IMCD produces substantially more ET-1 and expresses a higher density of ET receptors than the CCD (27, 53). Consequently, to address this question, the present study was undertaken to examine the regulation of IMCD ET-1 production. We report flow-stimulated IMCD ET-1 production and, of greatest importance, describe two key findings: 1) an interaction between the purinergic and ET systems that may combine to elicit a sustained diuretic and natriuretic response and 2) a role for polycystin-2 in this flow effect.
MATERIALS AND METHODS
Reagents.
Calcineurin inhibitory peptide, calphostin C, Pyr3, SKF-96365, 5-BDBD, A-74003, and A-438079 hydrochloride were obtained from Tocris Bioscience (Ellisville, MO). Diinosine pentaphosphate was obtained from Timtec (Newark, DE). ARC-118925 was generously provided by Prof. Dr. Christa E. Müller (Pharmaceutical Institute, University of Bonn, Bonn, Germany). All other drugs and chemicals were obtained from Sigma (St. Louis, MO) unless stated otherwise.
Na+ and water loading experiments.
Male Sprague-Dawley rats (200–250 g, Harlan Laboratories, Indianapolis, IN) and C57/BL6 mice (25 g) were handled in accordance with University of Utah Institional Animal Care and Use Committee requirements. For salt loading experiments, all rats and mice were fed normal NaCl (0.25%) or high-NaCl (8%) diets and given free access to drinking water for 3 days each. For water loading, rats and mice were given free access to a regular NaCl diet plus water or water containing 1% sucrose for 3 days each. IMCDs were isolated using previously described procedures (47). Briefly, renal inner medullas were minced and incubated in 0.1% collagenase type I (Worthington, Freehold, NJ) containing type I DNase in HBSS (containing 1.26 mM CaCl2, 0.49 mM MgCl2, 0.41 mM MgSO4, 4.3 mM KCl, 0.44 mM KH2PO4, 4.2 mM NaHCO3, 138 mM NaCl, 0.34 mM Na2HPO4, and 5.6 mM dextrose) supplemented with 15 mM HEPES (pH 7.4) at 37°C. The digest was filtered through a 74-μm mesh screen to remove any residual tissue. The suspension was centrifuged for 5 min at 1,500 rpm, and the cell pellet was resuspended in 10% BSA in HBSS, further centrifuged, and washed with HBSS. The final cell pellet was used for RNA analysis as described below.
RNA analysis and real-time PCR.
RNA from acutely isolated and cultured cells was obtained using the RNeasy Mini Kit and reverse transcribed using an Omniscript RT Kit (Qiagen, Valencia, CA). GAPDH and ET-1 mRNA levels were determined by real-time PCR (StepOne Plus, Applied Biosystems, Foster City, CA) using the Taqman Gene Expression Assay with ET-1 (catalog no. Mm00438656_m1) and GAPDH (catalog no. Mm03302249_m1) primers.
Cell culture.
The mouse IMCD cell line IMCD3 was used for all experiments unless specified otherwise. IMCD3 cells with transient receptor potential (TRP)P2 (polycystin-2) knockdown were provided by Dr. Rajeev Rohatgi and Dr. Luca Gusella (Icahn School of Medicine, Mount Sinai, NY) (8). Cells were grown to confluence on 10-cm2 plastic culture plates in a 5% CO2 incubator at 37°C; 50:50 DMEM-F-12 supplemented with 10% FBS, 1 mg/ml penicillin, and 1 mg/ml streptomycin was used as the growth medium. For control experiments done under stationary conditions, cells were grown in 12-well plates under identical conditions.
Flow experiments.
Rectangular parallel plate polycarbonate flow chambers (catalog no. 31-010, Glycotech, Gaithersburg, MD) were attached to individual 10-cm cell culture plates containing confluent IMCD3 cells using vacuum and silastic gaskets to form a channel. The channel had the following dimensions: 0.25 mm depth, 1 cm width, and 5.9 cm in length, with a total surface area of 5.9 cm2 for cells exposed to flow. The flow chamber had two manifolds through which perfusate entered and exited the channel. The liquid was pumped through the channel by a peristaltic pump (Ismatec, Glattburg, Switzerland) to obtain specific shear stresses. HBSS (pH 7.4) was used as the perfusate for control experiments and was supplemented with drugs and/or chemicals for additional experiments. RNA was extracted from cells exposed to flow and from control cells. All experiments were performed at 37°C.
RT-PCR analysis for the detection of P2 receptor mRNA.
P2X and P2Y receptor mRNA expression were identified in IMCD3 cell extracts using two-step RT-PCR. C57BL/6 mouse kidney and brain total RNA were used as positive controls. The extracted RNA was quantified by microplate spectrophotometer Take3 (SynergyH1, Bio Tek Instruments, Winooski, VT). P2X and P2Y receptor cDNA sequences were obtained from GenBank. Sense and antisense primers (Integrated DNA Technologies, Coralville, IA) for each gene (Table 1) were designed on different exons to avoid amplification of contaminating genomic DNA except for P2Y4 and P2Y13, which contain a single coding exon. One microgram of total RNA was reverse transcribed at 42°C for 30 min in a 20-μl reaction volume using an iScript cDNA Synthesis Kit (Bio-Rad, Hercules, CA). The cDNA template was added to a 50-μl PCR including Taq DNA polymerase (Taq PCR Core Kit, QIAGEN Sciences), and PCRs were performed on an iCycler RT-PCR system (Bio-Rad). Amplified PCR products were run on a 2% agarose gel containing 0.5 μg/ml ethidium bromide and visualized using the Fluorchem E system (Proteinsimple, Santa Clara, CA). Product size was estimated with an exACTGene 100-bp DNA ladder (Thermo Fisher Scientific, Waltham, MA). Five primer sets were designed and tested for the P2Y14 receptor gene to detect all eight reported splice variants, and we found that the set shown in Table 1 showed specific bands for IMCD3 cells.
Table 1.
List of primers for PCR of purinergic receptor isoforms
| P2 Isoform | Sense Primer | Antisense Primer | Size, bp |
|---|---|---|---|
| P2X1 | 5′-CGTCTGATCCAGTTGGTGGTTCTG-3′ | 5′-TGCACAATGTCCTTGAGCCTGCTG-3′ | 255 |
| P2X2 | 5′-CCAAGTTCAAGTTCTCCAAGG-3′ | 5′-AAGTCCAGGTCACAGTTCC-3′ | 205 |
| P2X3 | 5′-GGGAAACCTCCTTCCTAACCTCAC-3′ | 5′-GCCAGGGGAAACACTGCTTTTCTC-3′ | 268 |
| P2X4 | 5′-TGCTCATCCTGGCTTACG-3′ | 5′-CCTTTGGCTTTGGTTGTCAC-3′ | 100 |
| P2X5 | 5′-TGCCCAGTGGAGACAAAGTCCATG-3′ | 5′-TCAGGGCTATGTCCTGGAAGTCAG-3′ | 247 |
| P2X6 | 5′-GGGCATCAGCATTCACTGGGATTG-3′ | 5′-AGGTCACAGAGGAAGGTGACCATG-3′ | 279 |
| P2X7 | 5′-CAAGACTTGGGACCCTCAGTGTTC-3′ | 5′-CGAAGGACTCATCCGTGTTCTTGTC-3′ | 206 |
| P2Y1 | 5′-AGGAAAGCTTCCAGGAGGAGTGAG-3′ | 5′-GTGGCACACACTGGTCTTTTGGTC-3′ | 227 |
| P2Y2 | 5′-TGAGCATCCTCACCACCTCAAGAG-3′ | 5′-CTGCGTAGAGAGAGTCCGAAACTG-3′ | 298 |
| P2Y4 | 5′-AAGATAGTCCTACCTGTCAAG-3′ | 5′-GCGTCTACTCCTGTTACC-3′ | 368 |
| P2Y6 | 5′-TCAGACTGAGGACGTCAGTGCTTC-3′ | 5′-AAATCCTCACGGTAGACGCAGGTG-3′ | 282 |
| P2Y12 | 5′-CAGAGGGCTTTGGGAACTTAT-3′ | 5′-GAACCTGGGTGATCTTGTAGTC-3′ | 219 |
| P2713 | 5′-GGTCCCTGATGTTCTTCATCTC-3′ | 5′-CCTGCTGTCCTTACTCCTAAAC-3′ | 239 |
| P2Y14 | 5′-ATGCAGCACTTCCCGCTTGTCAAC-3′ | 5′-GGGTCTGTGGTGGTGGAGTTGTTC-3′ | 290 |
Western blot analysis of P2 receptor expression.
Mouse IMCD3 cells were lysed and prepared for Western blot analysis as previously described (42). Protein concentration was determined using the Bradford assay (Bio-Rad). Samples were diluted with sample buffer and denatured (10 min, 70°C) using a dry bath incubator. Equal amounts of protein from each sample (run in duplicate) were separated electrophoretically using 4–12% Bolt bis-Tris gels (Invitrogen, Carlsbad, CA) and transferred to Hybond ECL nitrocellulose blotting membranes (GE Healthcare Bio-Sciences, Piscataway, NJ). Membranes were blocked in a solution of 5% nonfat dry milk and PBS + 0.1% Tween 20 (pH 7.4, 60 min) followed by an overnight incubation (4°C) with rabbit polyclonal anti-P2 receptor primary antibody (P2X1, P2X2, P2X3, P2X4, P2X5, P2X6, P2X7, P2Y1, P2Y2, P2Y4, P2Y6, P2Y12, P2Y13, and P2Y14, Alomone Labs, Jerusalem, Israel). Blots were washed with PBS + 0.1% Tween 20 and incubated with secondary antibody (1:4,000, goat anti-rabbit IgG horseradish peroxidase conjugate, Cell Signaling Technology, Danvers, MA) at room temperature for 60 min. Immunoreactivity was detected by enhanced chemiluminescence (Clarity Western ECL Substrate, BIo-Rad), and images were developed after exposure to X-ray film (CLASSIC X-Ray Film, Research Products, Prospect, IL). The same membranes were stripped, washed, and reprobed with monoclonal anti-β-actin antibody (1:10,000, Sigma) as a loading control. Information on the expected band sizes for each P2 receptor isoform is shown in Table 2.
Table 2.
List of amino acid sequence lengths and predicted molecular masses of purinergic receptor isoforms
| P2 Isoform | Sequence Length, amino acids | Predicted Molecular Mass, kDa |
|---|---|---|
| P2X1 | 399 | 44 |
| P2X2 | 472 | 52 |
| P2X3 | 397 | 44 |
| P2X4 | 388 | 43 |
| P2X5 | 455 | 51 |
| P2X6 | 379 | 42 |
| P2X7 | 595 | 68 |
| P2Y1 | 373 | 42 |
| P2Y2 | 374 | 42 |
| P2Y4 | 361 | 40 |
| P2Y6 | 328 | 36 |
| P2Y11 | 374 | 40 |
| P2Y12 | 342 | 39 |
| P2713 | 354 | 40 |
| P2Y14 | 338 | 38 |
Determination of [Ca2+]i.
IMCD3 cells grown on 40-mm glass coverslips were incubated in serum-free DMEM-F-12 containing 25 μM fura-2 AM (Molecular Probes, Eugene, OR), a cell-permeant Ca2+ indicator dye, for 20 min. Cells were placed in a parallel plate-type laminar perfusion chamber (FCS2, Bioptechs, Butler, PA) and set on the stage of a Nikon Eclipse TE300 inverted epifluorescence microscope linked to a cooled Pentamax charge-coupled device camera (Princeton Instruments) interfaced with a digital imaging system (MetaFluor, Universal Imaging, Westchester, PA). The chamber temperature was maintained at 37°C with an FCS2 Temperature Controller (Bioptechs) and perfused using a FCS Micro-Perfusion Pump (Bioptechs). Cells were viewed and imaged using a ×40 epifluorescence objective, which does not require water or oil immersion. Cells were initially kept under static conditions for at least 400 s to ensure that fluorescence was stable. The shear generated across the monolayer was calculated using Poiseulle's law [τ = μγ = 6μQ/a2b, where τ is wall stress (in dyn/cm2), γ is shear rate (in s), μ is the apparent viscosity of the fluid (media at 37°C = 0.76 cP), Q is the volumetric rate (in ml/s), a is the channel height (in cm), and b is the channel width (in cm)] to generate a fluid shear stress of ∼0.4 dyn/cm2. Throughout the experiment, cells were alternately excited at 340 and 380 nm, and images acquired every 1–15 s were digitized for subsequent analysis. Images were acquired every 1 s just before cells were exposed to shear stress and continued up until the peak fluorescence was achieved. At the conclusion of each experiment, an intracellular Ca2+ calibration was performed using standard techniques, which included using Ca2+-free solution containing EGTA-AM (10 μM) for 10–15 min and a Ca2+-containing solution with ionomycin (10 μM). Standard equations were used to calculate experimental values of [Ca2+]i for the cells monitored. Four to nine centrally located cells were analyzed in each monolayer per experiment. The mean baseline [Ca2+]i value for each cell was calculated by averaging the eight [Ca2+]i values measured just before shear was increased. Peak [Ca2+]i was taken as the average of the three highest [Ca2+]i values after the induction of fluid shear stress (43).
Statistics.
Data are presented as means ± SE. One-way ANOVA was used to compare differences between groups. A Shapiro-Wilk test was used to evaluate for normal distribution. A paired t-test was used to evaluate the statistical significance of basal [Ca2+]i versus peak [Ca2+]i within the same cell. An unpaired t-test was used to compare [Ca2+]i between control and TRPP2-deficient cells. P values of <0.05 were considered significant.
RESULTS
Na+ and water loading in the IMCD.
To determine the effect of salt or water loading on ET-1 mRNA production, acutely isolated IMCDs from mice or rats fed a normal or high NaCl or water diet were evaluated for ET-1 mRNA content. In both mice (Fig. 1A) and rats (Fig. 1B), salt or water loading increased ET-1 mRNA content. The data on NaCl loading have been previously published (28) but are included here for purposes of comparison with water loading. It should be noted that ET-1 mRNA, as opposed to ET-1 protein, was measured in the present study (in both acutely isolated and cultured IMCDs). ET-1 protein release or cell content is not detectable due to the relatively small numbers of cells involved. However, in essentially every condition in which ET-1 mRNA and protein have been measured, ET-1 mRNA reflects ET-1 protein levels (27, 48). This may be due, at least in part, to the fact that ET-1 mRNA is very short lived (half life of ∼15 min) due to the presence of destabilizing AUUUA sequences in the 3′-untranslated region of the ET-1 message (31, 32).
Fig. 1.

Effect of Na+ or water loading on inner medullary collecting duct (IMCD) endothelin (ET)-1 mRNA content in rats (A) and mice (B). For Na+ loading, rats and mice were fed a normal NaCl (0.25%) or high-NaCl (8%) diet for 3 days. For water loading, rats and mice were fed 1% sucrose in normal drinking water for 3 days. n = 3 for each data point. *P < 0.05 vs. animals fed a normal NaCl and water diet.
Effect of flow on IMCD3 ET-1 mRNA.
To determine the effect of flow on IMCD3 ET-1 mRNA, an empiric 2-h period was chosen to expose cells to flow at shear stresses from 0–7.5 dyn/cm2. All levels of shear stress (0.25, 0.5, 1, 2, 5, and 7.5 dyn/cm2) stimulated ET-1 mRNA; the degree of stimulation (∼2–2.5-fold increase) was not significantly different between shear stress magnitudes (Fig. 2A). A shear stress of 2 dyn/cm2 was chosen for all further experiments. A time course was performed at a shear stress of 2 dyn/cm2 for 15 min, 30 min, 1 h, 2 h, and 4 h. A slight increase in ET-1 mRNA was first observed at 1 h and was significantly increased at 2 h (Fig. 2B). By 4 h, cells had begun to detach. Based on these findings, all subsequent experiments were carried out for 2 h at a shear stress of 2 dyn/cm2. Please note that since ET-1 production is largely regulated at the transcriptional level, it is not unexpected for the flow effect to require 1–2 h to detectably alter ET-1 mRNA levels.
Fig. 2.
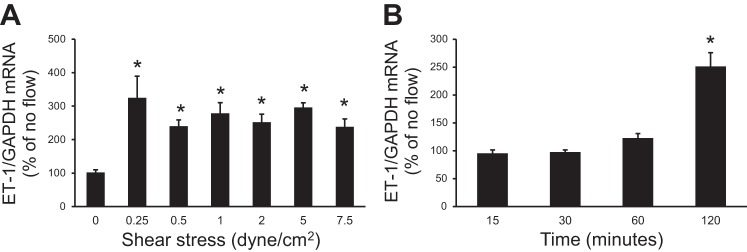
Dose response (A) and time course (B) of the flow effect on ET-1 mRNA levels in IMCD3 cells. For the dose response, cells were subjected to different shear stress for 2 h; for the time course, cells were exposed to a shear stress of 2 dyn/cm2 for different lengths of time. n = 12 for each data point. *P < 0.05 vs. cells not exposed to flow.
Role of Ca2+ in flow-stimulated IMCD3 ET-1 mRNA production.
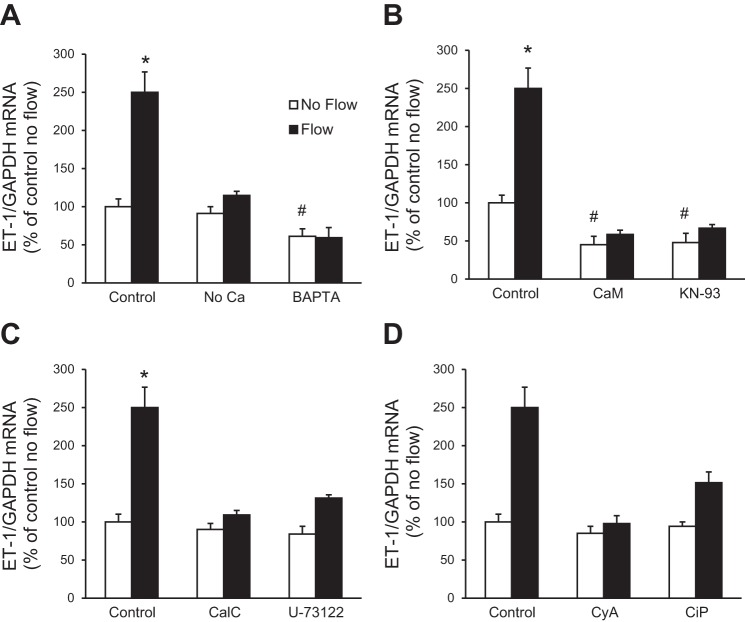
Since shear stress-induced cell signaling may depend, at least in part, on changes in [Ca2+]i (3, 45), the involvement of Ca2+ in flow-regulated ET-1 mRNA accumulation in IMCD3 cells was determined. Cells were exposed to no flow and flow conditions using Ca2+-free HBSS (no CaCl2 added to the formulation and no EGTA added). Absence of media Ca2+ prevented the flow-stimulated ET-1 mRNA increase (Fig. 3A). To examine the role of [Ca2+]i in the ET-1 flow response, cells were pretreated for 30 min with BAPTA-AM (an intracellular Ca2+ chelator, hereafter referred to as BAPTA) and then exposed to static or flow conditions. The ET-1 flow response was completely prevented by treatment with BAPTA (Fig. 3A). In addition, BAPTA reduced basal (no flow) ET-1 mRNA, possibly due to inhibition of autocrine activation of Ca2+-dependent ET-1 production. Thus, both extracellular and intracellular Ca2+ are required for the ET-1 flow response in IMCD3 cells.
Fig. 3.
Effect of Ca2+ and inhibitors of Ca2+ signaling molecules on flow-regulated ET-1 mRNA in IMCD3 cells. Cells were preincubated with perfusate HBSS, Ca2+-free media, or 50 μM BAPTA-AM (an intercellular Ca2+ chelator) (A); 20 μM calmidazolium chloride [an inhibitor of calmodulin (CaM)] or 10 μM KN-93 [a CaM-dependent kinase (CaMK) inhibitor] (B); 0.1 μM calphostin C (CalC; a PKC inhibitor) or 2 μM U-71322 [a phospholipase C (PLC) inhibitor] (C); and 3 μg/ml cyclosporine A (CyA) or 10 μM calcineurin inhibitory peptide (CiP) (both inhibitors of calcineurin) (D) for 30 min. Cells were then subjected to static or flow (2 h at 2 dyn/cm2) conditions followed by the determination of ET-1/GAPDH mRNA levels. n = 12 for each data point. *P < 0.05 vs. cells treated identically but not exposed to flow; #P < 0.05 vs. the no-flow control.
Effect of inhibition of Ca2+ signaling molecules on flow-stimulated IMCD3 ET-1 mRNA production.
Given that Ca2+ is involved in the ET-1 flow response in IMCD3 cells, we next investigated the role of pathways mediating Ca2+ signaling. Inhibition of calmodulin (CaM) with calmidazolium chloride markedly reduced the ET-1 flow response (Fig. 3B). KN-93, an inhibitor of CaM-dependent kinase (CaMK), also greatly inhibited the ET-1 flow response (Fig. 3B). Both CaM and CaMK inhibition reduced basal (no flow) IMCD3 ET-1 mRNA. Since ET-1 in endothelial cells can be modulated by shear stress via Ca2+-sensitive pathways [phospholipase C (PLC) and PKC], we investigated their role in the ET-1 flow response. Inhibition of PKC (calphostin C) prevented the flow-stimulated ET-1 mRNA increase (Fig. 3C). PLC inhibition (U-73122) also prevented flow-induced ET-1 mRNA accumulation in IMCD3 cells (Fig. 3C). Since the above Ca2+ signaling pathways can modulate calcineurin, the effect of inhibition of calcineurin on the IMCD3 ET-1 flow response was evaluated. Inhibition of calcineurin (cyclosporine A or calcineurin inhibitory peptide) prevented the flow-stimulated ET-1 increase (Fig. 3D). Taken together, these data suggest the involvement of Ca2+/CaM/CaMK/PKC/PLC/calcineurin in flow-regulated IMCD ET-1 mRNA accumulation.
TRP channels and flow-stimulated IMCD3 ET-1 mRNA production.
CD cells express TRP channels on their apical membrane that mediate Ca2+ entry and are flow sensitive, including TRPC3, TRPC6, and TRPV4 (15, 55) as well as TRPP2 (39). Treatment with inhibitors of TRPC3 (Pyr3), TRPC6 (SKF-96365), and TRPV4 (RN-1734) did not significantly alter flow-induced ET-1 mRNA accumulation (Fig. 4). In contrast, an IMCD3 cell line with knockdown of polycystin-2 expression was subjected to flow; no increase in ET-1 mRNA in response to flow was observed (Fig. 4). Taken together, these data suggest a role for polycystin-2, but not TRPC3, TRPC6, or TRPV4, in flow-stimulated ET-1 mRNA accumulation in IMCD3 cells.
Fig. 4.
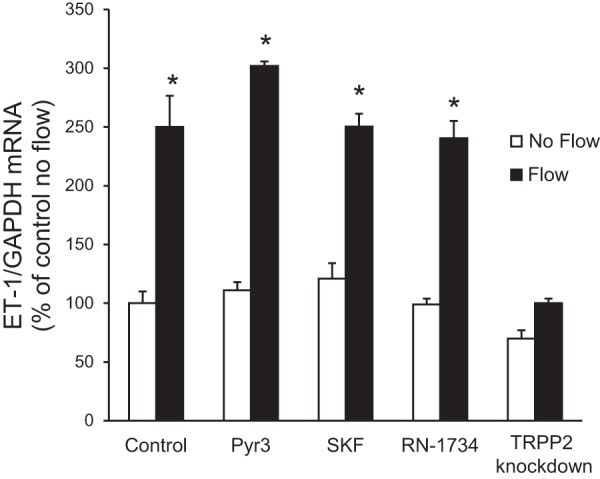
Effect of transient receptor potential (TRP) channel inhibition or knockdown on flow-stimulated ET-1 mRNA levels in IMCD3 cells. For inhibitor experiments, cells were pretreated for 30 min with 10 μM Pyr3 (a TRPC3 inhibitor), 20 μM SKF-96365 (SKF; a TRPC6 inhibitor), or 30 μM RN-1734 (a TRPV4 inhibitor). To study the role of polycystin-2, IMCD3 cells with TRPP2 or TRPP2 knockdown were used. Cells were exposed to static or flow (2 h at 2 dyn/cm2) conditions followed by the determination of ET-1/GAPDH mRNA levels. n = 12 for each data point. *P < 0.05 vs. cells treated identically but not exposed to flow.
Effect of flow on [Ca2+]i in normal and TRPP2 knockdown cells.
While the above experiments strongly indicated that flow increases [Ca2+]i in IMCD3 cells, this was directly confirmed by measurement of [Ca2+]i using fura-2 AM-loaded cells. Figure 5 shows representative flow-induced [Ca2+]i transients in these two cell types. As shown in Fig. 6, flow (0.4 dyn/cm2) increased [Ca2+]i from a basal level of 85.7 ± 8.2 nM to a peak of 243.4 ± 24.9 nM. To determine whether loss of the ET-1 flow response in IMCD3 TRPP2 knockdown cells was associated with an altered [Ca2+]i response to flow, IMCD3 cells with TRPP2 knockdown were evaluated. These cells had lower basal [Ca2+]i (50.2 ± 4.1 nM) and also had a reduced peak [Ca2+]i response to flow (121.8 ± 11.8 nM; Fig. 6). It should be noted that TRPP2 knockdown is ∼80% in these cells, as determined in the present study and as previously reported (8), so it is not possible to say whether incomplete blockade of the [Ca2+]i response to flow was due to remaining TRPP2 or some other mechanism.
Fig. 5.
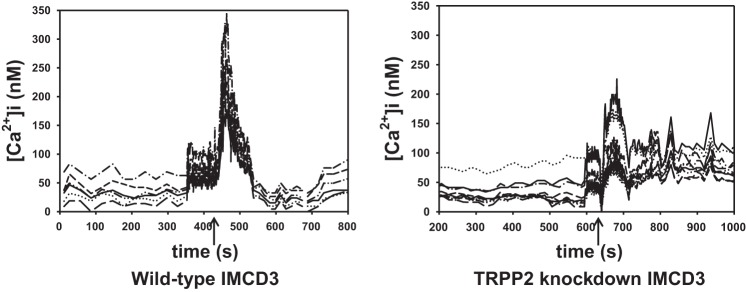
Representative tracings of flow-induced Ca2+ transients in IMCD3 wild-type and TRPP2 knockdown IMCD3 cells (the arrow identifies when flow was initiated). [Ca2+]i, intracellular Ca2+ concentration.
Fig. 6.
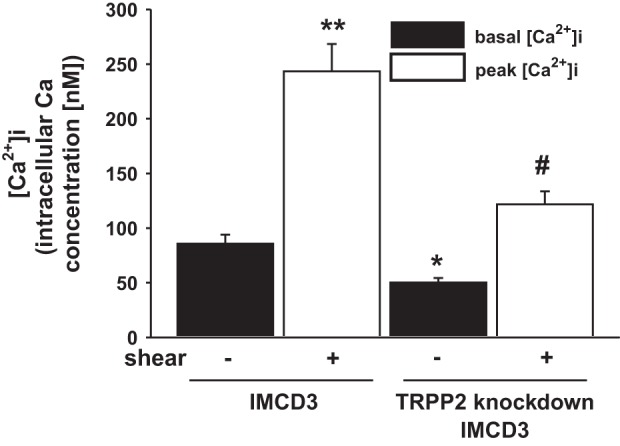
Effect of flow (0.4 dyn/cm2) on [Ca2+]i in IMCD3 cells with normal or knocked down TRPP2 expression. The time to peak [Ca2+]i was similar between the normal and TRPP2 knockdown cells; peak [Ca2+]i is shown at 60 s. n = 24 normal IMCD3 cells and 26 TRPP2 knockdown IMCD cells. *P < 0.05 vs. static normal IMCD3 cells; #P < 0.05 vs. static IMCD3 TRPP2 knockdown cells; **P < 0.05 vs. static normal IMCD3 cells.
Identification of purinergic receptors in flow-stimulated IMCD3 ET-1 mRNA production.
In addition to polycystin-2 and other TRP channels, Ca2+ can enter cells via apical purinergic P2X receptors (25). Furthermore, apical purinergic P2Y receptors may modify P2X receptor-mediated Ca2+ entry (25). To assess for a possible role of purinergic receptors, IMCD3 cells were first exposed to a nonspecific purinergic receptor antagonist [pyridoxal-phosphate-6-azophenyl-2′,4′-disulfonate (PPADS)], and the effect on flow-stimulated ET-1 mRNA was assessed. Treatment with PPADS abolished the ET-1 flow response (Fig. 7). To further confirm the role of purinergic receptors in the ET-1 flow response, IMCD3 cells were exposed to P2 receptor agonists to saturate the receptors and mitigate any additional purinergic signaling potentially elicited by flow. As shown in Fig. 6, preincubation with γ-ATP (relatively P2Y specific) or α,β-methylene-ATP (relatively P2X specific) largely prevented additional flow stimulation of ET-1 mRNA content. Notably, both ATP and α,β-methylene-ATP increased basal (no flow) ET-1 mRNA levels, suggesting that prestimulation of these receptors prevented their further activation by flow. Taken together, these data support the notion that purinergic receptors, and possibly both P2X and P2Y receptors, are involved in the flow regulation of IMCD3 ET-1 mRNA accumulation.
Fig. 7.
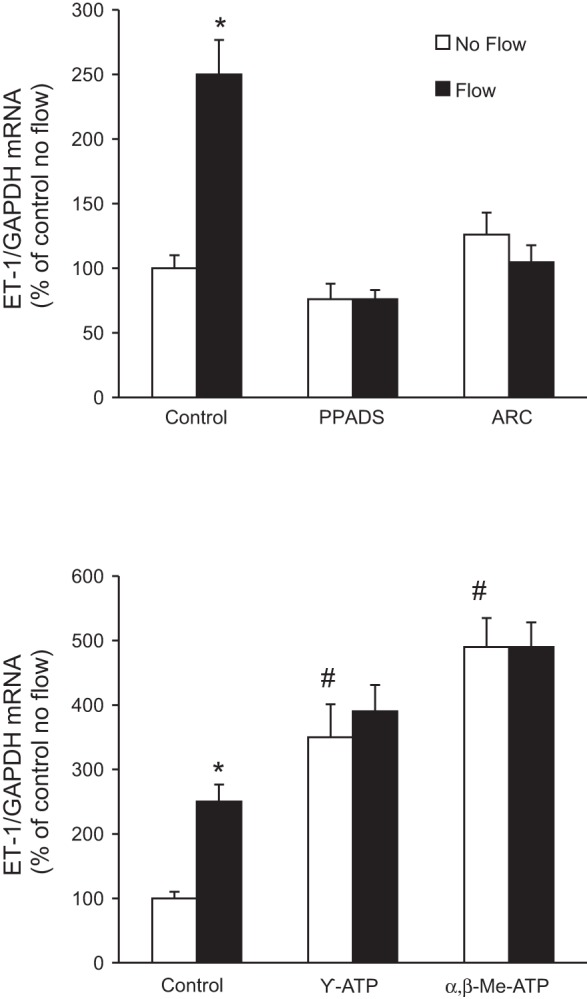
Effect of P2X or P2Y2 inhibition (top) or P2 receptor agonists (bottom) on flow-stimulated ET-1 mRNA levels in IMCD3 cells. Cells were pretreated for 30 min with 30 μM pyridoxal-phosphate-6-azophenyl-2′,4′-disulfonate (PPADS; a P2X inhibitor), 10 μM ARC-118925 (ARC; a P2Y2 inhibitor), 30 μM γ-ATP (a purinergic receptor agonist more specific for P2Y receptors), or α,β-methylene (Me) ATP (a purinergic receptor agonist more specific for P2X receptors) and then exposed to static or flow (2 h at 2 dyn/cm2) conditions followed by the determination of ET-1/GAPDH mRNA levels. n = 10 for each data point. *P < 0.05 vs. cells treated identically but not exposed to flow; #P < 0.05 vs. the no-flow control.
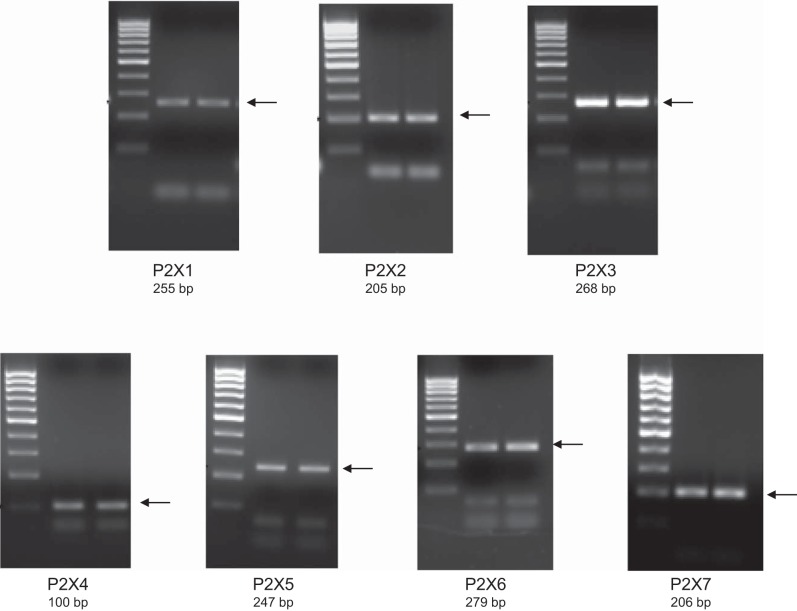
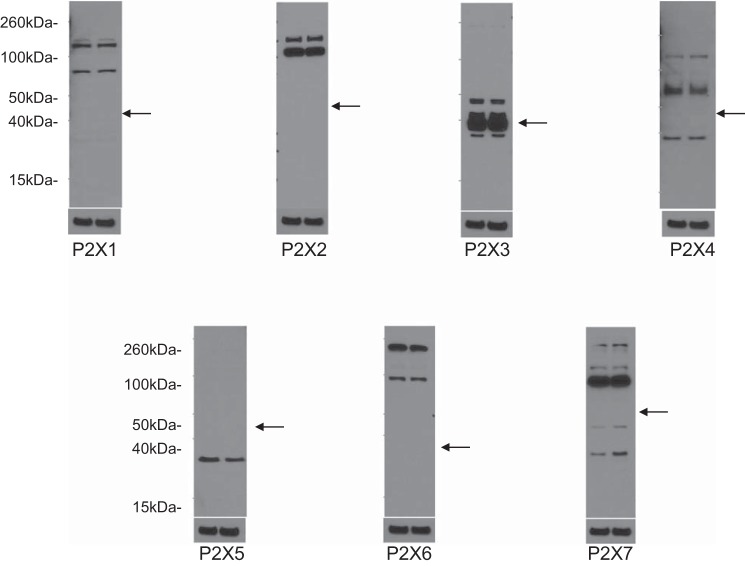
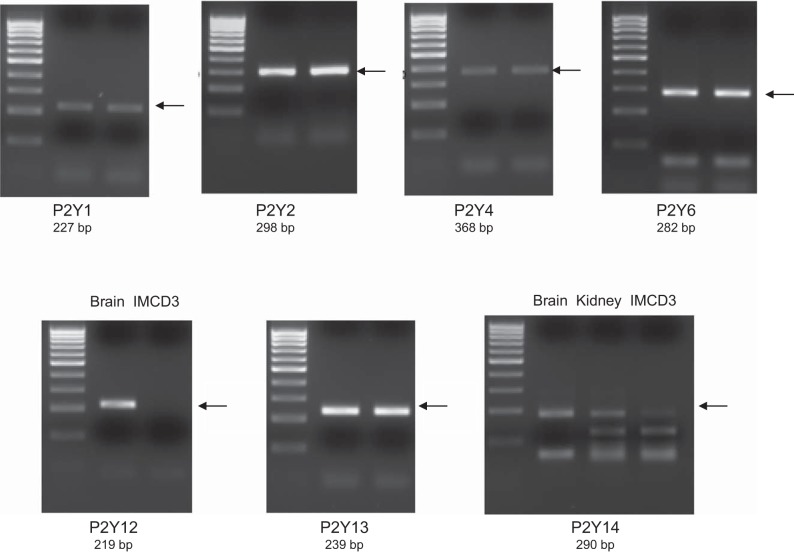
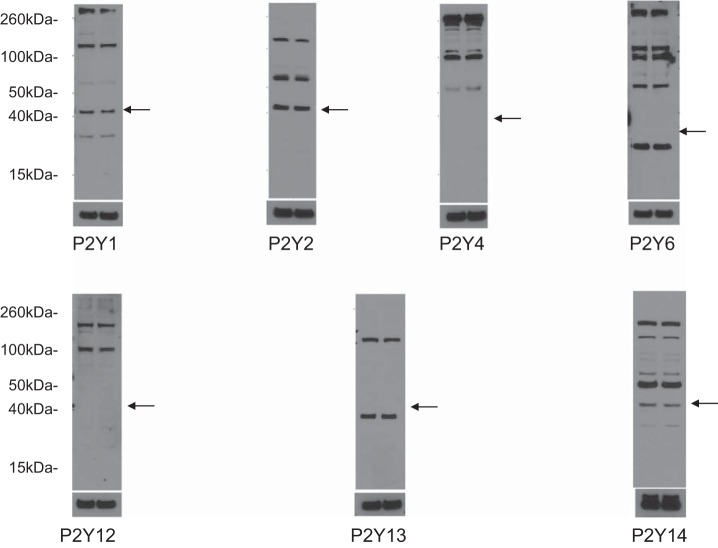
To begin to determine which P2 receptors may be involved in the ET-1 flow response, mRNA and protein expression for known P2 receptor isoforms were determined in IMCD3 cells. As shown in Fig. 8, mRNAs for all known isoforms of P2X receptors were detected. Bands were seen on Western blots for P2X isoforms (Fig. 9). However, in most cases, the expected molecular masses for the unmodified proteins were not detected; whether protein modification resulted in different molecular masses or the proteins were simply not present is an open question. As shown in Fig. 10, mRNAs for all known P2Y receptors were detected in IMCD3 cells with the exception of P2Y12 and P2Y14. Bands were seen on Western blots for P2Y isoforms (Fig. 11); however, in some cases, the expected molecular masses were not observed. Please note that reverse transcriptase negative controls were run for all PCR samples and showed no bands. Cells were then pretreated with a variety of specific P2 isoform antagonists, and the effect on flow-stimulated ET-1 mRNA was assessed. Please note that attempting to block each purinergic receptor isoform was not feasible due to the lack of specific reagents; it was also impractical to use small interfering RNA for each receptor. Consequently, efforts were focused on P2 receptors that were known to be expressed by the IMCD in vivo and that had been implicated in possibly modifying CD salt and/or water transport. P2Y2 inhibition with ARC-118925 completely prevented flow-stimulated ET-1 mRNA accumulation (Fig. 7). Treatment with inhibitors of P2X1, P2X3 (0.1 μM and 10 μM diinosine pentaphosphate, respectively), or P2X4 (5-BDBD) did not alter the ET-1 flow response (Fig. 12). In contrast, treatment with the P2X7 antagonists A-438079 or A-740003 abolished the ET-1 flow response (Fig. 12). Thus, these data suggest that both P2Y2 and P2X7 mediate flow-stimulated IMCD ET-1 mRNA accumulation.
Fig. 8.
RT-PCR analysis of P2X receptor mRNA expression in IMCD3 cells. Results from two separate IMCD samples are shown. Primer sequences used for each receptor are shown in Table 1. Arrows indicate the expected band size.
Fig. 9.
Western blot analysis of P2X receptor expression in IMCD3 cells. Results are shown in duplicate for each receptor subtype along with β-actin loading controls. Each of the two lanes was loaded with IMCD3 cell lysates (20 μg protein/lane). Predicted molecular sizes are shown in Table 2. Arrows represent the approximate predicted protein size based on the Accession Number database (http://www.uniprot.org/uniprot).
Fig. 10.
RT-PCR analysis of P2Y receptor mRNA expression in IMCD3 cells. Results from two separate IMCD3 samples are shown for all blots except P2Y12 and p2Y14. C57BL/6 mouse brain and kidney total RNA were used as positive controls for P2Y12 and/or p2Y14. Primer sequences used for each receptor are shown in Table 1. Arrows indicate the expected band size.
Fig. 11.
Western blot analysis of P2Y receptor expression in IMCD3 cells. Results are shown in duplicate for each receptor subtype along with β-actin loading controls. Each of the two lanes was loaded with IMCD3 cell lysates (20 μg protein/lane). Predicted molecular sizes are shown in Table 2. Arrows represent the approximate predicted protein size based on the Accession Number database (http://www.uniprot.org/uniprot).
Fig. 12.
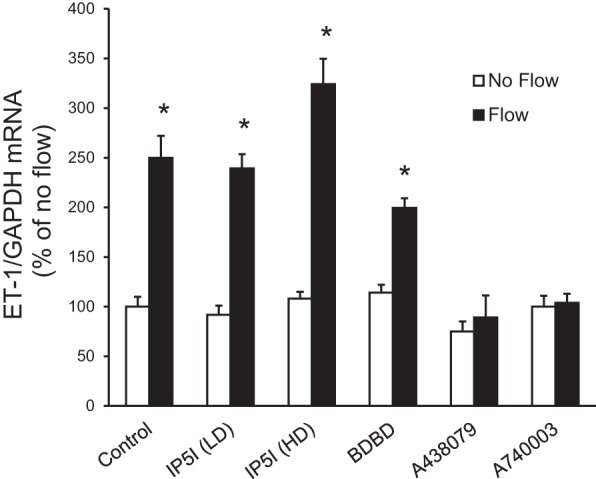
Effect of P2X receptor isoform inhibition on flow-stimulated ET-1 mRNA levels in IMCD3 cells. Cells were pretreated for 30 min with 0.1 μM diinosine pentaphosphate [IP51 (LD); a P2X1 inhibitor], 10 μM diinosine pentaphosphate [1P51 (HD); a P2X3 inhibitor], 15 μM 5-BDBD (a P2X4 inhibitor), 50 μM A-438079 (a P2X7 inhibitor), or 20 μM A-740003 (a P2X7 inhibitor) and exposed to static or flow (2 h at 2 dyn/cm2) conditions followed by the determination of ET-1/GAPDH mRNA levels. n = 10 for each data point. *P < 0.05 vs. cells treated identically but not exposed to flow.
Purinergic receptor evoked signaling in ATP-stimulated IMCD3 ET-1 mRNA content.
To determine whether the effect of ATP on IMCD3 ET-1 mRNA production was mediated by Ca2+ and Ca2+-regulated signaling pathways, the effect of ATP on ET-1 mRNA in IMCD3 cells under stationary (no flow) conditions was assessed (Fig. 13). First, blockade of P2 receptors with PPADS prevented ATP stimulation of ET-1 mRNA, confirming it was acting via a P2 receptor. Removal of media Ca2+ or chelation of [Ca2+]i with BAPTA markedly reduced ATP-stimulated ET-1 mRNA. Inhibition of CaM or PLC also blocked the ATP response. Hence, ATP stimulation of IMCD3 ET-1 mRNA is substantially dependent upon [Ca2+]i and extracellular Ca2+ concentration and is completely dependent on CaM and PLC.
Fig. 13.
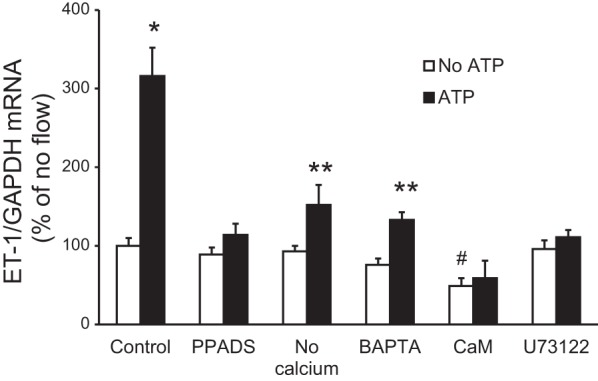
Effect of modulation of Ca2+, Ca2+-regulated pathways, or P2 receptor blockade on ATP-stimulated ET-1 mRNA levels in IMCD3 cells under stationary conditions. Cells were pretreated for 30 min with 30 μM PPADS (a P2X inhibitor), media lacking Ca2+, 50 μM BAPTA-AM (an intercellular Ca2+ chelator), 20 μM calmidazolium chloride (an inhibitor of CaM), or 2 μM U-71322 (a PLC inhibitor) followed by exposure to vehicle or 30 μM γ-ATP for 2 h and then the determination of ET-1/GAPDH mRNA levels. n = 8–10 per data point. *P < 0.05 vs. no ATP; **P < 0.05 vs. no ATP and vs. the ATP control (without inhibitor or no Ca2+ media); #P < 0.05 vs. the no ATP control.
Role of ENaC on flow-stimulated IMCD ET-1 mRNA production.
As described in the Introduction, the ET-1 flow response in mpkCCD cells is mediated by Na+ delivery via ENaC (36). To determine if this mechanism is operative in IMCD3 cells, the effect of specific ENaC inhibitors (amiloride and benzamil) on the ET-1 flow response was assessed. Neither ENaC inhibitor modified flow-stimulated ET-1 mRNA accumulation in IMCD3 cells (Fig. 14). Finally, blockade of NCLX with CGP-371571 did not alter the ET-1 flow response. Thus, ENaC and NCLX are not involved in the ET-1 flow response in IMCD3 cells.
Fig. 14.
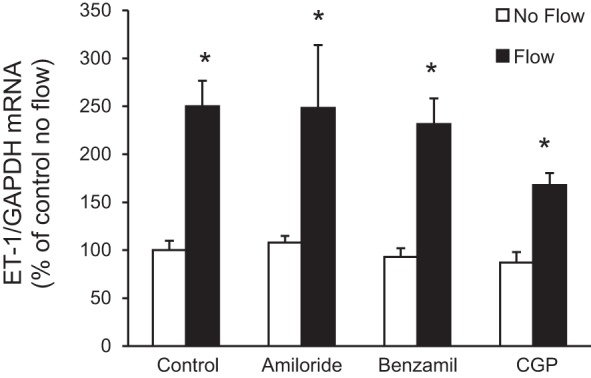
Effect of epithelial Na+ channel or mitochondrial Na+/Ca2+ exchanger inhibition on flow-stimulated ET-1 mRNA levels in IMCD3 cells. Cells were pretreated for 30 min with either 1 μM amiloride, 0.2 μM benzamil, or 1.2 μM CGP-37157 (CGP; mitochondrial Na+/Ca2+ exchanger inhibitor) and exposed to static or flow (2 h at 2 dyn/cm2) conditions followed by the determination of ET-1/GAPDH mRNA levels. n = 12 for each data point. *P < 0.05 vs. cells treated identically but not exposed to flow.
DISCUSSION
The present study reports that flow increases ET-1 mRNA in IMCD cells and that this response is dependent on 1) extracellular and intracellular Ca2+, 2) CaM/CaMK/calcineurin and PLC/PKC pathways, 3) polycystin-2, and 4) activation of purinergic P2Y2 and P2X7 receptors. While these experiments were largely conducted in vitro, they raise a number of intriguing, albeit speculative, possibilities. First, they provide a possible explanation for how BFV expansion, at least in part, induces a natriuretic and diuretic response in the CD independent of circulating hormones: increased tubule fluid flow, by virtue of increased IMCD ET-1 production, could lead to autocrine inhibition of IMCD Na+ and water transport. Second, these experiments describe, for the first time, polycystin-2 regulation of ET-1 production. Such a relationship may be relevant to renal salt and water excretion under normal physiological conditions as well as in the setting of impaired polycystin-2 function. The latter possibility is of particular interest given that hypertension commonly manifests in patients with polycystic kidney disease before apparent renal functional deterioration (10, 18). Third, the present study reports an interaction between CD purinergic and ET systems. Given that the CD purinergic system elicits rapid and transient inhibition (in minutes) (54), whereas the CD ET system causes delayed and sustained inhibition (in hours), of Na+ and water transport, these findings suggest the presence of a temporally integrated regulatory system in the CD that provides both rapid onset and sustained inhibition of natriuresis and diuresis in response to BFV expansion. Taken together, our findings identify a novel system in the IMCD wherein flow, via polycystin-2 and purinergic receptor activation, activates Ca2+ signaling pathways that stimulate the production of ET-1, a highly potent and long-acting inhibitor of CD Na+ and water reabsorption.
Other key observations in the present study were that flow stimulation of IMCD ET-1 mRNA did not depend on ENaC or mitochondrial NCLX. These findings are in contrast to those observed in mpkCCD cells, a mouse CCD cell line, wherein flow-stimulated ET-1 mRNA accumulation was prevented by blockade of ENaC or NCLX (36). Both mpkCCDc14 and IMCD3 cells express ENaC and exhibit amiloride inhibition of apical-to-basal Na+ flux by amiloride (40); hence, the lack of ENaC dependence in IMCD3 is not due to absence of ENaC. However, given that the CCD contains substantially more ENaC than the IMCD (46), it is tempting to speculate that CCD ET-1 production is primarily dependent on Na+ delivery, whereas IMCD ET-1 production is primarily regulated by fluid flow (which would be increased during both salt and water loading). In such a scenario, one could envision CCD- and IMCD-derived ET-1 serving different biological roles, wherein the former is primarily intended to respond to salt loads, whereas the latter is primarily intended to respond to volume loads. In this regard, it is notable that in vivo IMCD ET-1 mRNA accumulation was stimulated by both salt and water loading (it is problematic to assess CCD ET-1 mRNA levels in response to changes in salt or water intake since accurate quantification of ET-1 mRNA content in the CCD is very difficult due to the inability to isolate sufficient numbers of cells or tubules).
The present study reports that Ca2+ is essential for the ET-1 flow response in IMCD3 cells. These findings are in agreement with a previous study (28) showing that flow-stimulated ET-1 mRNA in mpkCCD cells is dependent on intracellular and extracellular Ca2+. In addition, ET-1 production by primary cultured rat IMCD cells under nonflow (stationary) conditions was Ca2+ dependent (48). We also found that the ET-1 flow response is mediated by PLC and PKC; similar findings have been observed in flow-stimulated mpkCCD cells (28) and endothelial cells (48) as well as in stationary rat IMCD cells (48). Notably, PKC regulates ET-1 gene transcription in rat IMCD cells via a nonclassical activator protein-1-like site in the ET-1 promoter (49). Finally, the ET-1 flow response in IMCD3 cells was dependent on CaM, CaMK, and calcineurin, in agreement with a previous study (48) showing a dependence of ET-1 production on these enzymes in stationary cultures of rat IMCD cells. In contrast, the ET-1 flow response in mpkCCD cells was not dependent on CaM-regulated pathways (28), suggesting a difference not only in the initial sensing component between the CCD and IMCD but also the Ca2+ signaling pathways involved. Taken together, the results of the present study indicate that Ca2+/CaM/CaMK/calcineurin- and PLC/PKC-dependent pathways are required for flow-stimulated ET-1 mRNA accumulation in the IMCD.
Since extracellular Ca2+ is required for the ET-1 flow response in IMCD, we sought to do limited analysis that identify pathways potentially involved in flow-stimulated Ca2+ entry. The IMCD contains several flow-regulated apical plasma membrane Ca2+ channels, including TRPC3 (14), TRPC6 (16), and TRPV4 (21, 57); however, blockade of these channels did not alter the ET-1 flow response. We cannot exclude that these TRP channels are involved in vivo since our in vitro system may not have normal apical membrane expression of these channels. In contrast, knockdown of polycystin-2, a Ca2+-permeable cation channel (35), completely prevented the ET-1 flow response. Our findings indicate that additional studies would be important to evaluate the role of polycystin-2 in mediating the ET-1 flow response. In addition to examination of such fundamental mechanisms, our finding raises interesting possibilities, as stated earlier, about the early hypertension seen in polycystic kidney disease. The cause for this early hypertension has been related to cyst compression of normal renal structures and activation of the intrarenal renin-angiotensin system (33). However, a recent study (9) found that hypertension was present in a mouse model of Pkd1 deficiency when only minimal renal cysts were present. Notably, while renal ET-1 production is increased in cystic kidney disease after significant renal damage has occurred, there is no information on renal or CD ET-1 production in kidneys without functional polycystin-2 but before cysts form. Such studies are clearly an important area for further investigation.
Another mechanism by which Ca2+ could enter cells in response to flow is via purinergic-gated P2X receptors. P2X receptors are expressed on IMCD cells in vivo (52); we found that IMCD3 cells express all known P2X isoform mRNA and possibly several of the proteins. Blockade of P2X7, but not P2X1, P2X3, or P2X4, receptors prevented the ET-1 flow response. Blockade of P2X7 receptors reduces ATP modulation of salt and water transport in pronephric ducts (20, 22). Since P2Y receptors have been reported to interact with P2X receptors in elevating [Ca2+]i levels (25), the role of P2Y receptors in modifying the ET-1 flow response was investigated. IMCD3 cells express mRNA for P2Y1, P2Y2, P2Y4, P2Y6, and P2Y13, a pattern similar to that seen in IMCD cells in vivo (52). Of these P2Y receptors, the P2Y2 receptor has been most extensively studied in the nephron. P2Y2 receptor activation elicits an inhibitory effect on CD Na+ and water reabsorption (37, 38, 41), whereas P2Y2 receptor knockout mice have reduced flow-stimulated increases in [Ca2+]i (25). Blockade of P2Y2 receptors prevented the ET-1 flow response in IMCD3 cells, suggesting that both P2X7 and P2Y2 receptors are involved. How such an interaction occurs will require further analysis, including determination of their individual and combined effects on specific signaling pathways (e.g., does PLC dependence reflect a P2Y2 effect as opposed to P2X7 and which other pathways are involved).
The present study has some limitations. Because cells detached at the 4-h time point when exposed to flow, and because we did not observe a graded flow response, it is not possible to fully investigate mechanisms that may be involved in the flow regulation of ET-1 in these cells. In addition, this study was not designed to examine if and how polycystin-2 and P2 receptors interact to modify the ET-1 flow response in IMCD3 cells. We did not specifically test alterations in P2X7 or P2Y2 receptor expression in Pkd2-knockdown cells, ATP release in Pkd2 knockdown cells, or whether P2 receptors colocalize with polycystin-2; however, these and other more indepth analyses of polycystin/purinergic system interactions in the context of regulated IMCD ET-1 are clearly warranted.
In summary, the present study mades several novel and potentially important observations. First, we demonstrated that polycystin-2 is necessary for flow-stimulated ET-1 synthesis in IMCD3 cells. Second, we reported that P2X7 and P2Y2 receptors are required for the flow response and that their activity depended on polycystin-2. Third, these systems ultimately modulate Ca2+-dependent signaling pathways. While further studies are needed to validate this proposed system in vivo, we speculate that the polycystin-2/P2 receptor/ET-1 system constitutes a complex interactive pathway through which the CD can detect tubule fluid flow and ultimately achieve both immediate and sustained regulation of CD salt and water reabsorption. This system may be of physiological relevance and has at least the theoretical potential to be involved in hypertensive states characterized by impaired CD polycystin-2, purinergic, or ET system dysfunction.
GRANTS
This work was supported in part by National Institutes of Health (NIH) Grants P01-HL-095499 (to D. E. Kohan and E. W. Inscho), Veterans Affairs Merit Reviews (to R. Rohatgi and to B. Kishore), and NIH Grants DK-044628 and HL-098135 (to E.W. Inscho).
DISCLOSURES
No conflicts of interest, financial or otherwise, are declared by the author(s).
AUTHOR CONTRIBUTIONS
Author contributions: M.M.P., E.W.I., R.R., L.G., B.K.K., and D.E.K. conception and design of research; M.M.P., E.W.I., S.Z., and T.S. performed experiments; M.M.P., E.W.I., S.Z., T.S., B.K.K., and D.E.K. analyzed data; M.M.P., E.W.I., S.Z., T.S., R.R., L.G., B.K.K., and D.E.K. interpreted results of experiments; M.M.P., E.W.I., S.Z., T.S., and D.E.K. prepared figures; M.M.P. and D.E.K. drafted manuscript; M.M.P., E.W.I., S.Z., T.S., R.R., L.G., B.K.K., and D.E.K. edited and revised manuscript; M.M.P., E.W.I., S.Z., T.S., R.R., L.G., B.K.K., and D.E.K. approved final version of manuscript.
ACKNOWLEDGMENTS
The authors thank Prof. Dr. Christa E. Müller (Pharmaceutical Institute, University of Bonn, Bonn, Germany) for kindly providing ARC-118925.
REFERENCES
- 1.Abassi ZA, Klein H, Golomb E, Keiser HR. Regulation of the urinary excretion of endothelin in the rat. Am J Hypertens 6: 453–457, 1993. [DOI] [PubMed] [Google Scholar]
- 2.Ahn D, Ge Y, Stricklett PK, Gill P, Taylor D, Hughes AK, Yanagisawa M, Miller L, Nelson RD, Kohan DE. Collecting duct-specific knockout of endothelin-1 causes hypertension and sodium retention. J Clin Invest 114: 504–511, 2004. [DOI] [PMC free article] [PubMed] [Google Scholar]
- 3.Ando J, Komatsuda T, Kamiya A. Cytoplasmic calcium response to fluid shear stress in cultured vascular endothelial cells. In Vitro Cell Dev Biol 24: 871–877, 1988. [DOI] [PubMed] [Google Scholar]
- 4.Barton M, Kohan DE. Endothelin antagonists in clinical trials: lessons learned. Contrib Nephrol 172: 255–260, 2011. [DOI] [PubMed] [Google Scholar]
- 5.Bugaj V, Pochynyuk O, Mironova E, Vandewalle A, Medina JL, Stockand JD. Regulation of the epithelial Na+ channel by endothelin-1 in rat collecting duct. Am J Physiol Renal Physiol 295: F1063–F1070, 2008. [DOI] [PMC free article] [PubMed] [Google Scholar]
- 6.Chu T, Wu MS, Hsieh BS. Urinary endothelin-1 in patients with renal disease. J Formos Med Assoc 97: 667–672, 1998. [PubMed] [Google Scholar]
- 7.Cuzzola F, Mallamaci F, Tripepi G, Parlongo S, Cutrupi S, Cataliotti A, Stancanelli B, Malatino LS, Bellanuova I, Ferri C, Galletti F, Filigheddu F, Glorioso N, Strazzullo P, Zoccali C. Urinary adrenomedullin is related to ET-1 and salt intake in patients with mild essential hypertension. Am J Hypertens 14: 224–230, 2001. [DOI] [PubMed] [Google Scholar]
- 8.Flores D, Battini L, Gusella GL, Rohatgi R. Fluid shear stress induces renal epithelial gene expression through polycystin-2-dependent trafficking of extracellular regulated kinase. Nephron Physiol 117: p27–p36, 2011. [DOI] [PMC free article] [PubMed] [Google Scholar]
- 9.Fonseca JM, Bastos AP, Amaral AG, Sousa MF, Souza LE, Malheiros DM, Piontek K, Irigoyen MC, Watnick TJ, Onuchic LF. Renal cyst growth is the main determinant for hypertension and concentrating deficit in Pkd1-deficient mice. Kidney Int 85: 1137–1150, 2014. [DOI] [PMC free article] [PubMed] [Google Scholar]
- 10.Gabow PA, Chapman AB, Johnson AM, Tangel DJ, Duley IT, Kaehny WD, Manco-Johnson M, Schrier RW. Renal structure and hypertension in autosomal dominant polycystic kidney disease. Kidney Int 38: 1177–1180, 1990. [DOI] [PubMed] [Google Scholar]
- 11.Ge Y, Ahn D, Stricklett PK, Hughes AK, Yanagisawa M, Verbalis JG, Kohan DE. Collecting duct-specific knockout of endothelin-1 alters vasopressin regulation of urine osmolality. Am J Physiol Renal Physiol 288: F912–F920, 2005. [DOI] [PubMed] [Google Scholar]
- 12.Ge Y, Bagnall A, Stricklett PK, Webb D, Kotelevtsev Y, Kohan DE. Combined knockout of collecting duct endothelin A and B receptors causes hypertension and sodium retention. Am J Physiol Renal Physiol 295: F1635–F1640, 2008. [DOI] [PMC free article] [PubMed] [Google Scholar]
- 13.Ge Y, Huang Y, Kohan DE. Role of the renin-angiotensin-aldosterone system in collecting duct-derived endothelin-1 regulation of blood pressure. Can J Physiol Pharmacol 86: 329–336, 2008. [DOI] [PubMed] [Google Scholar]
- 14.Goel M, Schilling WP. Role of TRPC3 channels in ATP-induced Ca2+ signaling in principal cells of the inner medullary collecting duct. Am J Physiol Renal Physiol 299: F225–F233, 2010. [DOI] [PMC free article] [PubMed] [Google Scholar]
- 15.Goel M, Sinkins WG, Zuo CD, Estacion M, Schilling WP. Identification and localization of TRPC channels in the rat kidney. Am J Physiol Renal Physiol 290: F1241–F1252, 2006. [DOI] [PubMed] [Google Scholar]
- 16.Goel M, Zuo CD, Schilling WP. Role of cAMP/PKA signaling cascade in vasopressin-induced trafficking of TRPC3 channels in principal cells of the collecting duct. Am J Physiol Renal Physiol 298: F988–F996, 2010. [DOI] [PMC free article] [PubMed] [Google Scholar]
- 17.Gumz ML, Popp MP, Wingo CS, Cain BD. Early transcriptional effects of aldosterone in a mouse inner medullary collecting duct cell line. Am J Physiol Renal Physiol 285: F664–F673, 2003. [DOI] [PubMed] [Google Scholar]
- 18.Harris PC, Torres VE. Polycystic kidney disease. Annu Rev Med 60: 321–337, 2009. [DOI] [PMC free article] [PubMed] [Google Scholar]
- 19.Herrera M, Garvin J. A high-salt diet stimulates thick ascending limb eNOS expression by raising medullary osmolality and increasing release of endothelin-1. Am J Physiol Renal Physiol 288: F58–F64, 2005. [DOI] [PubMed] [Google Scholar]
- 20.Hillman KA, Burnstock G, Unwin RJ. The P2X7 ATP receptor in the kidney: a matter of life or death? Nephron Exp Nephrol 101: e24–e30, 2005. [DOI] [PubMed] [Google Scholar]
- 21.Hills CE, Bland R, Squires PE. Functional expression of TRPV4 channels in human collecting duct cells: implications for secondary hypertension in diabetic nephropathy. Exp Diabetes Res 2012: 936518, 2012. [DOI] [PMC free article] [PubMed] [Google Scholar]
- 22.Hovater MB, Olteanu D, Welty EA, Schwiebert EM. Purinergic signaling in the lumen of a normal nephron and in remodeled PKD encapsulated cysts. Purinergic Signal 4: 109–124, 2008. [DOI] [PMC free article] [PubMed] [Google Scholar]
- 23.Hwang YS, Hsieh TJ, Lee YJ, Tsai JH. Circadian rhythm of urinary endothelin-1 excretion in mild hypertensive patients. Am J Hypertens 11: 1344–1351, 1998. [DOI] [PubMed] [Google Scholar]
- 24.Inoue T, Nonoguchi H, Tomita K. Physiological effects of vasopressin and atrial natriuretic peptide in the collecting duct. Cardiovasc Res 51: 470–480, 2001. [DOI] [PubMed] [Google Scholar]
- 25.Jensen ME, Odgaard E, Christensen MH, Praetorius HA, Leipziger J. Flow-induced [Ca2+]i increase depends on nucleotide release and subsequent purinergic signaling in the intact nephron. J Am Soc Nephrol 18: 2062–2070, 2007. [DOI] [PubMed] [Google Scholar]
- 26.Kohan DE, Padilla E. Osmolar regulation of endothelin-1 production by rat inner medullary collecting duct. J Clin Invest 91: 1235–1240, 1993. [DOI] [PMC free article] [PubMed] [Google Scholar]
- 27.Kohan DE, Rossi NF, Inscho EW, Pollock DM. Regulation of blood pressure and salt homeostasis by endothelin. Physiol Rev 91: 1–77, 2011. [DOI] [PMC free article] [PubMed] [Google Scholar]
- 28.Lyon-Roberts B, Strait KA, van Peursem E, Kittikulsuth W, Pollock JS, Pollock DM, Kohan DE. Flow regulation of collecting duct endothelin-1 production. Am J Physiol Renal Physiol 300: F650–F656, 2011. [DOI] [PMC free article] [PubMed] [Google Scholar]
- 29.Malatino LS, Bellanuova I, Cataliotti A, Cuzzola F, Mallamaci F, Tripepi G, Parlongo S, Cutrupi S, Mangiafico RA, Ferri C, Galletti F, Gloriso N, Strazzullo P, Zoccali C. Renal endothelin-1 is linked to changes in urinary salt and volume in essential hypertension. J Nephrol 13: 178–184, 2000. [PubMed] [Google Scholar]
- 30.Mann JF, Green D, Jamerson K, Ruilope LM, Kuranoff SJ, Littke T, Viberti G. Avosentan for overt diabetic nephropathy. J Am Soc Nephrol 21: 527–535, 2010. [DOI] [PMC free article] [PubMed] [Google Scholar]
- 31.Mawji IA, Marsden PA. Perturbations in paracrine control of the circulation: role of the endothelial-derived vasomediators, endothelin-1 and nitric oxide. Microsc Res Tech 60: 46–58, 2003. [DOI] [PubMed] [Google Scholar]
- 32.Mawji IA, Robb GB, Tai SC, Marsden PA. Role of the 3′-untranslated region of human endothelin-1 in vascular endothelial cells. Contribution to transcript lability and the cellular heat shock response. J Biol Chem 279: 8655–8667, 2004. [DOI] [PubMed] [Google Scholar]
- 33.McPherson EA, Luo Z, Brown RA, LeBard LS, Corless CC, Speth RC, Bagby SP. Chymase-like angiotensin II-generating activity in end-stage human autosomal dominant polycystic kidney disease. J Am Soc Nephrol 15: 493–500, 2004. [DOI] [PubMed] [Google Scholar]
- 34.Modesti PA, Cecioni I, Costoli A, Poggesi L, Galanti G, Serneri GG. Renal endothelin in heart failure and its relation to sodium excretion. Am Heart J 140: 617–622, 2000. [DOI] [PubMed] [Google Scholar]
- 35.Nauli S, Alenghat F, Luo Y, Williams E, Vassilev P, Li X, Elia A, Lu W, Brown E, Quinn S, Ingber D, Zhou J. Polycystins 1 and 2 mediate mechanosensation in the primar cilium of kidney cells. Nat Genet 33: 129–137, 2003. [DOI] [PubMed] [Google Scholar]
- 36.Pandit MM, Strait KA, Matsuda T, Kohan DE. Na delivery and ENaC mediate flow regulation of collecting duct endothelin-1 production. Am J Physiol Renal Physiol 302: F1325–F1330, 2012. [DOI] [PMC free article] [PubMed] [Google Scholar]
- 37.Pochynyuk O, Bugaj V, Rieg T, Insel PA, Mironova E, Vallon V, Stockand JD. Paracrine regulation of the epithelial Na+ channel in the mammalian collecting duct by purinergic P2Y2 receptor tone. J Biol Chem 283: 36599–36607, 2008. [DOI] [PMC free article] [PubMed] [Google Scholar]
- 38.Pochynyuk O, Rieg T, Bugaj V, Schroth J, Fridman A, Boss GR, Insel PA, Stockand JD, Vallon V. Dietary Na+ inhibits the open probability of the epithelial sodium channel in the kidney by enhancing apical P2Y2-receptor tone. FASEB J 24: 2056–2065, 2010. [DOI] [PMC free article] [PubMed] [Google Scholar]
- 39.Praetorius H, Spring K. The renal cell primary cilium functions as a flow sensor. Curr Opin Nephrol Hypertens 12: 517–520, 2003. [DOI] [PubMed] [Google Scholar]
- 40.Rauchman MI, Nigam SK, Delpire E, Gullans SR. An osmotically tolerant inner medullary collecting duct cell line from an SV40 transgenic mouse. Am J Physiol Renal Fluid Electrolyte Physiol 265: F416–F424, 1993. [DOI] [PubMed] [Google Scholar]
- 41.Rieg T, Bundey RA, Chen Y, Deschenes G, Junger W, Insel PA, Vallon V. Mice lacking P2Y2 receptors have salt-resistant hypertension and facilitated renal Na+ and water reabsorption. FASEB J 21: 3717–3726, 2007. [DOI] [PubMed] [Google Scholar]
- 42.Rivera I, Zhang S, Fuller BS, Edwards B, Seki T, Wang MH, Marrero MB, Inscho EW. P2 receptor regulation of [Ca2+]i in cultured mouse mesangial cells. Am J Physiol Renal Physiol 292: F1380–F1389, 2007. [DOI] [PubMed] [Google Scholar]
- 43.Rohatgi R, Battini L, Kim P, Israeli S, Wilson PD, Gusella GL, Satlin LM. Mechanoregulation of intracellular Ca2+ in human autosomal recessive polycystic kidney disease cyst-lining renal epithelial cells. Am J Physiol Renal Physiol 294: F890–F899, 2008. [DOI] [PubMed] [Google Scholar]
- 44.Sands JM, Nonoguchi H, Knepper MA. Hormone effects on NaCl permeability of rat inner medullary collecting duct. Am J Physiol Renal Fluid Electrolyte Physiol 255: F421–F428, 1988. [DOI] [PubMed] [Google Scholar]
- 45.Schwarz G, Callewaert G, Droogmans G, Nilius B. Shear stress-induced calcium transients in endothelial cells from human umbilical cord veins. J Physiol 458: 527–538, 1992. [DOI] [PMC free article] [PubMed] [Google Scholar]
- 46.Stokes JB. Physiologic resistance to the action of aldosterone. Kidney Int 57: 1319–1323, 2000. [DOI] [PubMed] [Google Scholar]
- 47.Strait KA, Stricklett PK, Kohan DE. Altered collecting duct adenylyl cyclase content in collecting duct endothelin-1 knockout mice. BMC Nephrol 8: 8, 2007. [DOI] [PMC free article] [PubMed] [Google Scholar]
- 48.Strait KA, Stricklett PK, Kohan JL, Miller MB, Kohan DE. Calcium regulation of endothelin-1 synthesis in rat inner medullary collecting duct. Am J Physiol Renal Physiol 293: F601–F606, 2007. [DOI] [PubMed] [Google Scholar]
- 49.Stricklett PK, Strait KA, Kohan DE. Novel regulation of endothelin-1 promoter activity by protein kinase C. Cell Biochem Biophys 61: 643–650, 2011. [DOI] [PubMed] [Google Scholar]
- 50.Stuart D, Chapman M, Rees S, Woodward SK, Kohan DE. Myocardial, smooth muscle, nephron and collecting duct gene targeting reveals the organ sites of endothelin A receptor antagonist fluid retention. J Pharmacol Exp Ther 346: 182–189, 2013. [DOI] [PubMed] [Google Scholar]
- 51.Tomita K, Nonguchi H, Terada Y, Marumo F. Effects of ET-1 on water and chloride transport in cortical collecting ducts of the rat. Am J Physiol Renal Fluid Electrolyte Physiol 264: F690–F696, 1993. [DOI] [PubMed] [Google Scholar]
- 52.Unwin RJ, Bailey MA, Burnstock G. Purinergic signaling along the renal tubule: the current state of play. News Physiol Sci 18: 237–241, 2003. [DOI] [PubMed] [Google Scholar]
- 53.Wendel M, Knels L, Kummer W, Koch T. Distribution of endothelin receptor subtypes ETA and ETB in the rat kidney. J Histochem Cytochem 54: 1193–1203, 2006. [DOI] [PubMed] [Google Scholar]
- 54.Wildman SS, Marks J, Turner CM, Yew-Booth L, Peppiatt-Wildman CM, King BF, Shirley DG, Wang W, Unwin RJ. Sodium-dependent regulation of renal amiloride-sensitive currents by apical P2 receptors. J Am Soc Nephrol 19: 731–742, 2008. [DOI] [PMC free article] [PubMed] [Google Scholar]
- 55.Wu LJ, Sweet TB, Clapham DE. International Union of Basic and Clinical Pharmacology. LXXVI. Current progress in the mammalian TRP ion channel family. Pharmacol Rev 62: 381–404, 2010. [DOI] [PMC free article] [PubMed] [Google Scholar]
- 56.Zeiler M, Löffler BM, Bock HA, Thiel G, Basel K. Water diuresis increases endothelin-1 excretion in humans. J Am Soc Nephrol 6: 751, 1995. [Google Scholar]
- 57.Zhang ZR, Chu WF, Song B, Gooz M, Zhang JN, Yu CJ, Jiang S, Baldys A, Gooz P, Steele S, Owsianik G, Nilius B, Komlosi P, Bell PD. TRPP2 and TRPV4 form an EGF-activated calcium permeable channel at the apical membrane of renal collecting duct cells. PLos One 8: e73424, 2013. [DOI] [PMC free article] [PubMed] [Google Scholar]


