Abstract
Background:
To shorten the time required to bring new treatments to clinics, recent efforts have focused on repurposing existing Food and Drug Administration (FDA)-approved drugs with established safety data for new indications. We hypothesized that adverse effect profiles might aid in prioritizing compounds for investigation in central nervous system (CNS) applications by providing an indication of their abilities to cross the blood-brain barrier.
Methods:
Data were drawn from an investigation of similarity of adverse effect profiles, utilizing pre- and post-marketing data. A panel of known CNS-active drugs was utilized to estimate aggregate similarity profiles for all other FDA drugs in the database. Permutations were used to test whether similarities for any given drug exceeded that expected under the null hypothesis. To estimate the performance of algorithms using such profiles, manually-curated lists of known CNS-active and -inactive medications were classified using logistic regression. Algorithms with and without this similarity data were compared for prediction of CNS penetrance.
Results:
Models incorporating adverse effect similarity data exhibited greater discrimination of brain-penetrant and non-penetrant drugs than models without this data. A visualization tool was developed to allow any medication to be evaluated for adverse effect similarity to the CNS panel or a custom panel.
Conclusions:
Consideration of adverse effect profiles allows in silico prioritization of compounds for follow-up investigation for CNS indications. In concert with chemical screening approaches, this may accelerate repurposing efforts for putative CNS-active medications.
Keywords: adverse effects, bioinformatics, chemical screening, drug discovery, repurposing
Background
Developing a drug from first-in-human studies to Food and Drug Administration (FDA) approval is a lengthy and costly process (Kaitin, 2010). In an effort to streamline therapeutic development, recent efforts have sought to repurpose clinically-available drugs by detecting heretofore unrecognized or off-target effects. Psychiatry is replete with examples of such repurposing, such as the application of anticonvulsants to treat bipolar disorder or antihistamines for psychosis. Unlike development of novel agents, repurposed agents are already vetted for safety and tolerability and often have significant prescriber experience and postmarketing safety data. However, this inversion of the therapeutic pipeline, finding a disease for a drug instead of a drug for a disease, presents new scientific challenges and opportunities.
Progress in chemical screening programs allows rapid screening of large libraries of compounds acting on a specific target (Haggarty and Perlis, 2013). While this capacity to screen compounds for specific activities has proven highly scalable, it has been difficult to create low-cost and high-throughput approaches to reliably estimate brain penetrance. Central nervous system (CNS) availability is an obvious but critical next step in the development of CNS-active drugs. While rodent model systems allow pharmacokinetic estimates of blood-brain-barrier permeability, they are imperfect models of human pharmacokinetics and are relatively costly (Bauer et al., 2012). Alternatively, sophisticated in silico models have been developed to predict brain penetration on the basis of physical properties such as molecular weight and lipophilicity, but such models are also limited and may not be accessible to clinical investigators (Bergstrom et al., 2012; Suenderhauf et al., 2012).
Given the desirability of repurposing and difficulty of modeling human pharmacokinetics, side effect profiles may represent in vivo bioassays of drug targets. A 2008 report illustrated that compounds with similar adverse effect profiles may target similar pathways in vivo (Campillos et al., 2008), and that a pathway similarity conveys data not fully captured by similarity of chemical structure or drug indication. This approach has also been utilized successfully to predict postmarketing adverse effects (Tatonetti et al., 2012). The present study builds on this work, using adverse effect profile similarities to develop a predictor of brain penetration, rather than drug target per se, for FDA-approved compounds. The performance of the tool was compared to models relying solely on physical properties, using a curated list of compounds known to be brain-penetrant or -impenetrant. Finally, a web-based tool was created to allow clinical investigators to readily access this predictor and investigate prototypical as well as custom-designed sets of drug comparators.
Methods
A straightforward methodology for generating side effect profile similarity scores was initially described by Campillos and colleagues (2008). Using a similar approach, Tatonetti and colleagues (2012) derived similarity scores (http://people.dbmi.columbia.edu/tatonetti/resources.html, accessed 7/23/2013) based on both FDA labels and postmarketing reports; the latter often detects adverse effects not initially noted in randomized trials.
A panel of prototypical CNS-penetrant agents was selected manually by the authors to represent a broad range of medication types within and across classes; this included the antidepressants fluoxetine, nortriptyline, and mirtazapine, as well as the antipsychotics olanzapine, risperidone, and haloperidol. For any given drug, the similarity score was estimated as the mean similarity z-score for the comparator drugs, then re-scaled to yield a z-score for that comparator group. Where a drug is included in the comparator panel, its z-score is estimated from the other drugs.
Physical property data for each compound was downloaded from the online database PubChem (http://pubchem.ncbi.nlm.nih.gov/, accessed 10/12/2013), including molecular weight and LogP. The latter is a standard estimate of lipophilicity, which has been shown to correlate with blood-brain barrier penetration (Suenderhauf et al., 2012).
To benchmark the models created here, a curated list of known brain-penetrant and non-penetrant drugs was drawn from a larger list of molecules previously described (Martins et al., 2012). The total list included 108 brain-penetrant and 56 non-penetrant drugs for which pairwise similarity data was available. This list was also used to generate comparison panels to the 6-drug curated panel, by randomly selecting 6 brain-penetrant medications.
First, the mean similarity scores were compared between the known-penetrant and impenetrant drugs using student’s t-tests. To estimate the improvement in discrimination when adverse effect-based measures were added to existing (physical property-based) measures, nested logistic regression models were fitted both with and without similarity measures. Model discrimination was estimated and compared in terms of the area under the receiver operating characteristic curve (AUC). In light of the limitations of the AUC for comparing model improvement, we also estimated the net reclassification improvement (Pencina et al., 2008) using the incrisk command (Longton and Pepe, 2014).
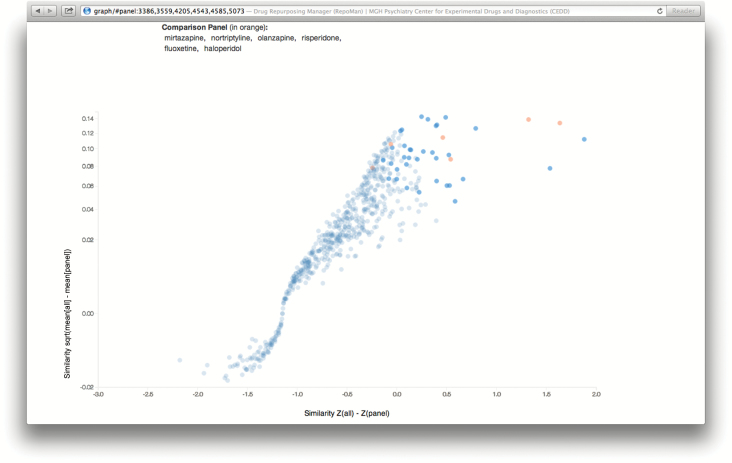
Finally, a web-based calculator and visualization tool was developed that implements the approach described here. The calculator accepts a panel for comparison and screens the remaining drugs for similarity to this panel. The output is a scatterplot showing the difference of a drug’s mean similarity to all other drugs and mean similarity to the panel drugs versus difference between mean z-score of panel drugs within each drug and across all drugs. This provides readily-differentiated groups of agents more and less similar to the comparator panel despite the highly-variable similarities (e.g. some drugs are similar to most drugs whereas others appear nearly unique by side effects). Additionally, an upper bound on p -value is reported by means of comparison between randomly permuted panels and the user supplied or selected panel.
Results
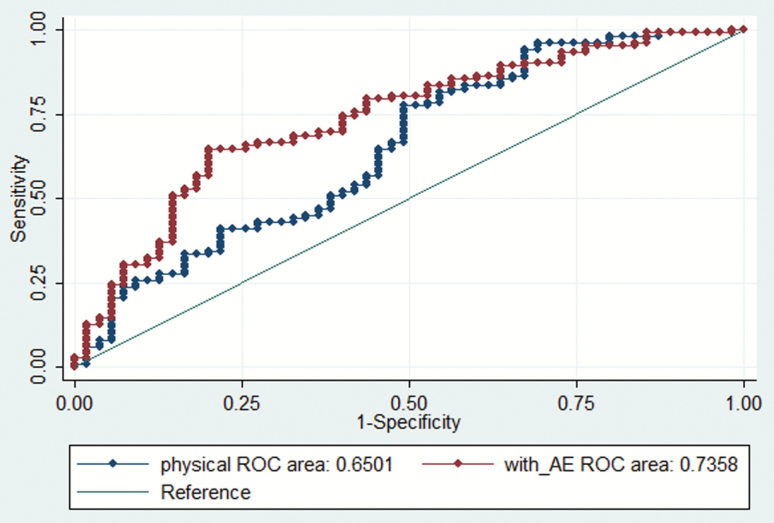
A total of 632 drugs were examined for similarity to the antidepressant + antipsychotic panel. Mean similarity to the panel was 0.78 (standard deviation 0.51) for the known brain-penetrant drugs (excluding the drugs in the panel) and 0.50 (standard deviation 0.40) for the known non-penetrant drugs; t = -3.50, p < 0.001. Two nested logistic regression models were compared: one including molecular weight and LogP alone, and the other added similarity. Similarity remained significantly associated with CNS penetration in the adjusted model (Table 1). Including the similarity score significantly improved the predictions, whether measured by model fit [likelihood ratio chi2(1df) = 9.79, p = 0.002], area under receiver operating characteristic (ROC) curve [Figure 1; 0.65 (standard error 0.05) versus 0.74 (standard error 0.04), ch2(1df) = 5.28, p = 0.02], or net reclassification improvement [0.55, 95% confidence interval 0.115–0.798]. Similar results were obtained when panels of randomly-selected brain penetrant comparator medications were utilized: for 10 randomly-selected panels, the mean area under ROC curve was 0.72 (standard error 0.04).
Table 1.
Prediction model for brain penetration, incorporating adverse-effect similarities.
| Odds Ratio | 95% Confidence Interval | p-value | ||
|---|---|---|---|---|
| Molecular weight | 0.994 | 0.990 | 0.998 | 0.004 |
| LogP | 1.246 | 1.006 | 1.543 | 0.044 |
| Similarity score | 3.346 | 1.491 | 7.509 | 0.003 |
Figure 1.
Receiver operating characteristic (ROC) curves for brain penetration models including physical features alone (physical ROC area) and physical features with adverse effect similarity (with_AE ROC area).
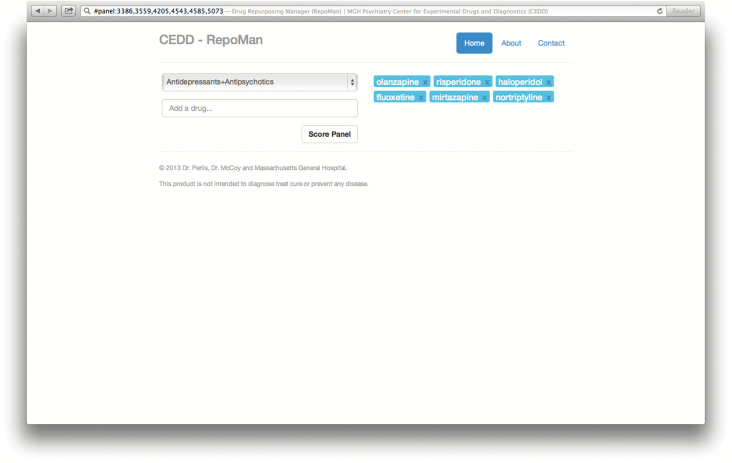
Figure 2 illustrates the input and output screens of the web-based calculator, available at http://repoman.mghcedd.org. After a comparator panel is selected, similarities are calculated for all medications; the resulting scatterplot of all medications, scored against the comparator panel, can be updated to depict various physical properties and similarity scores. The calculator allows use of standard reference panels, as well as custom panels entered by the user. The medications with the greatest similarities to the reference panel are also presented by decreasing similarity.
Figure 2.
(A and B) Screen illustrations of the web-based similarity calculator for brain penetration.
For example, with the 6-medication reference panel, nearly all of the most similar medications are known CNS-active medications. Among the non-CNS-indicated medications are gatifloxacin, an antibiotic subsequently withdrawn from the US market for other reasons, which was associated with emergence of psychosis (Reeves, 2003, 2007), and montelukast, which has been implicated as a potential contributor to pediatric psychiatric adverse events (Bygdell et al., 2012).
Discussion
These results indicate that the similarity between two or more drugs in an adverse-effect profile may be used to predict the likelihood that an FDA-approved medication crosses the blood-brain barrier. This bioassay captures properties of a drug not fully explained by traditional physical properties often used in in silico modeling (Bergstrom et al., 2012; Suenderhauf et al., 2012).
This work relies on previous reports (Campillos et al., 2008; Tatonetti et al., 2012) that described the methodology for deriving adverse effect profiles from pre- and postmarketing data, then utilized similarities between pairs to suggest common targets. While those studies noted the potential usefulness in repurposing compounds, they did not describe a specific method for applying and visualizing such data. The present study is an effort to facilitate investigation of drugs for repurposing by clinical researchers who may not have access to sophisticated in silico models or pharmacokinetic resources required to characterize brain penetration.
Several important limitations should be noted. First, by relying on adverse effects, this algorithm will yield results biased towards drugs with less clean adverse effect profiles. Thus, a perfect drug which acts in the brain but yields no brain-specific adverse effects will likely not be prioritized. (Such drugs are to be hoped for, but whether they exist is unclear.) Similarly, depending on the panel of drugs selected, it is possible that scores will point not only to brain penetration, but to mechanisms of action. So, for example, seeding with a single tricyclic antidepressant prioritizes other tricyclic antidepressants. To counter this tendency, the default panel investigated here draws on drugs from multiple classes and targets. Additionally, defining the visualization in terms of differences from panels and drugs means an element of nominal within-drug scaling is introduced.
Despite these limitations, the present report suggests that adverse effects represent a useful proxy for brain penetration, and further validates the general proposal in earlier reports that adverse effects may be used for repurposing. Furthermore the tool created suggests that research of this nature can be readily translated into forms that place minimal demands on potential downstream researchers. By combining intuitive data with rudimentary statistics in the form of a readily-accessible calculator, the intention is to encourage clinical investigators to consider repurposing drugs which may have off- or on-target effects useful for psychiatric indications.
Supplemental materials
Supplemental materials: website (http://repoman.mghcedd.org)
Statement of Interest
Dr Perlis is a member of scientific advisory boards or has received consulting fees from Genomind, Healthrageous, Pamlab, Perfect Health, Pfizer, Proteus Biomedical, and RIDVentures. He has received research support from Proteus Biomedical, and royalties from Concordant Rater Systems (now UBC).
Acknowledgments
Dr Perlis is supported by NIMH MH086026 and the Stanley Center for Psychiatric Research at the Broad Institute. Dr McCoy is a participant in NIMH 5R25MH094612.
References
- Bauer M, Zeitlinger M, Karch R, Matzneller P, Stanek J, Jager W, Bohmdorfer M, Wadsak W, Mitterhauser M, Bankstahl JP, Loscher W, Koepp M, Kuntner C, Muller M, Langer O. (2012). Pgp-mediated interaction between (R)-[11C]verapamil and tariquidar at the human blood-brain barrier: a comparison with rat data. Clin Pharmacol Ther 91:227–233. [DOI] [PMC free article] [PubMed] [Google Scholar]
- Bergstrom CA, Charman SA, Nicolazzo JA. (2012). Computational prediction of CNS drug exposure based on a novel in vivo dataset. Pharm Res 29:3131–3142. [DOI] [PubMed] [Google Scholar]
- Bygdell M, Brunlöf G, Wallerstedt SM, Kindblom JM. (2012). Psychiatric adverse drug reactions reported during a 10-year period in the Swedish pediatric population. Pharmacoepidemiol Drug Saf 21:79–86. [DOI] [PubMed] [Google Scholar]
- Campillos M, Kuhn M, Gavin AC, Jensen LJ, Bork P. (2008). Drug target identification using side-effect similarity. Science 321:263–266. [DOI] [PubMed] [Google Scholar]
- Haggarty SJ, Perlis RH. (2013). Translation: screening for novel therapeutics with disease-relevant cell types derived from human stem cell models. Biol Psych 275:952–960. [DOI] [PMC free article] [PubMed] [Google Scholar]
- Kaitin KI. (2010). Deconstructing the drug development process: the new face of innovation. Clin Pharmacol Ther 87:356–361. [DOI] [PMC free article] [PubMed] [Google Scholar]
- Longton G, Pepe M. (2014). Risk Prediction Package. http://research.fhcrc.org/diagnostic-biomarkers-center/en/software/ppsoft.html (accessed Oct 2014)
- Martins IF, Teixeira AL, Pinheiro L, Falcao AO. (2012). A Bayesian approach to in silico blood-brain barrier penetration modeling. J Chem Inf Model 52:1686–1697. [DOI] [PubMed] [Google Scholar]
- Pencina MJ, D’Agostino RB, Sr., D’Agostino RB, Jr., Vasan RS. (2008). Evaluating the added predictive ability of a new marker: from area under the ROC curve to reclassification and beyond. Stat Med 27:157–172. [DOI] [PubMed] [Google Scholar]
- Reeves R. (2003). Gatifloxacin precipitation of psychosis in Alzheimer disease. Am J Geriat Psychiatry 11:470–471. [PubMed] [Google Scholar]
- Reeves R. (2007). Exacerbation of psychotic symptoms associated with gatifloxacin. Psychosomatics 48:87. [DOI] [PubMed] [Google Scholar]
- Suenderhauf C, Hammann F, Huwyler J. (2012). Computational prediction of blood-brain barrier permeability using decision tree induction. Molecules 17:10429–10445. [DOI] [PMC free article] [PubMed] [Google Scholar]
- Tatonetti NP, Fernald GH, Altman RB. (2012). A novel signal detection algorithm for identifying hidden drug-drug interactions in adverse event reports. J Am Med Inform Assoc 19:79–85. [DOI] [PMC free article] [PubMed] [Google Scholar]


