Abstract
Multidrug regimens are a promising strategy for improving therapeutic efficacy and reducing side effects, especially for complex disorders such as cancer. However, the use of multidrug therapies is very challenging, due to a lack of understanding of the mechanisms of drug interactions. We herein present a novel computational approach—Drug-Induced Genomic Residual Effect (DIGRE) Computational Model—to predict drug combination effects by explicitly modeling drug response curves and gene expression changes after drug treatments. The prediction performance of DIGRE was evaluated using two datasets: (i) OCI-LY3 B-lymphoma cells treated with 14 different drugs and (ii) MCF breast cancer cells treated with combinations of gefitinib and docetaxel at different doses. In both datasets, the predicted drug combination effects significantly correlated with the experimental results. The results indicated the model was useful in predicting drug combination effects, which may greatly facilitate the discovery of new, effective multidrug therapies.
Within the past two decades, numerous studies have aimed to identify new drugs or compounds that modulate specific therapeutic targets.1–3 Multidrug therapies have been used successfully in clinical practice and have attracted tremendous interest as promising treatments for complex disorders, especially those with multifactorial pathogenic mechanisms.4 For example, the treatment combination of fluticasone and propionate provides better asthma control than increasing the dose of either single drug alone, while simultaneously reducing the frequency of exacerbations.5 Similarly, lovastatin combined with extended-release niacin was first introduced as an effective treatment for hyperlip-idemia.6 Furthermore, patients treated with a combination of cetuximab and platinum-based chemotherapy showed a significantly longer overall survival time than those administered chemotherapy alone.7 However, the underlying mechanisms of such drug combinations are vastly different from those of single drugs and thus remain poorly understood. Individual components can target different proteins in the same or different pathways, and complicated drug-drug interactions and complex biological environments make it difficult to propose effective new drug combinations. It is impractical to identify effective drug combinations by large-scale drug screening experiments, since the number of combinations increases exponentially with the number of screened drugs. Moreover, this task is made even more impractical by differing variations of drug ratio and timing. As a result, only a tiny fraction of all possible combinations can be experimentally tested, and of those only a handful of combinations have well-understood mechanisms elucidated from clinical experience.8–12
Due to these limitations, the development of computational methods for predicting drug combination effects is essential for a systematic identification of combinatorial treatment regimens. Recently, Zhao et al.13 introduced a model to predict the efficacies of drug combinations by integrating molecular and pharmacological data, but its dependence on feature patterns, specifically enriched in approved drug combinations, severely limited its potential application. Wu et al.14 similarly proposed a network-analysis-based model that utilized gene expression profiles, following individual treatments, to predict gene expression changes induced by drug combinations, which were then used to estimate the effectiveness of the combinations. However, such an approach ignores gene-gene interactions, which also play an essential role in gene regulation. Moreover, while the enhanced Petri-Net model15 (a method that provides informative insight into the mechanisms of drug actions) was established to recognize the synergism of drug combinations, that model is limited in application by its requirement of a gene expression profile for every drug pair.
In this study, we hypothesized that if two drugs were administrated sequentially, the first drug would alter the treated cells' transcriptome, and thus modulate the effect of the later drug. We developed this novel Drug-Induced Genomic Residual Effect (DIGRE) computational model to predict drug combination effects by explicitly modeling the drug response dynamics and gene expression changes after individual drug treatments. The DIGRE model won the best performance in the National Cancer Institute's “DREAM 7 Drug Combination Synergy Prediction Challenge,” an international crowdsourcing-based computational challenge for predicting drug combination effects using transcriptome data. This challenge's blind assessment of submitted computational models revealed that the prediction of drug pair activity from DIGRE was significantly consistent with the vast majority of the organizers' experimental validations. In addition, we further validated our DIGRE model using another experimental dataset.15 Consequently, DIGRE could potentially be used for large-scale discovery of effective drug combinations for further experimental validation, possibly leading to the rapid identification of new therapies for complex diseases.
RESULTS
The main hypothesis for DIGRE is that the transcriptomic residual effects induced by treatment with a previous drug(s) modulate the effect of a successively administered drug(s). For example, suppose a cell line is treated with compounds A and B sequentially. Compound A, beside its own drug effect, also alters the cell line's genomic context, which further modulates the cells' response to compound B. Therefore, it is important to estimate this residual effect, in order to predict the net effect of the drug combination. Figure 1 shows the overall flowchart of the DIGRE model (the entire workflow is also presented as pseudo-code in the Supplementary Data). The expression changes were first estimated from the gene expression profiles before and after treatment with each individual drug, and then the expression similarity between the two drugs was quantified. Next, the genomic residual effect of drug A on drug B was determined based on the two drugs' expression similarity. Finally, the drug combination effect was calculated from a mathematical model, using the residual effect (please see the Methods section for more details).
Figure 1.
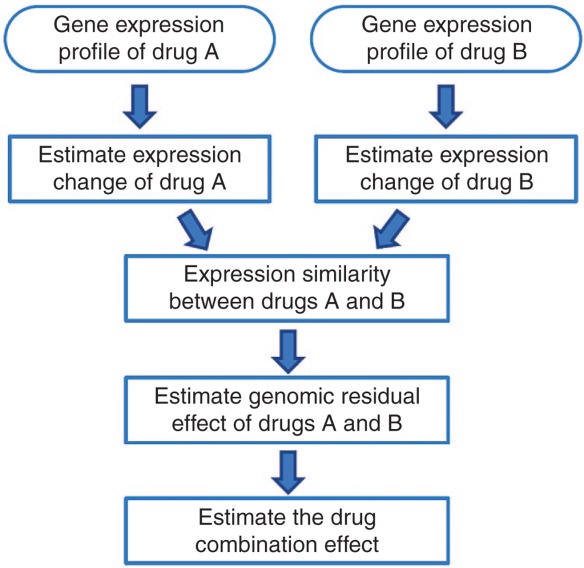
Overall flowchart of the Drug-Induced Genomic Residual Effect (DIGRE) model.
Application to predict 91 combinatorial drug effects on the B-cell lymphoma OCI-lY3 cell line
We first applied our model to the NCI DREAM Drug Combination Challenge dataset, in which OCI-LY3 B-lymphoma cells were treated with 14 drugs carefully selected to avoid overlapping mechanisms. The goal of the study was to predict the treatment effects of pairwise combination of these 14 drugs using genomic profiles before and after treatment with each individual drug. For each of the 14 single drug treatments, the drug response curve was determined at 48 h after treatment, and the concentration corresponding to each drug's IC20 (i.e., the drug concentration required to obtain a 20% reduction in cell viability) was used for each of the combined drugs. Gene expression profiles for the 14 single drug treatments were provided at three different time points (6, 12 and 24h), including dimethyl sulfoxide-treated control samples. The expression profiles of the treated samples for each drug were measured in triplicate, and the control samples were repeated eight times. The “gold standard” for comparing each drug's effectiveness was generated by the reduction in cell viability following treatment by the 91 distinct drug combinations. Finally, “Excess Over Bliss” (EOB) was calculated to define the syn-ergistic effects of drug combinations. For example, if x, y, and z are experimentally measured cell growth inhibition values induced by drugs A, B, and their combination, respectively, then the expected fractional inhibition c of the combination (assuming the two drugs work independently) is defined as c = 1 − (1 − x) (1 − y), and the EOB can be calculated by A = z − c. The larger the EOB, the more synergistic the combination of drugs A and B. Using EOB, drug pairs can be ranked from the most synergistic to the most antagonistic.
The predicted results were scored by probabilistic concordance indexes (PCIs), which quantified the concordance between the predicted ranks of the combinations and the gold standard, while also accounting for “noise” in the experimental data (see Methods section for details of determining the PCI score). The predictions from the DIGRE model significantly correlated with the observed gold standard (PCI: 0.614 and P value: 0.0004) (Figure 2). This correlation produced a PCI of 0.614 (Figure 3). To evaluate the robustness of the approach, one drug was systematically removed from the 14 chosen drugs, and the prediction scores were then reevaluated using the remaining 13 drugs. In this single drug removal study, the largest P value consistently remained less than 0.015 (PCI >0.59), thus validating the robustness of the model, with respect to perturbations by the selected drugs.
Figure 2.

Heatmap for predicted drug combination effects using the Drug-Induced Genomic Residual Effect (DIGRE) model. The predicted rank from the most synergistic pair to the most antagonistic pair is colored from red to blue, showing compound H-7 to have the most proclivity toward a synergistic combinatorial effect, consistent with the phenomenon observed in the gold standard.
Figure 3.
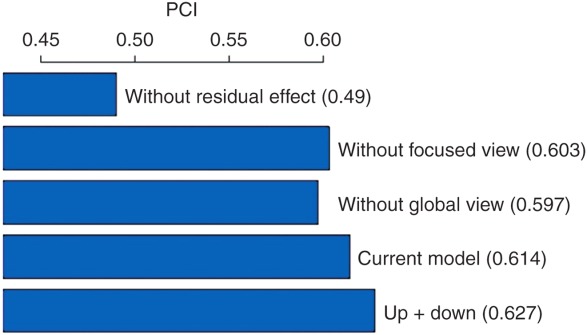
Performance comparisons among different model settings. PCI, probabilistic concordance index.
There are several key components to the DIGRE model (see Discussion section). To better investigate how different components contributed to the overall prediction, we compared results from different variations of the current model. In the DIGRE model, the major hypothesis is a genomic “residual effect.” To test this hypothesis, we estimated the synergistic effect using a similarity score, without considering the genomic residual effect (i.e., the combination of two similar drugs is more synergistic), and the resulting PCI was only 0.49. This PCI value was much worse than the current DIGRE model, indicating that the genomic residual effect is crucial for estimation of the drug combination effect. We also checked the opposite assumption, i.e., assigning lower synergistic scores to the pairs of similar drugs, and the result was also much worse than the current model (data not shown).
As described in the Methods section, we also hypothesized that the estimation of expression similarity between two drugs can be improved by (i) a “focused view,” i.e., only considering the genes in specific cell growth pathways (CGPs), and (ii) a “global view,” accounting for gene-gene interactions using global pathways (GPs).The focused view allows the model to focus only on genes that directly relate to cell growth, while the global view allows the model to account for “upstream and downstream” genes (i.e., genes whose effects succeed or precede those of the gene under study). In our comparisons, the prediction performances for models without focused or global views were 0.603 and 0.597, respectively (Figure 2), indicating that both the focused and global views contributed to the superior performance of the DIGRE model. Interestingly, the model that considered both upstream and downstream genes in the global view (PCI = 0.627) performed even better than the current model (PCI = 0.614), which only considered the upstream genes in the global view. Based on the EOB, there were 16 synergistic and 36 antagonistic compound pairs. The overall Spearman's rank correlation coefficient between the predicted and observed synergistic effects was 0.377. The rank correlation was 0.443 for the 16 synergistic pairs and 0.290 for the 36 antagonistic pairs. In addition, among the top five predicted synergistic compound pairs, Geldana-mycin & Rapamycin (ranked 3rd) and Etoposide & Geldana-mycin (4th) were reported as synergistic in refs.16–17 and refs.18–19 respectively.
In summary, based on our comparisons, the genomic residual effect was the major factor contributing to the success of the DIGRE model, while the focused view and the global view approach also improved the model's performance. Furthermore, considering the expression of both up- and downstream genes in the global view can further improve the prediction result. The DIGRE model was implemented in R, and it takes less than 30 min to run for this data application.
Application to nine combinatorial drug effects on the breast cancer cell line McF7
We further validated the DIGRE model in predicting combinatorial effects with different dose levels. The dataset we used was from a study by Jin et al.,15 which includes phenotypic responses and gene expression profiles of MCF7 breast cancer cells treated with combinations of gefitinib and docetaxel at different dose levels (three dose levels for each drug and nine combinations in total). The observed synergistic Bliss scores for gefitinib and docetaxel combinations at different dose levels were derived from the original dataset and are summarized in table 1. In this study, since the variability of the experimentally observed EOB score was not available, we used Spearman rank correlations, instead of PCIs, to quantify the consistency between the predicted and observed ranks of the synergistic effects. The Spearman correlation coefficient between the predicted and the observed ranks in this study was 0.517 (Figure 4).
Table 1.
Synergistic Bliss score for gefitinib and docetaxel combination with different dose levels (original phenotypic response data was downloaded from ref.16
| Gefitinib (μmol) | |||
|---|---|---|---|
| Docetaxel (μmol) | 5 | 20 | 40 |
| The change of killing effect (%) | |||
| 0.15 | −0.0909 | 0.0381 | 0.0139 |
| 0.6 | −0.0485 | −0.0173 | 0.0264 |
| 1.2 | 0.0180 | 0.0251 | 0.0026 |
Figure 4.
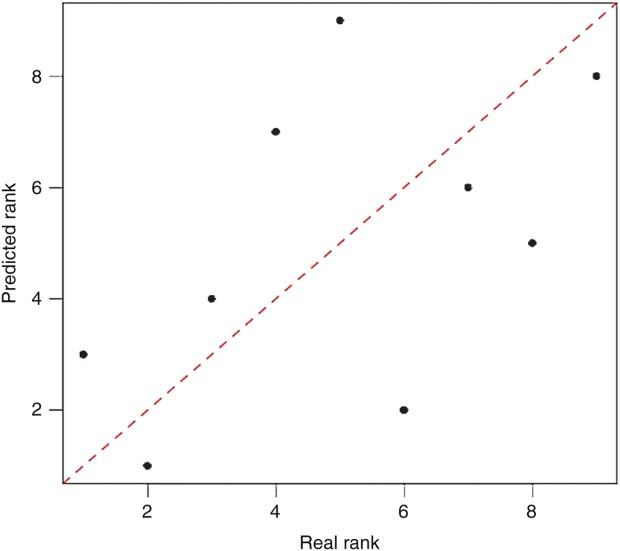
Scatter plot for synergistic ranks. Predicted ranks versus true ranks for breast cancer cell line MCF7 dataset, the Spearman correlation coefficient between two ranks was 0.517.
Besides the consistency between the predicted and observed ranks, we also studied the performance of the DIGRE model in detecting synergistic or antagonistic combinations. Both synergistic and antagonistic drug pairs were determined by EOB scores. Receiver operating characteristic (ROC) curves were used to investigate the sensitivity and specificity of the DIGRE model (results shown in Figure 5a,b). The areas under the ROC curve (AUC) were 0.889 for both synergistic and antagonistic compound pairs. These results convincingly indicate that the DIGRE model performed well in predicting drug combination effects at different dose levels.
Figure 5.
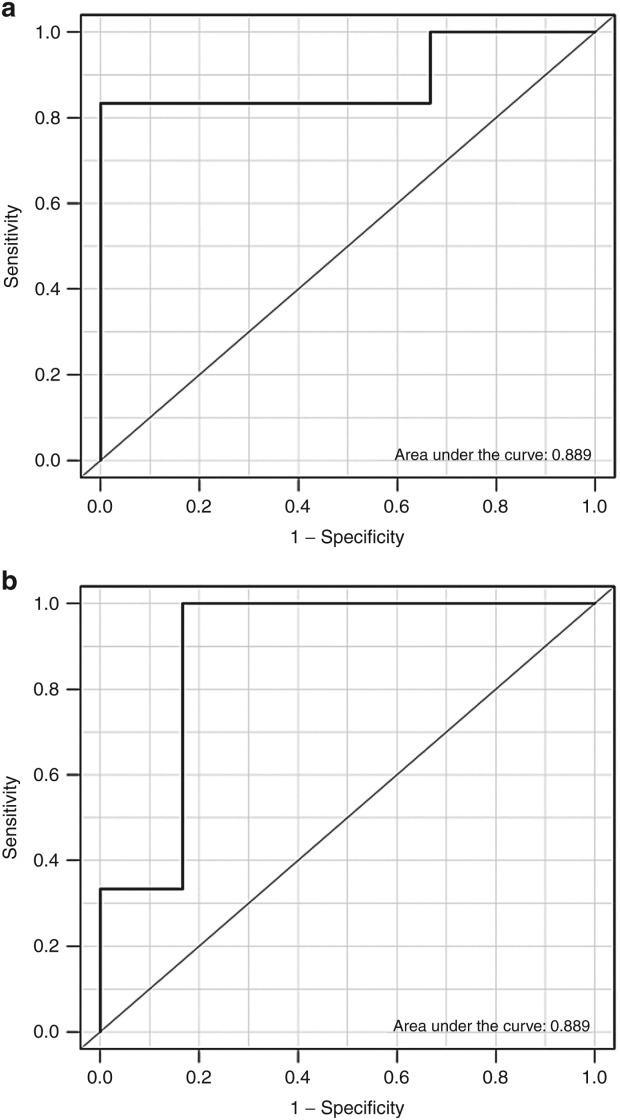
Receiver operator characteristic curves and area under the curve for (a) synergistic pair detection and (b) antagonistic pair detection.
DISCUSSION
In this study, we developed a DIGRE model to predict synergistic effects of drug combinations using genomic profiles. There are four key features of the model: (i) It is based on a new biological hypothesis of DIGREs. So, the model takes into account the sequential effect of the treatment, in agreement with many observations that the sequencing of drug treatment matters to patients' outcomes.20,21 In the DIGRE model, the genomic residual effect is estimated based on a mathematical model of the drug response. (ii) Information from the dose-response curves is incorporated into the model, taking advantage of the entire drug response curve rather than relying on only a single point, (iii) Only relevant genes are included in estimation of the expression similarity between two drugs (focused view). (iv) Pathway and gene-gene interactions are also incorporated into the model.
In this study, the DIGRE model performed reasonably well using the two datasets. Several potential extensions could be further studied: (i) the performance of our model relies on the accuracy and completeness of the known pathway information. The KEGG database was used for pathway information in this study. Although the KEGG database is one of the best known pathway databases, it contains errors. Thus, the performance of DIGRE might be improved by using a better curated pathway database; (ii) to quantify genomic changes, we only used the differentially expressed genes identified at 24 h after treatment using a simple fold-change cutoff. Thus, more sophisticated methods could be used to quantify transcriptomic changes; and (iii) since our model is designed for sequential treatment of drug combinations, we believe that obtaining experimental results with a specific order of treatments (e.g., initial treatment with drug A, followed by drug B), would significantly improve prediction accuracy.
METHODS
As shown in Figure 6a-c, the DIGRE model contains three major steps: (i) derive an expression similarity score between paired compounds. In particular, we used the gene expression changes induced by each compound to evaluate similarities between the two compounds; (ii) estimate the DIGRE by incorporating similarity scores and drug response curves; and (iii) calculate a final synergy score for each compound pair. In this section, we describe each step in detail; the pseudo-code for the DIGRE model is available in the Supplementary Data.
Figure 6.
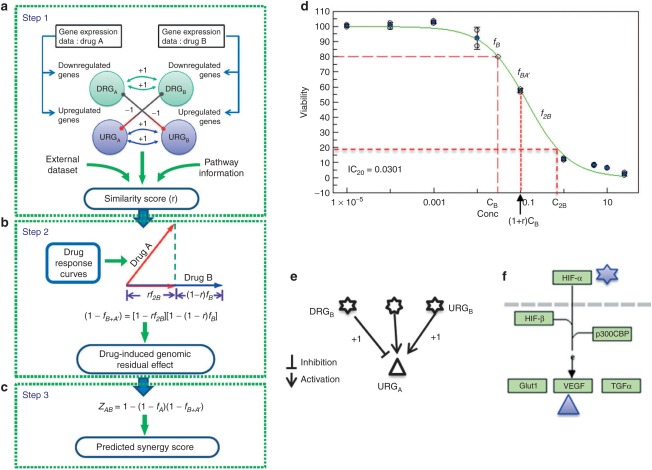
Detailed illustration of Drug-Induced Genomic Residual Effect (DIGRE) model. (a-c) The three steps of DIGRE model. Step 1 shows the derivation of the similarity score (r) between drug A and B from their genomic profiles. Step 2 depicts the estimation procedure of the drug-induced genomic residual effect from the similarity score, while step 3 shows the model for the final synergy score. (d) Residual effect hypothesis diagram. The green curve is the drug response curve for drug B. Here, we assumed that treatment with compound B followed treatment with compound A at concentrations IC20,B and IC20,A, respectively, where ICX,N is the X% growth inhibitory concentration for compound N. There are three cases to estimate inhibitory contributions from compound B: (1) if compounds A and B function independently, the estimation would be fB; (2) if the genomic changes induced by compound B are exactly the same as those induced by compound A, inhibition by B could be estimated as f2B; (3) if the effect from compound B is not independent or the same as the effect of compound A, it is estimated as fB+A′ determined by the similarity between compounds A and B. (e) Diagram showing that the sign of the contribution to similarity score is determined both by the variation type of the genes and the direction of the interaction. (f) A real case in KEGG (Kyoto Encyclopedia of Genes and Genomes) human cancer pathway. In this small pathway, the HIF-a gene product is related to two genes that are up- and downregulated by the two drugs, respectively.
Estimation of similarities between two compounds
Gene expression changes after drug treatment of the cell lines were used to estimate the similarities between the two compounds' genomic effects (Figure 6a). The differentially expressed genes induced by one compound were categorized into groups: (i) upregulated genes (URG) and (ii) downregulated genes (DRG) after treatment. We denoted these two groups as URGA and DRGA for compound A, and URGB and DRGB for compound B. The similarity score consists of two components: one component is contributed from overlapping genes between the URGs and DRGs, and the other component is contributed from genes that do not overlap but have direct regulation relationships in GPs.
For component 1, if a gene that is a member of one of the eight cell growth-related KEGG pathways (CGPs, see Supplementary table S1) is up- or downregulated by both compounds A and B (in the same direction), then it contributes one positive point to a similarity score. On the other hand, if a CGP gene is differentially regulated by compounds A and B, it contributes one negative point. Based on our knowledge, we empirically selected the following eight KEGG CGP pathways: aminoacyl-tRNA biosynthesis, MAPK signaling, NF-κB signaling, cell cycle, p53 signaling (DNA Damage), apoptosis, transforming growth factor-β signaling, and cancer pathways.
For component 2, we summarized the contribution from differentially expressed genes which were immediately upstream or downstream of the CGP genes. Here, the upstream or downstream gene regulation information was derived from the 32 KEGG GPs (see Supplementary table S2). Overall, 2,322 genes and 11,642 gene-gene interactions were included in the GPs. The detailed steps to calculate component 2 are as follows: (1) identify CGP genes that are in URGA or DRGA, but do not overlap with any URGB or DRGB genes; (2) identify the upstream or downstream genes of the genes identified in step (1); if a gene identified in step (2) belongs to URGB or DRGB, then it contributes one point to the similarity score, while the sign of the point is determined by both the direction of the expression change and the direction of the interaction. For example, a positive contribution could be either from a gene in URGB that activates a gene in URGA or inhibits a gene in DRGB (as shown in Figure 6e). To make the similarity scores comparable across different drugs, the final similarity score is normalized by the total number of differential expressed genes:
 |
Here, ris the similarity score of gene expression between compounds A and B, and −1 ≤ r ≤ 1. In the formula, the' symbol indicates the first treatment. The similarity score of the compounds' effects is dependent on the sequence of treatment with the two compounds, which agrees with the widely observed phenomena that the sequence of drug treatment matters to patients' outcomes.20,21
Estimate DIGRE
Let fA and fB be the fraction of cell growth inhibition induced by individual compounds A and B at concentrations CA and CB, respectively (Figure 6b). Suppose the cells are first treated by compound A, followed by compound B. After treatment by compound A, fA percent of cells are killed,while (1 − fA) percent of cells survive. The cells that survive compound A treatment carry the genomic change induced by compound A. This genomic residual effect further modulates the drug effect of compound B, which is the key hypothesis of this study. Suppose that if fA′+B is the percentage of cell death induced by compound B, fA′+B may differ from fB (the effect of compound B when used individually) because of the existence of the genomic residual effect induced by compound A. In this study, we hypothesized that the cell death induced by the combination can be approximated by
 |
1 |
where fA′ + B is the expression similarity score introduced previously, and f2B is the percentage of cell death after double-dose treatment of compound B by itself. Here, f2B can be derived from the drug response curve (Figure 6d). Eq. 1 is developed by conceptually decomposing the effect of compound A into two components: BB⊥A, which is independent from compound A; and BB=A, which is similar to compound A (see Figure 6). Therefore, in Eq. 1, rA′+B f2B accounts for the cell death induced by BB=A, while (1 − rA′+B) fB accounts for the cell death induced by BB=A. To understand how this estimation equation works, let us look at the two extreme cases: (i) If compound B is exactly the same as compound A (i.e., r′ = 1), Eq. 1 becomes fA′+B = f2B. Thus, the cell death induced by compound B, with the residual effect of A, is the same as if the cells had been treated by a double dose of compound B. (ii) If compound B is completely independent of compound A (i.e., rA′+B = 0), Eq. 1 becomes fA′+B = fB. So the cell death induced by compound B, with the residual effect of A, is the same as the cell death induced by compound B alone. In summary, the estimation equation is reasonable in both cases. In general, the effects of compounds A and B are neither independent nor the same, but somewhere in between. In this study, we showed that the equation performs well in general cases in two real datasets.
Estimation of combinatorial effect
After we estimate fA′+B′, the cell viability reduction by the combination of A and B can be calculated by
 |
2 |
Similarly, if the sequence of treatment with the two compounds is reversed (i.e., treat with compound B first, followed by compound A), the induced cell death can be estimated by
 |
3 |
In the estimation of induced cell death from compound combination, we use the cell death averaged from both possible sequences of compound treatment (Figure 6c). So, the final estimated cell death is
 |
Definition of the PcIs
A concordance index (c-index) was used to compute the proportion of concordance between the predicted and observed ranks of drug pairs to evaluate prediction performances. Let {r1, r2…rN] be the rank of observed drug pairs (Npairs in total) from the most synergistic to the most antagonistic in a specific dataset, with {p1, p2,…pN] predicted ranks calculated by the model. A score sij can then be computed as
 |
where i, j = 1, 2,…N. The concordance index is defined as
Because of the experimental noise in the observation of each drug pair, a probabilistic c-index (PC-index) is calculated to incorporate uncertainties. Instead of sij, a score is computed as
 |
where er is an error function defined as EOB is excess over bliss, and SE is the standard error of the mean EOB.
The final equation is
Generally, the PC-index is less than one, due to noise in the data. For example, the maximum PC-index was found to be 0.90 in the NCI DREAM Drug Combination Challenge dataset.
Acknowledgments
This work was supported by National Institutes of Health grants 5R01CA152301,1 R01CA172211, and 4R33DA027592, and Cancer Prevention Research Institute of Texas award RP101251.
Author Contributions
J.Y., H.T., G.X., and Y.X. wrote the manuscript. J.Y., G.X., and Y.L., designed the research. J.Y. performed the research.
Conflict of Interest
The authors declare no conflict of interest.
Study Highlights
WHAT IS THE CURRENT KNOWLEDGE ON THIS TOPIC?
✓ Multidrug regimens are considered a promising strategy that can improve therapeutic efficacy and possibly reduce side effects. However, published examples demonstrating their effectiveness by screening combinations by computational models are rare and not well studied.
WHAT QUESTION DID THIS STUDY ADDRESS?
✓ We introduce a novel computational model to rank drug combinations from the most synergistic to the most antagonistic by incorporating a biological hypothesis.
WHAT THIS STUDY ADDS TO OUR KNOWLEDGE
✓ The model was systematically validated by two datasets. Its performance in the recent NCI-DRUG Sensitivity Prediction Challenge indicates that the combinatorial drug effect for compounds A and B at least partly derives from gene expression change-induced residual effects.
HOW THIS MIGHT CHANGE CLINICAL PHARMACOLOGY AND THERAPEUTICS
✓ This model allows a better understanding of the mechanisms of drug interactions. In addition, its application can optimize the laborious process of experimentally screening drug combinations.
References
- Drews J. Drug discovery: a historical perspective. Science. 2000;287:1960–1964. doi: 10.1126/science.287.5460.1960. [DOI] [PubMed] [Google Scholar]
- Smalley KS, Haass NK, Brafford PA, Lioni M, Flaherty KT. Herlyn M. Multiple signaling pathways must be targeted to overcome drug resistance in cell lines derived from melanoma metastases. Mol. Cancer Ther. 2006;5:1136–1144. doi: 10.1158/1535-7163.MCT-06-0084. [DOI] [PubMed] [Google Scholar]
- Overall CM. Kleifeld O. Validating matrix metalloproteinases as drug targets and anti-targets for cancer therapy. Nat. Rev. Cancer. 2006;6:227–239. doi: 10.1038/nrc1821. [DOI] [PubMed] [Google Scholar]
- Jia J, et al. Mechanisms of drug combinations: interaction and network perspectives. Nat. Rev. Drug Discov. 2009;8:111–128. doi: 10.1038/nrd2683. [DOI] [PubMed] [Google Scholar]
- Nelson HS. Advair: combination treatment with fluticasone propionate/salmeterol in the treatment of asthma. J. Allergy Clin. Immunol. 2001;107:398–416. doi: 10.1067/mai.2001.112939. [DOI] [PubMed] [Google Scholar]
- Gupta EK. Ito MK. Lovastatin and extended-release niacin combination product: the first drug combination for the management of hyperlipidemia. Heart Dis. 2002;4:124–137. doi: 10.1097/00132580-200203000-00010. [DOI] [PubMed] [Google Scholar]
- Vermorken JB, et al. Platinum-based chemotherapy plus cetuximab in head and neck cancer. N. Engl. J. Med. 2008;359:1116–1127. doi: 10.1056/NEJMoa0802656. [DOI] [PubMed] [Google Scholar]
- Kitano H. A robustness-based approach to systems-oriented drug design. Nat. Rev. Drug Discov. 2007;6:202–210. doi: 10.1038/nrd2195. [DOI] [PubMed] [Google Scholar]
- Kisliuk RL. Synergistic interactions among antifolates. Pharmacol. Ther. 2000;85:183–190. doi: 10.1016/s0163-7258(99)00056-x. [DOI] [PubMed] [Google Scholar]
- Rand KH. Houck H. Daptomycin synergy with rifampicin and ampicillin against vancomycin-resistantenterococci. J. Antimicrob. Chemother. 2004;53:530–532. doi: 10.1093/jac/dkh104. [DOI] [PubMed] [Google Scholar]
- Graham BA, Hammond DL. Proudfit HK. Synergistic interactions between two alpha(2)-adrenoceptor agonists, dexmedetomidine and ST-91, in two substrains of Sprague-Dawley rats. Pain. 2000;85:135–143. doi: 10.1016/s0304-3959(99)00261-4. [DOI] [PubMed] [Google Scholar]
- Azrak RG, et al. The mechanism of methylselenocysteine and docetaxel synergistic activity in prostate cancer cells. Mol. CancerTher. 2006;5:2540–2548. doi: 10.1158/1535-7163.MCT-05-0546. [DOI] [PMC free article] [PubMed] [Google Scholar]
- Zhao XM, Iskar M, Zeller G, Kuhn M, van Noort V. Bork R. Prediction of drug combinations by integrating molecular and pharmacological data. PLoS Comput. Biol. :7. doi: 10.1371/journal.pcbi.1002323. Binnprwrupn-m. [DOI] [PMC free article] [PubMed] [Google Scholar]
- Wu Z, Zhao XM. Chen L. A systems biology approach to identify effective cocktail drugs. BMC Syst. Biol. 2010:4. doi: 10.1186/1752-0509-4-S2-S7. Suppl 2, S7 ( ) [DOI] [PMC free article] [PubMed] [Google Scholar]
- Jin G, Zhao H, Zhou X. Wong ST. An enhanced Petri-net model to predict synergistic effects of pairwise drug combinations from gene microarray data. Bioinformatics. 2011;27:i310–i316. doi: 10.1093/bioinformatics/btr202. [DOI] [PMC free article] [PubMed] [Google Scholar]
- Francis LK, et al. Combination mammalian target of rapamycin inhibitor rapamycin and HSP90 inhibitor 17-allylamino-17-demethoxygeldanamycin has synergistic activity in multiple myeloma. Clin. Cancer Res. 2006;12:6826–6835. doi: 10.1158/1078-0432.CCR-06-1331. [DOI] [PubMed] [Google Scholar]
- Fujimoto S, Inagaki J, Horikoshi N. Ogawa M. Combination chemotherapy with a new anthracycline glycoside, aclacinomycin-A, and active drugs for malignant lymphomas in P388 mouse leukemia system. Gann. 1979;70:411–420. [PubMed] [Google Scholar]
- Barker CR, et al. Inhibition of Hsp90 acts synergistically with topoisomerase II poisons to increase the apoptotic killing of cells due to an increase in topoisomerase II mediated DNA damage. Nucleic Acids Res. 2006;34:1148–1157. doi: 10.1093/nar/gkj516. [DOI] [PMC free article] [PubMed] [Google Scholar]
- Yao Q, Weigel B. Kersey J. Synergism between etoposide and 17-AAG in leukemia cells: critical roles for Hsp90, FLT3, topoisomerase II, Chk1, and Rad51. Clin. Cancer Res. 2007;13:1591–1600. doi: 10.1158/1078-0432.CCR-06-1750. [DOI] [PubMed] [Google Scholar]
- Shah MA. Schwartz GK. Cell cycle-mediated drug resistance: an emerging concept in cancer therapy. Clin. CancerRes. 2001;7:2168–2181. [PubMed] [Google Scholar]
- Recht A, et al. The sequencing of chemotherapy and radiation therapy after conservative surgery for early-stage breast cancer. N. Engl. J. Med. 1996;334:1356–1361. doi: 10.1056/NEJM199605233342102. [DOI] [PubMed] [Google Scholar]


