

Abstract
The algorithms and models used to address the two subchallenges that are part of the NCI-DREAM (Dialogue for Reverse Engineering Assessments and Methods) Drug Sensitivity Prediction Challenge (2012) are presented. In subchallenge 1, a bidirectional search algorithm is introduced and optimized using an ensemble scheme and a nonlinear support vector machine (SVM) is then applied to predict the effects of the drug compounds on breast cancer cell lines. In subchallenge 2, a weighted Euclidean distance method is introduced to predict and rank the drug combinations from the most to the least effective in reducing the viability of a diffuse large B-cell lymphoma (DLBCL) cell line.
Given that cancer is the leading cause of death around the world, developing drug compounds to target and treat cancers is a priority. However, developing cancer therapeutics is a long and expensive procedure as well as a challenging pharmaceutical task involving different developmental and clinical testing stages. To facilitate this process, the use of computational and simulation models to predict the response of cancer cell lines to drug compounds has grown in recent years.1,2 Models could aid in the drug design process and address some of these challenges, i.e., help in identifying drug candidates.3 Identifying effective lead drug candidates for treating diseases, e.g., cancer, could benefit from approaches that can predict the sensitivity of cancer cells to drug compounds. These in silico predictors (models) have been built (learned) using static conditional as well as time-series gene expression data.4,5
Statistical techniques, e.g., regression integrated with random forest, have been applied on gene expression data from cancer cells treated with different drug compounds to predict the ability of the drugs to inhibit proliferation of the cancer cell lines.6 Naive Bayes classifiers have been applied on gene expression, chromosomal copy number variation, and sequencing data from human cancer cell lines treated with 24 anticancer drugs to predict the ability of the drugs to inhibit their proliferation.7 Similarly, a weighted voting classification model has been applied on gene expression data to predict the drug responses (sensitive or resistant) of 60 human cancer cell lines.3 A combination of relief, a nearest neighbor method, and random forest also have been applied on proteomic data to predict the response (sensitive, intermediate, or resistant) of human cancer cell lines to drugs.8 Likewise, a weighted-voting algorithm based on a set of differentially expressed genes to evaluate the ability of an anticancer drug (Docetaxel) to treat breast cancer, correctly classified (predicted) 80% of the 26 samples (patients), i.e., whether a sample was treated with the drug or not.9
Many of the statistical techniques have been employed on only gene expression data with few applied on two or more different types of data (e.g., proteomic, gene expression, and sequencing data) to predict the response of the cancer cells to drug compounds. The results reported are in response to the NCI-DREAM (Dialogue for Reverse Engineering Assessments and Methods) Drug Sensitivity Prediction Challenge (2012) and consist of two subchallenges. For the two NCI-DREAM subchallenges, subchallenge 1 was based on five different types of data (i.e., proteomic, gene expression, RNA-seq data, DNA methylation, and DNA copy-number variation), and subchallenge 2 was based on time series gene expression data of treated vs. untreated diffuse large B-cell lymphoma (DLBCL) cancer cells.
In the first subchallenge, we use a greedy search algorithm (bidirectional search) that combines the merits of ensemble modeling and kernel methods (support vector machine (SVM)) to predict the sensitivity of the breast cancer cell lines to previously untested drug compounds. We assume that predictions of drug sensitivity could be improved by integrating different types of information. The data provided in the subchallenge either control (or alter) the gene expression level or are further analyzed to gain insight into the regulation of the genes. Given the diverse types of data, ensemble models would be amenable, and further have the advantage of increased solution stability. Most of the ensemble models applied to drug sensitivity predictions have thus far used different base algorithms to extract features from one type of data (i.e., microarray6 or proteomic8. In contrast, we developed an ensemble model that extracts features from different types of data (proteomic data, gene expression, RNA-seq, DNA methylation, and DNA copy number variation) rather than using different base algorithms on a single type of data. In other words, we use the same base learning algorithms on the five different types of data. The ensemble model based on the different types of data can better exploit the different behavior of the base learning models and thereby enhance and improve the accuracy of the overall model.
In the second subchallenge, we applied a weighted Euclidean distance method to predict the rank order of drug pairs that have a synergic effect in reducing the viability of a DLBCL cell line and demonstrated that this simple approach outperformed more advance similarity/statistical measures.
RESULTS
The scores for subchallenge 1 are based primarily on the similarity between the predicted and experimental rankings of the 18 test cancer cell lines with respect to their sensitivity (from most to least) to the drugs. Additionally, to break ties between teams achieving the same score based on the ranking of the 18 test cancer cell lines, a score based on the full ranked list (18 test cancer cell lines + 35 training cancer cell lines) is compared. The scoring metric used to compare the different models is based on the modified concordance index (c-index), also known as the weighted probabilistic c-index (weighted pc-index or wpc-index). The wpc-index quantifies the similarity between two ranked lists, in this case, the predicted and the experimental rankings of any two cell lines (i.e., their sensitivity to a drug) in this list of 18 cancer cell lines.10 The wpc-index is normalized to a final value that ranges from (0,1); the higher the normalized wpc-index, the more similar the predicted ranking is to the experimental ranking. The pc-index compares the predicted rankings of any two cell lines to their experimental rankings (this process is repeated for all possible cell line pairs). This generates a score that reflects the relationship (concordant or discordant) between the predicted rankings of two cell lines to their corresponding experimental rankings. If the predicted rankings between the two cell lines correspond to their experimental rankings, then a value between (0.5,1) is returned according to an error function (e.g., the error function takes into account the ranking (predicted vs. experimental) as well as the response (predicted vs. experimental) of the cancer cell lines to drugs). On the other hand, if they do not correspond, then a value between (0,0.5) is returned. The pc-index is calculated for each drug individually and then the average of the pc-index scores across all drugs is calculated to obtain the wpc-index.
As shown in Figure 1, the bidirectional search (wpc-index of 0.549) outperformed several other ensemble approaches, including ones that used random forests (wpc-index of 0.524), gradient boosting (wpc-index of 0.538), bagging and gradient boosting (wpc-index of 0.544), decision trees (wpc-index of 0.548), a combination of k-nearest neighbor regression, linear least-squares regression, support vector regression, and gradient boosting regression (ensemble model 3, wpc-index of 0.506), and a combination of SVM, random forest, ridge regression, and boosting (ensemble model 2, wpc-index of 0.517). Therefore, the ensemble scheme using the bidirectional search outperformed several state-of-the-art ensemble schemes (e.g., random forest, bagging, boosting). This is because the bidirectional search algorithm (feature selection method) obtains a set of representative features that is achieved by iteratively applying sequential forward and backward selections to select good and remove bad features from the feature set, and further provides a solution that is close to optimal.11 However, our ensemble scheme was outperformed by two other ensemble models, the ensemble of regression models (wpc-index of 0.562) and SVMs (ensemble model 1, wpc-index of 0.554). It is notable that the top three performing ensemble approaches used the SVM family of supervised learning methods.
Figure 1.
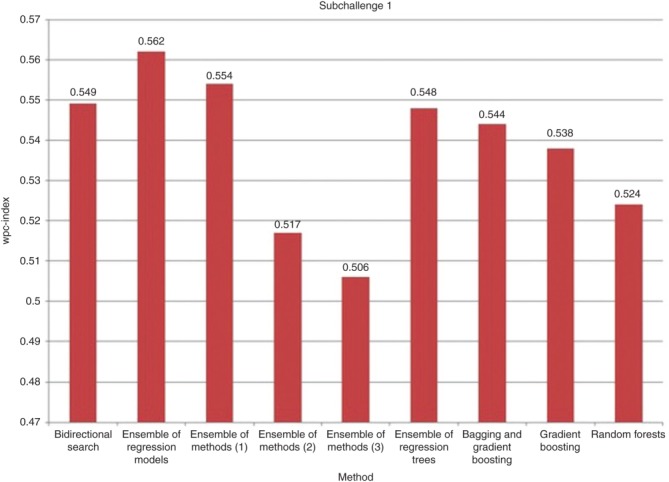
Comparison of the normalized wpc-index (0 for (worst) and 1 for (best)) between different ensemble approaches. The wpc-index is a composite score based on the ranking of the 18 test cancer cell lines with respect to their sensitivity to all the drug compounds and relative to the 35 training cancer cell lines. The rankings are based on the sensitivity of the cancer cell lines to each drug compound (from most to least effective). Ensemble of methods (1) corresponds to an ensemble model of random forest, SVM, and linear regression and where the predictions are made with the best-performing ensemble model of SVM. Ensemble of methods (2) corresponds to an ensemble of SVM with a radial kernel, SVM with a polynomial kernel, random forest, ridge regression, and boosting and where each method is applied on the five datasets and the results are then combined. Ensemble of methods (3) corresponds to an ensemble of k-nearest neighbor regression, linear least-squares regression, support vector regression, and gradient boosting regression and where the predictions are made with the best-performing ensemble model. SVM, support vector machine.
An ensemble scheme that combines proteomic, gene expression, RNA-seq data, DNA methylation, and DNA copy number variation was compared to models that used only one of the five data types. These single dataset models applied the same methods as the ensemble scheme to select the features (here bidirectional search was used) and predict the sensitivity of the cancer cell lines to the drug compounds (here SVM was used). As shown in Figure 2, an ensemble scheme (wpc-index of 0.549) that integrates multiple types of data in learning the classification models outperformed classification models that use a single type of data, i.e., RNA-seq (0.446), microarray (0.392), DNA methylation (0.439), proteomic (0.317), or DNA copy number variation (0.382) alone.
Figure 2.
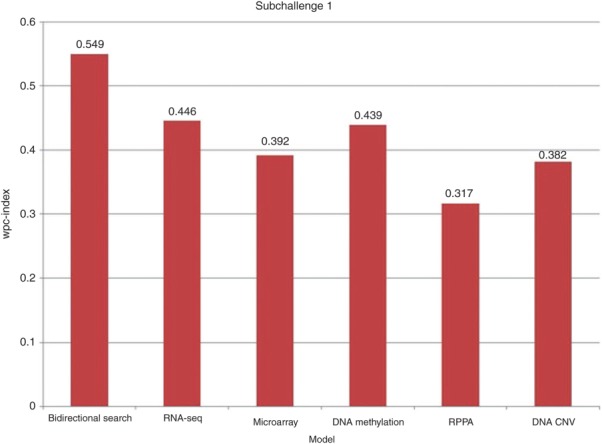
Comparison between the wpc-index of different models. The bidirectional search is based on five different types of data (RNA-seq, microarray, DNA methylation, reverse phase protein array (RPPA), DNA copy number variation (DNA CNV)). The five other models applied the bidirectional search algorithm to only one of the five types of data.
The weighted Euclidean distance measure was compared to other similarity/statistical measures in subchallenge 2. Each method had a score (wpc-index), which was calculated by comparing the predicted ranked list of the 91 drug pairs to the experimental ranked list (the ground truth). The experimental ranked list was based on the difference between the experimentally determined IC20 (20% inhibition concentration) and the expected IC20 (20% inhibition concentration) for pairs of drug combinations. The expected IC20 was computed by calculating the synergy between two drug compounds based on their individual activity.12 As shown in Table 1, a weighted Euclidean distance similarity measure (0.51624) outperformed Pareto ranking (0.50653), t-test (0.48988), information theoretic measure (0.48568), Pearson correlation (0.41993), and a nonlinear similarity measure (0.43479).
Table 1.
Comparison of score (wpc-index) between different similarity and statistical measures
| Similarity/statistical measure | Score |
|---|---|
| Weighted Euclidean distance | 0.51624 |
| Pareto ranking | 0.50653 |
| t-test | 0.48988 |
| Information theory measure | 0.48568 |
| Pearson correlation | 0.41993 |
| Nonlinear similarity measure | 0.43479 |
Score is normalized between 0 (worst) and 1 (best).
DISCUSSION
The 2012 NCI-DREAM Drug Sensitivity Prediction Challenge consisted of two subchallenges with different types of data used to predict the sensitivity of cancer cell lines to drugs.
Since different types of data are provided for subchallenge 1, ensemble modeling is a reasonable approach to tackle the different data. Different supervised learning algorithms (e.g., decision trees, k-nearest neighbors, SVMs, regression models, etc.) can generate different predictions since they involve stochastic learning.13 An ensemble framework, using different base learning algorithms or feature representations, could mitigate this shortcoming by generating a more stable solution as compared to individual supervised learning methods. Previously, we showed through simulation experiments that an ensemble classification approach outperformed a single classification model when applied to gene expression data.14
Similarly, applying an ensemble framework to the five different types of data generated better predictions and a more stable solution as compared to applying models based on single type of data (Figure 2). Using different types of data provides an advantage in building more reliable models. We previously showed that models based only on gene expression and protein-protein interaction data outperformed models based on only gene expression data.15–18 Thus far, predictions of the response of cancer cells to drug compounds have been applied mostly on a single type of data (i.e., gene expression data).3,6,8,9 Indeed, integrating different types of data (RNA-seq, DNA methylation, DNA copy number variation, reverse phase protein array, and microarray gene expression data) generated a model that better predicted the response of cancer cells to drug compounds as compared to using each type of data alone (Figure 2). Thus, combining the different types of data in an ensemble scheme yielded more accurate predictions as compared to single classifier models or models based on a single type of data.
Missing values present a disadvantage to the algorithm proposed in subchallenge 1 and degrades its general performance. Therefore, in the future, strategies to address missing values could increase the general performance of the bidirectional search algorithm. The bidirectional search algorithm presented deals mainly with quantitative data (e.g., gene expression, methylation, RNA-seq) but has a limitation in handling other types of data structures (e.g., protein-protein interaction/network data or qualitative data). To address this limitation, methods (e.g., these generate a binary matrix to convert a PPI network into a quantitative model) to quantify these network/qualitative data structures can be applied to integrate them into our model. The ensemble scheme presented in subchallenge 1 can be generalized and applied to other systems (e.g., human, plants, etc.) or diseases. As long as the data are quantitative, the proposed model can be applied. The main objective is to build separate models at the feature level (Figure 3). In our approach, five different feature level models were constructed for the five different types of data, i.e., RPPA, copy-number variation, methylation, gene expression, RNA-seq. Once these models are constructed, the classification/prediction as well as the combination (e.g., ensemble scheme) of predictions are straightforward.
Figure 3.
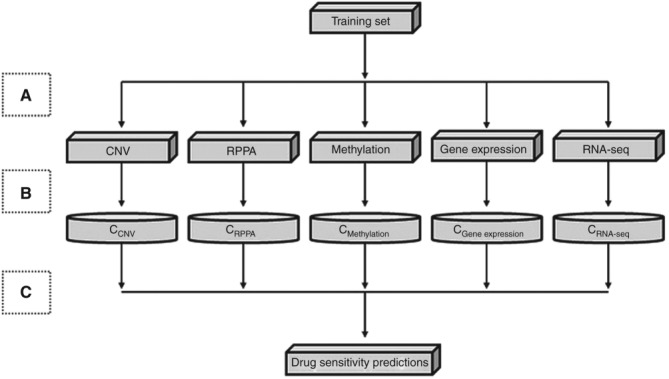
Subchallenge 1 feature selection and learning through an ensemble model. (a) Feature level—from the training set that contains five different types of data, multiple training datasets are created (CNV, RPPA, methylation, gene expression, and RNA-seq). (b) Classifier level—each of the five training datasets represents a distinct set of features, which are used to learn five different classification models. (c) Combination level—the prediction results generated from the five models are combined to obtain the final drug sensitivity predictions. CNV, copy-number variation; RPPA, reverse phase protein array.
Since it is very difficult and computationally infeasible to enumerate all possible solutions to determine the best set of features to build a base model, there is a need for a method (in our case, the bidirectional search algorithm was used) to select a subset of features that can be used by the optimization technique (e.g., SVM) to achieve good predictions. The greedy algorithm we chose is a combination of two algorithms (sequential forward selection and sequential backward selection), and as shown from empirical experiments outperformed a number of approaches that used an ensemble scheme. Our method was able to outperform several state-of-the-art ensemble schemes (e.g., random forests, boosting, bagging). However, our method was outperformed by two ensemble schemes where the same evaluation function (SVM) was used. Based on the aforementioned results, it is possible that the use of an ensemble scheme with different feature selection methods as base models could generate improved results. For example, each base model in the ensemble scheme could use a different feature selection method (e.g., bidirectional search, Spearman's rank correlation, correlation, PCA, Lasso or the Ridge method). Each base model would provide predictions using a SVM evaluation function, and the overall prediction based on all the models would be combined to achieve better results.
Since efficiency is also an important factor in our study, we developed an approach (feature selection + evaluation function) that minimizes the number of features selected while maximizing the accuracy of the model. In other words, one can liken this to a dual optimization problem, where the goal is to increase the accuracy with the fewest number of features. Addressing this problem as a single optimization problem (e.g., maximizing accuracy) could improve the results, but will suffer from the disadvantage of being inefficient computationally.
Applying any optimization technique (e.g., SVM) prior to applying a feature selection method can result in the “curse of dimensionality” (e.g., a large number of features where it becomes difficult to select the representative features that are the basis for any base classification algorithm). Therefore, prior to applying SVM, which is an evaluation function responsible for predicting the response of a cell line to a drug, it is important to select a set of representative/important features (e.g., genes) that can accurately (or at least with minimal error function) predict the response of the cancer cell lines to the drug compounds.
SVM, the evaluation function used in our study, is known to be computationally intensive and cannot be run on the entire set of features provided. Therefore, running a preprocessing technique (e.g., feature selection method—bidirectional search algorithm) to select a subset of features that is capable of being handled by this evaluation function would improve its computational efficiency. Applying other evaluation functions (e.g., decision trees, k-nearest neighbor, linear discriminant analysis) that tend to be less computationally intensive, with our feature selection method, could provide an alternative for selecting more representative/important features, while improving the overall accuracy and efficiency.
For subchallenge 2, we demonstrated that a simple method such as the weighted Euclidean distance can achieve competitive results to more advanced mathematical or hypothesis testing approaches. We show that it is not always the case that the more advanced the mathematics or statistical assumptions made, the better the results achieved, sometimes the simpler and fewer assumptions can yield comparable results. As shown from our empirical experiments, it is possible that a simple model with a straight-forward weighting scheme and simple similarity measure is able to perform as well as more advanced approaches.
The weighted Euclidean distance model presented is simple and applies a straightforward weighting scheme and a simplified similarity measure. Thus it is easy to implement. This simple scheme achieved satisfactory results as compared to more advanced similarity measures/statistical methods in predicting the drug compound combinations that are both effective (or ineffective) in reducing the viability of the DLBCLcell line (Table 1). A word of caution, this observation is based on the datasets analyzed in this study and should not be generalized to other scenarios. Thus, it is sometimes the case that simpler and fewer assumptions could yield improved results.
The approach presented in subchallenge 2 accounts for linear relationships and does not capture nonlinear dependence. Therefore, a distance function that accounts for nonlinear relationships (e.g., dynamic time warping) could improve the results. There are certain scenarios where this approach could fall short. For instance, in cases where we have two drugs that are exactly the same, the weighted Euclidean distance between those two drugs would be approximately zero, which according to our approach means that the combination of those drugs yields a high synergistic score. In reality, this would be incorrect. This is due, in part, to the simplicity of the weighting scheme used, which ranks every drug according to its activity. This limitation of a simple weighting scheme could be addressed by adding more assumptions. For example, developing a probabilistic weighting scheme (e.g., probabilistic hidden Markov model) could potentially address this situation. In this case, one can add an assumption in a probabilistic model to require that two of the same drugs cannot yield a highly synergistic score. Alternatively, applying clustering using a weighted Euclidean distance as a similarity measure could potentially generate a partition containing groups of similar objects (drugs). Further analysis can be applied on each group (e.g., cluster) to generate predictions. Hypothetically, there might be scenarios where a cluster could contain a number of effective drug combinations + a drug combination where its activity (effective or ineffective) is unknown. Based on this evidence, it could suggest that this drug combination with unknown activity is also effective, and thus could provide novel predictions.
METHODS
Data
The data description for subchallenge 1 and 2 is contained in the Supplementary Methods online.
Algorithms and models
The algorithms and models used to address subchallenge 1 include a bidirectional search algorithm to select a set of features from each data are set where the training and testing is performed with a supervised learning method, SVM with a radial basis kernel. In subchallenge2, a weighted Euclidean distance method is introduced to predict the sensitivity of binary combinations of drug compounds and whether they have a synergic effect on reducing the viability of the DLBCL cell line.
Subchallenge 1
The data provided in the NCI-DREAM data-sets are of high dimensionality (contain a large number of features). This large number of features degrades the performance of supervised and unsupervised learning algorithms because the feature space becomes sparse and the distance between the samples becomes less precise. Feature selection methods can address this challenge, which arises from high data dimensionality prevalent in most high-throughput or high-throughput omics studies (e.g., microarray, RNA-seq, DNA methylation) by selecting or extracting a subset of features through linear combinations or nonlinear mapping of the feature set. In addition, it is computationally infeasible to enumerate all possible feature sets to find the optimal set of features. Therefore, to address the two aforementioned limitations, a near-optimal bidirectional search algorithm was introduced to select a subset of features11 that were used to predict the response of the breast cancer cell lines to drug compounds. The bidirectional search algorithm finds a near-optimal set of features to predict the response of the cells to the drugs by combining the merits of sequential forward and backward selections. Figure 3 summarizes the general framework applied in subchallenge 1.
Feature level
Sequential forward and backward selections are combined to implement the bidirectional search algorithm. The sequential forward selection starts from an empty set of features and successively adds features until it forms a locally optimal feature set that is used for classification, i.e., to predict the response of the cancer cell lines to the drug compounds. On the other hand, the sequential backward selection starts from a full set of features and successively removes features until it forms a locally optimal feature set that is used for prediction (Supplementary Methods online).
Classifier level
In the classifier level, where the models are constructed and used to predict the sensitivity of the cancer cell lines to each drug compound, we learned five different models, each capturing a set of features from a data type. This is achieved through building an ensemble framework of base learning systems (i.e., individual models). The motivation behind using an ensemble framework is to assist in the process of handling diverse sets of data where each data type exhibits different characteristics.22 The base classifiers (individual models) were constructed through a supervised learning method, e.g., SVM. SVM was used as an objective function in Algorithm 3 to determine the best features to add to the feature set (sequential forward selection) as well as the worst features to remove from the feature set (sequential backward selection). The Libsvm tool was used to implement SVM23 where tenfold crossvalidation was used to avoid overfitting the model. By applying SVM, the sensitivity or response of the breast cancer cell lines to the different drugs was predicted. Since the underlying structure of the data is nonlinear, SVM maps the data to a higher dimensional space through a kernel function (radial basis function: where
where ) and then applies linear regression in this new feature space to compute the predicted sensitivity. The training set contained 35 breast cancer cell lines that were used to train the SVM classifier/model. Next, the classification (prediction) model was applied on the test set containing the remaining 18 breast cancer cell lines to predict the sensitivity or response of these 18 breast cancer cell lines to each drug compound. Mean squared error was used to assess the quality of the features in the training set.
Combination level
After learning the five different classifiers, each representing a distinct feature set through SVM, five lists were generated that provided a ranking (from the most to the least efficacious drug) of the sensitivity or response of the breast cancer cell lines to each drug compound. These five ranked lists were integrated by averaging the rank of each drug compound across the five lists for each breast cancer cell line. Next, a final rank list was generated by sorting the ranks of the different breast cancer cell lines based on their average rank. In other words, a ranked list of 53 breast cancer cell lines from the most to the least sensitive (i.e., from the most to the least responsive cancer cells to the drug) was constructed for each drug compound.
Subchallenge 2
A weighted Euclidean distance was used to compute the similarity between different, treated, time-series profiles to predict the activity of drug pairs. The assumption is that the closer the time-series profiles two drug compounds are in the feature space (e.g., the more similar they are based on a distance measure), the more similar their effects on the cell response will be. Although the Euclidean distance measure is simple to compute and is limited to linear relationships between samples, it has been shown through different empirical experiments that the similarity measure using the Euclidean distance achieves comparable results to more advanced similarity measures (e.g., nonlinear similarity measures).24,25
Each drug compound was weighted according to its activity, thus the 14 drugs were weighted differently according to their “measure of importance” or the therapeutic efficacy of each drug on the DLBCL cell line. The weight of each drug corresponds to the rank of the drug based on its activity or ability to inhibit growth of the cells, with a higher ranking for drugs with higher therapeutic efficacy. The drug compounds were weighted from 1 to 14:
 |
After computing the weight of every drug according to its sensitivity to the DLBCL cell line, a weighted Euclidean distance measure was employed to calculate the similarity between all drug compounds. The similarity between all pairs of drugs generated 91 similarity values, where each similarity measure represents the distance (di,j) between two drug compounds (i,j) across different time points.
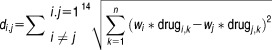 |
where
drugi,k where k = 1…n corresponds to the time-series expression profile (treated and untreated) vector for drugi
drugj,k where k = 1…n corresponds to the time-series expression profile (treated and untreated) vector for drugj
n corresponds to the size of the expression profile vector.
The above equation calculates the distance between all pairs of drugs (totaling 91 drug pairs). Therefore, di,j is a final similarity vector of size 91.
After computing the similarity between all pairs of drugs, the drug pairs were ranked from the most to the least similar. The more similar two drug compounds are, the more alike their effects or efficacy should be. The 91 similarity measures were ranked from the most similar to the most dissimilar (e.g., from the most synergistic to the most antagonistic), and therefore, a list was generated based on the therapeutic efficacy of pairs of drug compounds on the DLBCL cell line.
Acknowledgments
This study was supported in part by the National Institutes of Health (R01GM079688, R01GM089866, and R21CA176854) and the National Science Foundation (CBET 0941055).
Author contributions
C.C. and H.H. wrote the manuscript. C.C. and H.H. designed the research. H.H. performed the research. H.H. analyzed the data. C.C. contributed new reagents/analytical tools.
Conflict of interest
The authors declare no actual or potential conflicts of interest.
The implementation (i.e., example code) and datasets are available at http://www.egr.msu.edu/changroup/Protocols/NCI-DREAM7.html.
Study Highlights
WHAT IS THE CURRENT KNOWLEDGE ON THIS TOPIC?
✓ Ensemble models have been applied on a single type of biological data to predict the sensitivity of cancer cell lines to drug compounds.
WHAT QUESTION DID THIS STUDY ADDRESS?
✓ How different types of data can be used to more accurately predict the sensitivity or response of cancer cell lines to drug compounds.
WHAT THIS STUDY ADDS TO OUR KNOWLEDGE
✓ Ensemble approaches can capture and extract key features from different types of biological data by capitalizing on different base models to increase the accuracy of the final model as compared to ensemble models that are applied on a single type of data. Additionally, a simple weighted Euclidean distance measure could achieve competitive results to more advanced similarity/statistical measures for predicting the response of a cancer cell line to combinations of drug compounds.
HOW THIS MIGHT CHANGE CLINICAL PHARMACOLOGY AND THERAPEUTICS
✓ This study can aid the drug design process by facilitating the identification of effective lead drug candidates for treating cancer.
References
- Lee JK, et al. A strategy for predicting the chemosensitivity of human cancers and its application to drug discovery. Proc. Natl. Acad. Sci. USA. 2007;104:13086–13091. doi: 10.1073/pnas.0610292104. [DOI] [PMC free article] [PubMed] [Google Scholar]
- Mori S, Chang JT, Andrechek ER, Potti A. Nevins JR. Utilization of genomic signatures to identify phenotype-specific drugs. PLoS One. 2009;4:e6772. doi: 10.1371/journal.pone.0006772. [DOI] [PMC free article] [PubMed] [Google Scholar]
- Staunton JE, et al. Chemosensitivity prediction by transcriptional profiling. Proc. Natl. Acad. Sci. USA. 2001;98:10787–10792. doi: 10.1073/pnas.191368598. [DOI] [PMC free article] [PubMed] [Google Scholar]
- Berlow N, Davis LE, Cantor EL, Séguin B, Keller C. Pal R. A new approach for prediction of tumor sensitivity to targeted drugs based on functional data. BMC Bioinformatics. 2013;14:239. doi: 10.1186/1471-2105-14-239. [DOI] [PMC free article] [PubMed] [Google Scholar]
- Chang JC, et al. Gene expression profiling for the prediction of therapeutic response to docetaxel in patients with breast cancer. Lancet. 2003;362:362–369. doi: 10.1016/S0140-6736(03)14023-8. [DOI] [PubMed] [Google Scholar]
- Riddick G, et al. Predicting in vitro drug sensitivity using Random Forests. Bioinformatics. 2011;27:220–224. doi: 10.1093/bioinformatics/btq628. [DOI] [PMC free article] [PubMed] [Google Scholar]
- Barretina J, et al. The Cancer Cell Line Encyclopedia enables predictive modelling of anticancer drug sensitivity. Nature. 2012;483:603–607. doi: 10.1038/nature11003. [DOI] [PMC free article] [PubMed] [Google Scholar]
- Ma Y, Ding Z, Qian Y, Shi X, Castranova V, Harner EJ. Guo L. Predicting cancer drug response by proteomic profiling. Clin. Cancer Res. 2006;12:4583–4589. doi: 10.1158/1078-0432.CCR-06-0290. [DOI] [PubMed] [Google Scholar]
- Iwao-Koizumi K, et al. Prediction of docetaxel response in human breast cancer by gene expression profiling. J. Clin. Oncol. 2005;23:422–431. doi: 10.1200/JCO.2005.09.078. [DOI] [PubMed] [Google Scholar]
- Harrell FE. Regression modeling strategies: with applications to linear models, logistic regression, and survival analysis. New York: Springer-Verlag; 2001. [Google Scholar]
- Saeys Y, Inza I. Larrañaga R. A review of feature selection techniques in bioinformatics. Bioinformatics. 2007;23:2507–2517. doi: 10.1093/bioinformatics/btm344. [DOI] [PubMed] [Google Scholar]
- Borisy AA, et al. Systematic discovery of multicomponent therapeutics. Proc. Natl. Acad. Sci. USA. 2003;100:7977–7982. doi: 10.1073/pnas.1337088100. [DOI] [PMC free article] [PubMed] [Google Scholar]
- Burger M. Engl HW. Training neural networks with noisy data as an ill-posed problem. Advances in Computational Mathematics. 2000;13:335–354. [Google Scholar]
- Hijazi H, Wu M, Nath A. Chan C. Ensemble classification of cancer types and biomarker identification. Drug Development Res. 2012;73:414–419. doi: 10.1002/ddr.21032. [DOI] [PMC free article] [PubMed] [Google Scholar]
- Hijazi H. Chan C. A classification framework applied to cancer gene expression profiles. J. Healthc. Eng. 2013;4:255–283. doi: 10.1260/2040-2295.4.2.255. [DOI] [PMC free article] [PubMed] [Google Scholar]
- Yousef M, Ketany M, Manevitz L, Showe LC. Showe MK. Classification and biomarker identification using gene network modules and support vector machines. BMC Bioinformatics. 2009;10:337. doi: 10.1186/1471-2105-10-337. [DOI] [PMC free article] [PubMed] [Google Scholar]
- Wu J, Gan M. Jiang R. Natural Computation (ICNC), 2011 Seventh International Conference on, July 2011. Vol. 3. IEEE; A genetic algorithm for optimizing subnetwork markers for the study of breast cancer metastasis; pp. 1578–1582. Vol. ). doi: 10.1109/ICNC.2011.6022270. [Google Scholar]
- Jahid MJ. Ruan J. Genomic Signal Processing and Statistics (GENSIPS), 2011 IEEE International Workshop on, December 2011 60-63. IEEE; Identification of biomarkers in breast cancer metastasis by integrating protein-protein interaction network and gene expression data. doi: 10.1109/GENSIPS.2011.6169443. [Google Scholar]
- Heiser LM, et al. Subtype and pathway specific responses to anticancer compounds in breast cancer. Proc. Natl. Acad. Sci. USA. 2012;109:2724–2729. doi: 10.1073/pnas.1018854108. [DOI] [PMC free article] [PubMed] [Google Scholar]
- Barretina J, et al. The Cancer Cell Line Encyclopedia enables predictive modelling of anticancer drug sensitivity. Nature. 2012;483:603–607. doi: 10.1038/nature11003. [DOI] [PMC free article] [PubMed] [Google Scholar]
- Garnett MJ, et al. Systematic identification of genomic markers of drug sensitivity in cancer cells. Nature. 2012;483:570–575. doi: 10.1038/nature11005. [DOI] [PMC free article] [PubMed] [Google Scholar]
- Dietterich TG. Multiple Classifier Systems. Berlin, Heidelberg: Springer-Verlag; 2000. Ensemble methods in machine learning; pp. 1–15. [Google Scholar]
- Chang CC. Lin CJ. LIBSVM: a library for support vector machines. ACM TIST. 2011;2:27. [Google Scholar]
- Ding H, Trajcevski G, Scheuermann P, Wang X. Keogh E. Querying and mining of time series data: experimental comparison of representations and distance measures. VLDB. 2008:1542–1552. [Google Scholar]
- Lu Y. Han J. Cancer classification using gene expression data. Inform. Syst. 2003:28243–28268. [Google Scholar]