Abstract
Optical spectroscopic techniques, including Raman spectroscopy, have shown promise for in vivo cancer diagnostics in a variety of organs. In this study, the potential use of a home-made Raman spectral system with a millimeter order excitation laser spot size combined with a multivariate statistical analysis for the rapid detection and discrimination of nasopharyngeal cancer from normal nasopharyngeal tissue was evaluated. Raman scattering signals were acquired from 16 normal and 32 nasopharyngeal carcinoma tissue samples. Linear discriminant analysis (LDA) based on principal component analysis (PCA) and partial least squares (PLS) were employed to generate diagnostic algorithms for the classification of different nasopharyngeal tissue types. Spectral differences in Raman spectra between the two types of tissues were revealed; the normalized intensities of Raman peaks at 1,001, 1,207 and 1,658 cm−1 were more intense for nasopharyngeal carcinoma tissue compared to normal tissue, while Raman bands at 848, 936 and 1,446 cm−1 were stronger in normal nasopharyngeal samples. The PCA-LDA algorithm together with leave-one-out cross validation yields a diagnostic sensitivity of 81% and a specificity of 87%, while the PLS method coupled with subwindow permutation analysis improves the diagnostic sensitivity and specificity to 85 and 88%, respectively. Therefore, Raman spectroscopy combined with PCA-LDA/PLS demonstrated good potential for improving the clinical diagnosis of nasopharyngeal cancers.
Keywords: discriminant analysis, nasopharyngeal carcinoma, principal component analysis, Raman spectroscopy
Introduction
Nasopharyngeal cancer is a squamous cell carcinoma that develops in the epithelial lining of the nasopharynx and has the highest incidence rates in East Asia, particularly in the Southeastern region of China, where the age-standardized incidence rate reaches 26.9/100,000 in males (1, 2). Early diagnosis and adequate treatment of nasopharyngeal cancer is crucial to increase the survival rate of the patients. Current diagnostics rely on the visualization of gross morphological changes (e.g., irregularity, modularity and anatomical location) associated with neoplastic transformation, using routine white-light reflectance endoscopy. The definitive diagnosis and staging of patients with neoplastic diseases usually requires surgical removal of tissue for histological review. It is usually difficult to identify nasopharyngeal cancer in its early stages (3, 4). Therefore, there is an urgent need to develop a fast and non-destructive technique to aid the clinical identification of early-stage nasopharyngeal cancer.
A variety of optical imaging and spectroscopic techniques, including Raman spectroscopy, are currently being investigated with the aim to improve cancer diagnosis and treatment (5–7). These techniques have the potential to provide chemical as well as morphological information and are less invasive compared to the currently available diagnostic procedures. Raman spectroscopy is an inelastic light scattering technique capable of non-destructively providing detailed quantitative chemical information on tissues at the molecular level, while the spectral signatures may unambiguously be assigned to the intra- and intercellular constituents (e.g., proteins, lipids and nucleic acids) of tissues. Compared to other optical spectroscopic techniques, such as fluorescence spectroscopy and infrared absorption spectroscopy, Raman spectroscopy is particularly amenable to in vivo measurements, as the excitation wavelengths and laser fluences used are non-destructive to the tissue and have a relatively large penetration depth. For example, ex vivo and in vivo Raman spectroscopic cancer diagnosis was demonstrated in a variety of organs, such as the brain (8), breast (9, 10), colon (11), cervix (12), gastric tissue (13), lung (14) and skin (15, 16). A number of these Raman spectroscopic investigations have been limited to micro-Raman spectroscopy and off-line post-processing. Micro-Raman spectroscopy has the advantage of high spatial resolution. However, a larger laser spot was usually adopted during clinical diagnosis, sampling a large tissue volume in the millimeter range (macro-Raman), which was very different from micro-Raman that samples a tissue volume of 1-10 micron. However, the long data acquisition time of micro-Raman makes it inadequate for efficient diagnostics. Therefore, the development of a rapid Raman signal acquisition system integrated with endoscopy for diagnosis may represent a significant advancement toward more efficient diagnosis and management of nasopharyngeal cancer patients.
In 2003, we reported a preliminary study of excised nasopharyngeal carcinoma and normal tissues from 6 patients using a fiber optic Raman system (17). In that study, our rapid Raman signal acquisition system was not optimized and only covered a narrow spectral window of 950–1,650 cm−1. The signal-to-noise ratio of the spectra was not satisfactory. Furthermore, no statistical analysis was conducted due to the limited sample size.
We recently reported our results using a micro-Raman spectroscopy system combined with discriminant analysis and principal component analysis (PCA) for the classification of nasopharyngeal carcinoma (18). In order to fully assess the Raman spectral characteristics of nasopharyngeal tissues and investigate the differences under two Raman signal acquisition systems, in this study we used an improved macro-Raman system (19) and recorded Raman spectra from 48 excised tissue samples, of which 32 were nasopharyngeal cancer tissues and 16 were normal tissues. The Raman spectral differences were analyzed in detail and statistical analysis algorithms were employed for the classification of Raman spectra from different nasopharyngeal tissue types.
Materials and methods
Subjects and protocol
A total of 48 patients from Cancer Hospital of Fujian Medical University were recruited for this study, following approval by the institutional Ethics Committee and provision of written informed consent by the participants. Spectra were obtained from 16 normal and 32 cancerous nasopharyngeal biopsies. Fresh tissue samples were stored in a-80˚C refrigerator until spectral measurements. The samples were placed on an aluminum plate and thawed at room temperature immediately prior to the experimental measurements.
Raman system
The Raman spectra of block tissues were recorded using a home-made Raman system, which has been previously described in detail (19). A 785-nm diode laser with a maximum output power of 150 mW was used for excitation and Raman spectra were recorded from 800 to 1,800 cm −1, with an integration time of 10 sec. The laser spot size focused on the targets was ∼3 mm and no notable tissue damage was observed during the measurements.
Data processing and analysis
A fifth order polynomial was fitted to the background tissue autofluorescence for each set of raw data (20). The polynomial was then subtracted from the measured spectrum to obtain the pure Raman signal. Each Raman spectrum was then normalized to the integrated area under the curve to correct variations in absolute spectral intensity and enable comparison of spectral shapes.
To assess the capability of tissue Raman spectra to differentiate cancer from normal tissue, PCA combined with linear discriminant analysis (LDA) and partial least squares-discriminant analysis (PLS-DA) were performed on the measured spectra (21). PCA is a statistical technique used for simplifying complex data sets and determining the key variables in a multidimensional data set that may best explain the differences in the observations. To reduce the dimension of the spectral data, PCA is usually employed to extract a set of orthogonal principal components (PCs) that account for the maximum variance in the dataset for further diagnosis and characterization.
Alternatively, PLS-DA may advantageously be applied for multi-class classification problems by encoding the class membership of zeros and ones, representing group affinities in an appropriate Y-indicator matrix. PLS-DA employs the fundamental principle of PCA, but further rotates the components [latent variables (LVs)] by maximizing the covariance between the spectral variation and group affinity, so that the LVs explain the diagnostic relevant variations rather than the most prominent variations in the spectral dataset. In the majority of the cases, this ensures that the diagnostically significant spectral variations are retained in the first few LVs.
In this study, the SPSS v.19 software package (SPSS, Inc., Chicago, IL, USA) was used for PCA analysis. The PC scores were used as inputs for LDA to generate a diagnostic algorithm and the performance of the PCA-LDA diagnostic algorithm was validated in an unbiased manner using leave-one-out cross validation methodology. In the validation procedure, one tissue sample was left out and the PCA-LDA modeling was redeveloped using the remaining Raman spectra. The redeveloped PCA-LDA diagnostic algorithm was then used to classify the withheld Raman spectra. This process was repeated iteratively until all withheld Raman spectra were classified.
Prior to the PLS-DA analysis, a subwindow permutation analysis (SPA) was employed for selecting an optimal combination of key wavenumbers of multi-component spectral data. SPA is an effective strategy for variable selection based on model population analysis; it has the potential to identify the informative variable or ‘peaks’. Based on the importance level of each wavelength, the corresponding variables were set as inputs and the PLS-DA diagnostic algorithm was then used to classify the withheld Raman spectra. A multivariate statistical analysis was performed using the PLS-LDA toolbox in the MATLAB (MathWorks, Inc., Natick, MA, USA) programming environment.
Results
Mean Raman spectra of normal and cancerous nasopharyngeal tissue
The mean Raman spectra of normal and malignant nasopharyngeal tissues, which were measured under the same instrumentation set-up, are shown in Fig. 1. Prominent Raman bands were observed in normal as well as malignant nasopharyngeal tissue at the following peak positions with tentative biochemical assignments: 848 cm −1 [ν (C-C) of proline], 936 cm −1 [ν (C-C) of α -helix conformation for proline and valine], 1,001 cm −1 [νs (C-C) ring breathing of phenylalanine], 1,030 cm −1, 1,085 cm −1 [ν (C-C) of lipids], 1,267 cm −1 [δ (=C-H) of phospholipids], 1,446 cm −1 [δ (CH2) of phospholipids and collagen] and 1,658 cm −1 [ν (C=C) of lipids]. The normalized intensities of Raman peaks at 1,001, 1,207 and 1,658 cm −1 were more intense for nasopharyngeal carcinoma tissue compared to normal tissue, while the Raman bands at 848, 936, 1,030, 1,267 and 1,446 cm −1 were stronger in normal nasopharyngeal samples. The independent samples t-test demonstrated significant differences for the 936, 1,001 and 1,446 cm −1 bands (P<0.05), while the differences for other bands were not statistically significant. These normalized intensity differences indicate that there is a significant increase and decrease in the percentage of distinctive biomolecules relative to the total Raman-active constituents in different tissue types, suggesting the diagnostic potential of Raman spectroscopy for identification of malignant lesions in the nasopharynx.
Figure 1.
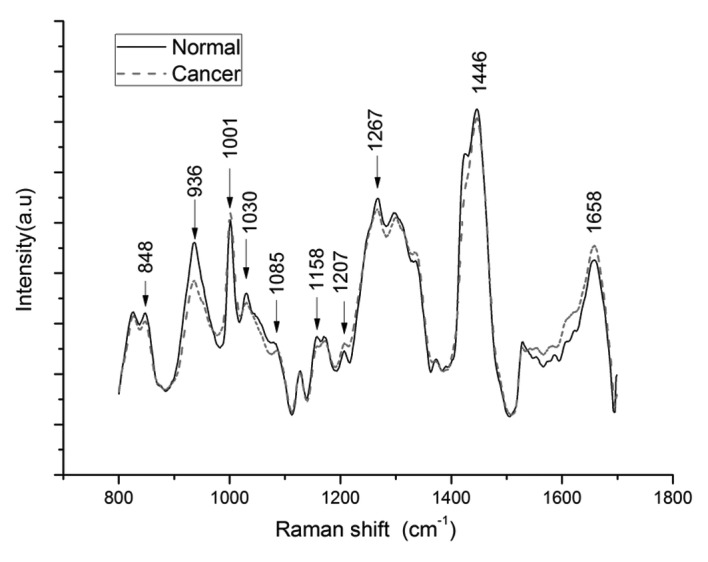
Mean Raman spectra of 16 normal and 32 cancerous nasopharyngeal tissues.
PCA-LDA and PLS-DA
To determine the most diagnostically significant characteristics for the classification of two different types of nasopharyngeal tissues, PCA-LDA and PLS-DA were performed on the standardized Raman data to identify the significant Raman spectral characteristics. The independent samples t-test on all the PC scores demonstrated that four PCs, namely PC2, PC4, PC9 and PC10, were the most diagnostically significant for discriminating normal and cancerous groups. The scatter plot of the 2nd vs. the 10th PC of the Raman spectra is presented in Fig. 2. As shown in Fig. 2, the spectra are clustered into two distinct groups, which further confirmed the significant changes in spectral profiles during the process of transformation from normal to cancerous tissue. The posterior probability of belonging to the nasopharyngeal cancer groups was calculated from the LDA model and the diagnostic sensitivity for detecting nasopharyngeal cancer was 81%, with a corresponding diagnostic specificity of 87% (Fig. 3).
Figure 2.
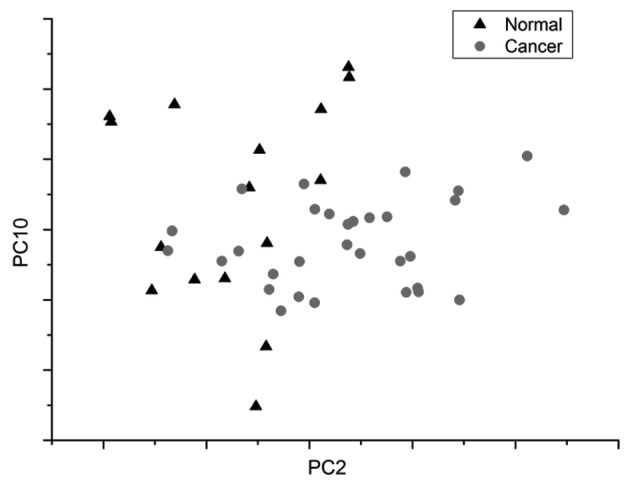
Scatter plot of the diagnostically significantly 2nd vs. 10th PC score for normal and cancerous nasopharyngeal tissue. PC, principal component.
Figure 3.
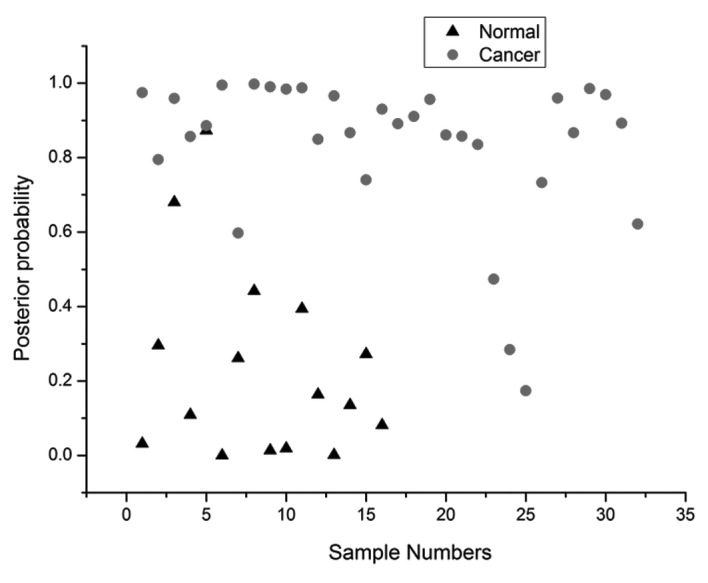
Scatter plot of the posterior probability of belonging to the nasopharyngeal cancer group for the 48 tissue samples calculated from the Raman data using the principal component analysis-linear discriminant analysis-based spectral classification using the leave-one-out cross-validation method.
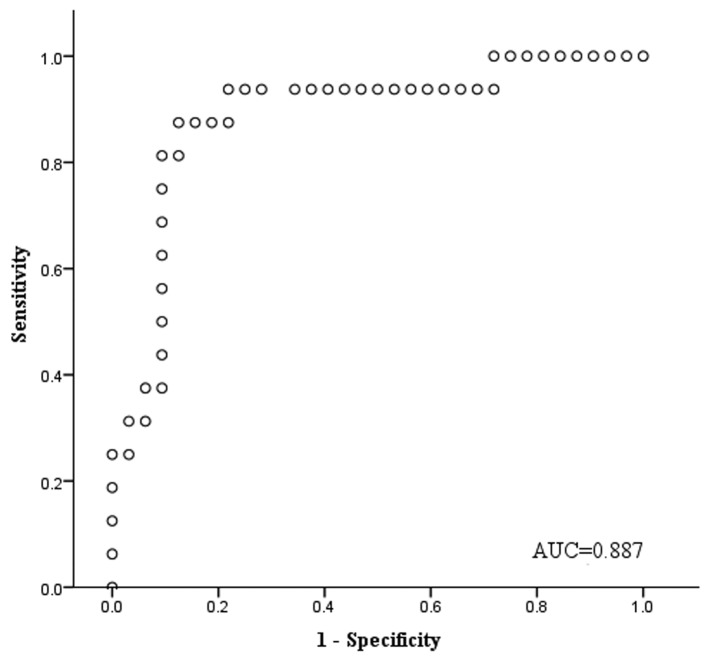
To further evaluate the performance of the PCA-LDA-based diagnostic model developed by PCA-LDA algorithms, the receiver operating characteristic (ROC) curve was generated from the posterior probability plot in Fig. 4 by varying the threshold level. The integration areas under the ROC curves were 0.887. Since the ROC curve is positively correlated with diagnostic accuracy, this result further demonstrates that PCA-LDA-based diagnostic algorithms may be used for nasopharyngeal cancer detection with good performance.
Figure 4.
Receiver operating characteristic curve of discrimination results for Raman spectra utilizing the principal component analysis-linear discriminant analysis-based spectral classification with leave-one-spectrum-out cross-validation method. AUC, area under the curve.
The PLS-DA multivariate statistical technique was also employed for differentiating cancerous from normal tissue. The PLS-DA with 5-fold double cross-validation was employed to generate the diagnostic algorithm and the first three significant LV loadings (LVs) were found to be the optimal numbers of retained components. Fig. 5 displays the score value plot for the first three LVs, illustrating good clustering with respect to tissue types, which collectively reflects a high prediction ability for the clinical outcome. The sensitivity and specificity validated by 5-fold double cross-validation were 85 and 88%, respectively.
Figure 5.
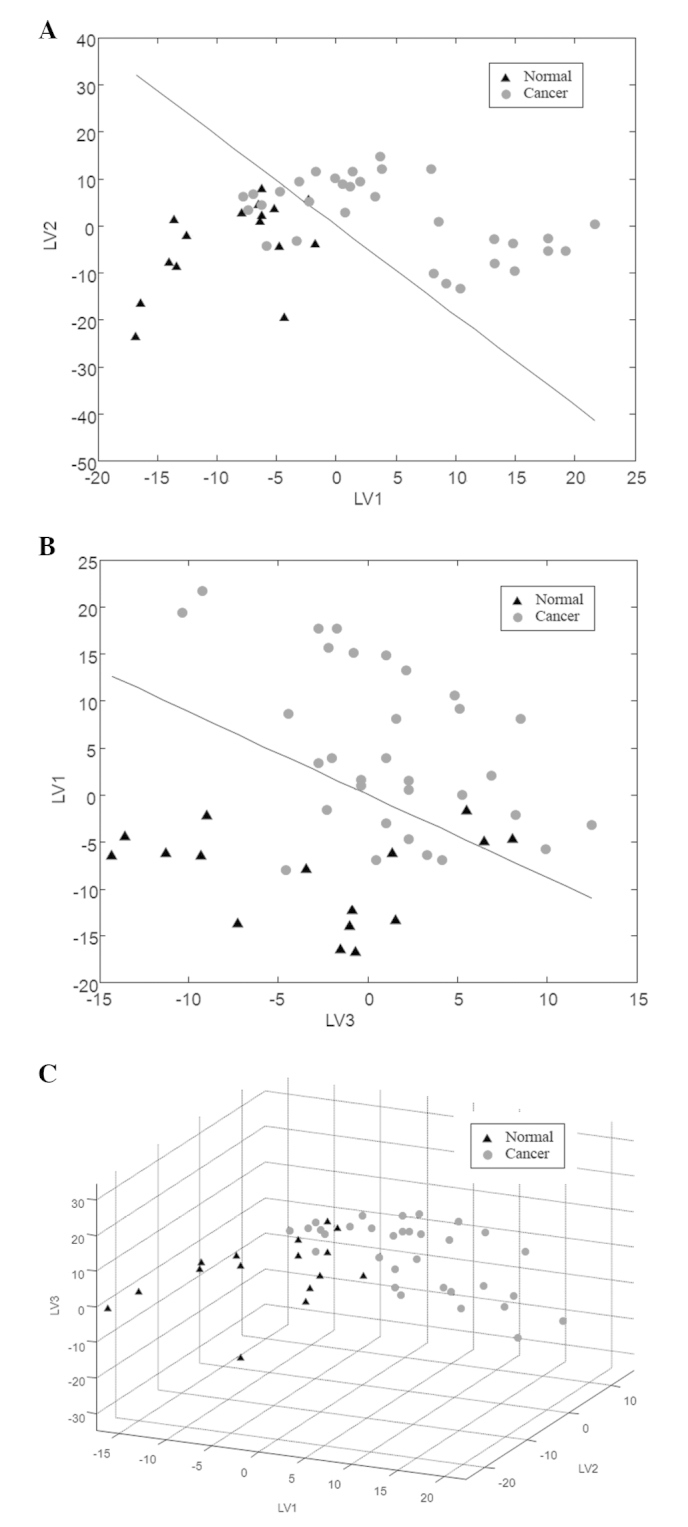
Score value plots spanned by LV1, LV2 and LV3, illustrating the intrinsic clustering of normal and malignant nasopharyngeal tissue ex vivo. LV, latent variable.
Discussion
In 2003, we conducted a preliminary study on Raman spectroscopy of nasopharyngeal tissue using a rapid Raman system, as described in Lau et al (17); the effect of signal acquisition times, biopsy size and sample depth on the quality of the spectra was also investigated. The results demonstrated consistent differences between normal and cancerous tissue in three bands, namely 1,290-1,320, 1,420-1,470 and 1,530-1,580 cm−1. In this study, we expanded the Raman spectral range to 800-1,800 cm−1, which has covered the main fingerprint region of biomolecules, with an improved profile of the Raman peaks (Fig. 1). The three bands remained, but more subtle and detailed information was revealed, such as the abovementioned variances of the Raman bands, where the normalized intensities of Raman peaks at 1,001, 1,207 and 1,658 cm−1 were more intense for nasopharyngeal carcinoma tissue compared to normal tissue, while the Raman bands at 848, 936 and 1,446 cm−1 were stronger in normal nasopharyngeal tissue samples.
We recently reported the results using a micro-Raman spectroscopy system combined with PCA and discriminant analysis for the classification of nasopharyngeal carcinoma (18). Compared to the micro-Raman spectra, the background autofluorescence was more intense in the current macro-Raman study, while the pure spectral profiles are similar after the background subtraction, although the micro-Raman spectra have a high spectral resolution and have more detailed information. The micro-Raman system has a micro-size laser spot and high laser power intensity, which may cause photobleaching during the signal collection, while in this study we used a larger laser spot of ∼3 mm in diameter, which is likely closer to the future clinical application environment. Compared to the micro-Raman results, the mean Raman peak intensities of the macro-Raman spectra at 848, 936, 1,207 and 1,658 cm−1 exhibited similar changes, while the band at 1,267 cm−1 shows the opposite trends, i.e., Raman intensities are higher in normal compared to nasopharyngeal cancer samples. Moreover, the Raman bands intensity differences for the 1,001 and 1,446 cm−1 bands were more notable compared to those in the micro-Raman spectrum and were found to be statistically significant (P<0.05).
Raman spectroscopy may provide quantitative information on the biochemical differences between normal and neoplastic tissues, which primarily contain signals related to proteins, DNA and lipids. To better understand the molecular basis, Table I lists the tentative assignments for the observed Raman bands. Raman spectra of nasopharyngeal tissue are dominated by several vibrational modes of various biomolecules (Table I), such as proteins, lipids and nucleic acids, which may be altered in quantity or confirmation associated with nasopharyngeal cancer. Distinctive spectral characteristics and relative intensity differences were observed between the cancer and normal groups, reflecting the molecular and cellular changes associated with malignant transformation. The Raman peak intensity at 936 cm−1 due to the ν (C-C) of α -helix conformation for proline and valine appears to be more intense for normal compared to nasopharyngeal cancer tissue, with the peak at 1,340 cm−1, which is likely due to the vibrational characteristics of nucleic acids being higher in cancerous compared to those in normal tissue, indicating that the cancerous tissue may be associated with an increase in the relative amounts of nucleic acids. All these changes indicate that the tissue biochemical composition and structure in the process of malignant transformation from normal to carcinoma may be reflected by Raman spectroscopy and may be a very important and useful tool for the early diagnosis of cancer.
Table I.
Tentative assignment of the main peaks from the Raman spectra of human nasopharyngeal tissue s .
| Peak position/cm−1 | Vibrational mode | Major assignments |
|---|---|---|
| 848 | ν (C-C) | Proline |
| 936 | ν (C-C) in α-helix conformation | Proline and valine |
| 1,001 | νs(C-C) breathing | Phenylalanine |
| 1,030 | δ (C-H) | Phenylalanine |
| 1,085 | ν (C-N) | Lipids, DNA |
| 1,207 | ν (C-C6H5) | Tryptophan and phenylalanine |
| 1,267 | ν (C-N), δ (=C-H) | Proteins, phospholipids |
| 1,340 | (CH3CH2) wagging | Proteins and nucleic acids |
| 1,446 | δ (CH2) | Phospholipids and collagen |
| 1,658 | ν (C=C) | Lipids |
ν, stretching mode; νs, symmetric stretching; δ, bending mode.
Irrespective of the identification and quantization of the additional molecular species present in malignant nasopharyngeal spectra, the substantial changes in the spectral profiles from normal to malignant may be effectively used for the discrimination of the two types of samples. The high dimensionality of the Raman spectral data space may result in inefficiency in implementation and optimization of conventional clustering algorithms (e.g., direct application of LDA). To reduce the dimension of the spectral data, PCA is usually employed. PCA was performed to reduce the large amount of data contained in the measured Raman spectra into a few important PCs in this study. The four most diagnostically significant PCs (PC2, PC4, PC9 and PC10) were identified with independent samples t-test on all 18 PC scores. As shown in Fig. 2, the scores of PC2 and PC10 for the normal and nasopharyngeal cancer groups formed distinct and separate clusters. We clearly observed that the clusters were distributed in separate regions, indicating that we are able to discriminate the Raman spectra between the nasopharyngeal cancer and the healthy control groups. The Raman prediction of the constructed algorithm demonstrated that malignant nasopharyngeal tissue may be differentiated from normal tissue with a diagnostic sensitivity and specificity of 81 and 87%, respectively.
While searching for the optimal statistical method for the classification of different tissue types, a supervised cluster method PLS-DA was also performed on the same data and three LVs were selected for statistical analysis. As seen in Fig. 2, the separation between the samples of normal and cancerous tissue is not ideal, whereas when using only three LVs identified by SPA, the normal samples may be significantly better separated from the cancerous samples, as shown in Fig. 5. The good clustering (Fig. 5) by using three LVs in the 5-fold double cross-validation suggested that the diagnostic algorithm was robust for the Raman spectral analysis. The performance of the PLS-DA model in terms of overall prediction accuracy, sensitivity and specificity were all improved compared to the PCA-LDA from 85, 81 and 87% to 87, 85 and 88%, respectively, indicating that variable selection is very important for building a PLS-DA classifier of good performance and SPA is potentially a viable alternative for revealing the latent possible spectral biomarkers.
In summary, Raman scattering signals were acquired from 16 normal and 32 malignant nasopharyngeal tissue samples using a rapid home-made dispersive Raman system, which has a large 3-mm laser spot suitable for clinical examinations. Distinctive spectral differences between normal and malignant nasopharyngeal tissue were identified and the Raman spectroscopic properties may be effectively translated into significant diagnostic information, providing new insights into the biochemical changes of normal and malignant nasopharyngeal tissue. Satisfactory differentiation between normal and cancerous nasopharyngeal tissues may be achieved using PCA-LDA and PLS-DA modeling. The PLS-DA algorithm exhibited a better diagnostic performance, with a sensitivity and specificity of 85 and 88%, respectively, demonstrating that Raman spectroscopy has great potential for the timely differentiation and diagnosis of nasopharyngeal cancers and provides solid support for further development of endoscopic Raman instrumentations for in vivo clinical applications.
Acknowledgements
This study was supported by grants from the Program for Changjiang Scholars and Innovative Research Team in University (no. IRT1115), the National Natural Science Foundation of China (nos. 61210016 and 61178083), the Project of Science Foundation of the Ministry of Health and the United Fujian Provincial Health and Education Project for Tackling the Key Research (no. WKJ-FJ-01) and the Canadian Institutes of Health Research International Scientific Exchange Program.
References
- 1.Wei WI, Sham JS. Nasopharyngeal carcinoma. Lancet. 2005;365:2041–2054. doi: 10.1016/S0140-6736(05)66698-6. [DOI] [PubMed] [Google Scholar]
- 2.Curado MP, Edwards B, Shin HR, Storm H, Ferlay J, Heanue M, Boyle P, editors. Cancer Incidence in Five Continents. Vol IX. IARC Scientific Publications no. 160, Lyon. :443–2007. [Google Scholar]
- 3.Sun J, Li D. Advances in management of nasopharyngeal carcinoma. Med Recapitulate. 2010;16:3255–3259. (In Chinese) [Google Scholar]
- 4.Guigay J. Advances in nasopharyngeal carcinoma. Curr Opin Oncol. 2008;20:264–269. doi: 10.1097/CCO.0b013e3282fad846. [DOI] [PubMed] [Google Scholar]
- 5.Qu JY, Wing P, Huang Z, Kwong D, Sham J, Lee SL, Ho WK, Wei WI. Preliminary study of in vivo autofluorescence of nasopharyngeal carcinoma and normal tissue. Lasers Surg Med. 2000;26:432–440. doi: 10.1002/1096-9101(2000)26:5<432::AID-LSM2>3.3.CO;2-T. [DOI] [PubMed] [Google Scholar]
- 6.Wang L, Mizaikoff B. Application of multivariate data-analysis techniques to biomedical diagnostics based on mid-infrared spectroscopy. Anal Bioanal Chem. 2008;391:1641–1654. doi: 10.1007/s00216-008-1989-9. [DOI] [PubMed] [Google Scholar]
- 7.Li SX, Chen QY, Zhang YJ, Liu ZM, Xiong HL, Guo ZY, Mai HQ, Liu SH. Detection of nasopharyngeal cancer using confocal Raman spectroscopy and genetic algorithm technique. J Biomed Opt. 2012;17:125003. doi: 10.1117/1.JBO.17.12.125003. [DOI] [PubMed] [Google Scholar]
- 8.Mizuno A, Kitajima H, Kawauchi K, Muraishi S, Ozaki Y. Near-infrared Fourier transform Raman spectroscopic study of human brain tissues and tumours. J Raman Spectrosc. 1994;25:25–29. doi: 10.1002/jrs.1250250105. [DOI] [Google Scholar]
- 9.Haka AS, Volynskaya Z, Gardecki JA, Nazemi J, Shenk R, Wang N, Dasari RR, Fitzmaurice M, Feld MS. Diagnosing breast cancer using Raman spectroscopy: prospective analysis. J Biomed Opt. 2009;14:054023. doi: 10.1117/1.3247154. [DOI] [PMC free article] [PubMed] [Google Scholar]
- 10.Chowdary MV, Kalyan Kumar K, Mathew S, Rao L, Krishna CM, Kurien J. Biochemical correlation of Raman spectra of normal, benign and malignant breast tissues: a spectral deconvolution study. Biopolymers. 2009;91:539–546. doi: 10.1002/bip.21171. [DOI] [PubMed] [Google Scholar]
- 11.Krafft C, Codrich D, Pelizzo G, Sergo V. Raman and FTIR microscopic imaging of colon tissue: a comparative study. J Biophotonics. 2008;1:154–169. doi: 10.1002/jbio.200710005. [DOI] [PubMed] [Google Scholar]
- 12.Utzinger U, Heintzelman DL, Mahadevan-Jansen A, Malpica A, Follen M, Richards-Kortum R. Near-infrared Raman spectroscopy for in vivo detection of cervical precancers. Appl Spectrosc. 2001;55:955–959. doi: 10.1366/0003702011953018. [DOI] [Google Scholar]
- 13.Feng S, Chen R, Lin J, Pan J, Wu Y, Li Y, Chen J, Zeng H. Gastric cancer detection based on blood plasma surface-enhanced Raman spectroscopy excited by polarized laser light. Biosens Bioelectron. 2011;26:3167–3174. doi: 10.1016/j.bios.2010.12.020. [DOI] [PubMed] [Google Scholar]
- 14.Short MA, Lam S, McWilliams A, Zhao J, Lui H, Zeng H. Development and preliminary results of an endoscopic Raman probe for potential in vivo diagnosis of lung cancers. Opt Lett. 2008;33:711–713. doi: 10.1364/OL.33.000711. [DOI] [PubMed] [Google Scholar]
- 15.Lieber CA, Majumder SK, Billheimer D, Ellis DL, Mahadevan-Jansen A. Raman microspectroscopy for skin cancer detection in vitro. J Biomed Opt. 2008;13:024013. doi: 10.1117/1.2899155. [DOI] [PubMed] [Google Scholar]
- 16.Lui H, Zhao J, McLean D, Zeng H. Real-time Raman spectroscopy for in vivo skin cancer diagnosis. Cancer Res. 2012;72:2491–2500. doi: 10.1158/0008-5472.CAN-11-4061. [DOI] [PubMed] [Google Scholar]
- 17.Lau DP, Huang Z, Lui H, Man CS, Berean K, Morrison MD, Zeng H. Raman spectroscopy for optical diagnosis in normal and cancerous tissue of the nasopharynx - preliminary findings. Lasers Surg Med. 2003;32:210–214. doi: 10.1002/lsm.10084. [DOI] [PubMed] [Google Scholar]
- 18.Li Y, Pan J, Chen G, et al. Micro-Raman spectroscopy study of cancerous and normal nasopharyngeal tissues. J Biomed Opt. 2013;18:27003. doi: 10.1117/1.JBO.18.2.027003. [DOI] [PubMed] [Google Scholar]
- 19.Huang W, Pan JJ, Chen R, Li YZ, Feng SY, Xie SS, Zeng HS. Measurement of nasopharyngeal carcinoma tissue ex vivo by Raman spectroscopy. Guang Pu Xue Yu Guang Pu Fen Xi. 2009;29:1304–1307. (In Chinese) [PubMed] [Google Scholar]
- 20.Zhao J, Lui H, McLean DI, Zeng H. Automated autofluorescence background subtraction algorithm for biomedical Raman spectroscopy. Appl Spectrosc. 2007;61:1225–1232. doi: 10.1366/000370207782597003. [DOI] [PubMed] [Google Scholar]
- 21.Li H, Zeng M, Tan B, Liang Y, Xu Q, Cao D. Recipe for revealing informative metabolites based on model population analysis. Metabolomics. 2010;6:353–361. doi: 10.1007/s11306-010-0213-z. [DOI] [Google Scholar]


