

Abstract
Background
Detection, isolation and enumeration of circulating tumor cells (CTCs) from cancer patients has become an important modality in clinical management of patients with breast cancer. Although CellSearch, an EpCAM based method that is used to isolate epithelial CTCs has gained immense importance, its inability to detect mesenchymal CTCs from breast cancer patients raises concerns for its utility as a clinical management tool.
Methods
To address this gap in technology, we recently discovered the utility of cell-surface vimentin (CSV) as a marker for detecting mesenchymal CTC from sarcoma tumors. Here in this study, we tested the sensitivity and specificity of detecting CTC from blood collected at a random time during therapy from each of the 58 patients with metastatic breast cancer utilizing 84-1 (mAb against CSV to detect epithelial mesenchymal transitioned CTC) and CellSearch methods. Also we tested the possibility of improving the sensitivity and specificity of detection using additional parameters including nuclear EpCAM localization and epithelial mesenchymal ratios.
Results
CTC counts using CSV were significant in differentiating treatment responding (stable) and treatment non-responding (progression) populations in comparison to the CellSearch method. The results also indicated that a summation of CTCs detected from both methods with a threshold of 8 CTCs/7.5mL increased the specificity of CTC detection substantially in comparison with other tested combinations as determined by ROC curves.
Conclusions
Collectively, utilizing a summation of CellSearch and CSV methods provide new insights into using CTC enumeration to assess therapeutic response and thus provides a new approach to personalized medicine in breast cancer patients.
Keywords: Circulating tumor cells, Breast cancer, Vimentin, EMT
Introduction
Dissemination of tumor cells from the primary site is the main cause for cancer related deaths. Metastatic cascade involves a variety of steps in which the tumor cells from primary tumor site get dislodged into the blood stream and reach distant sites and colonize. Circulating tumor cells (CTCs) are the rare tumor cells that circulate in blood of cancer patients (1). In the recent years accumulating reports have suggested the use of CTCs to detect and predict the spread of cancer (2, 3). Although there have been a large number of CTC related reports, there are very few reports that indicate the use of CTCs to predict the therapeutic outcome (responding or non-responding) in patients treated with different therapeutic agents (4, 5). Since CTCs are gaining increasing potential in understanding the disease and therapeutic outcomes, there are new modalities under development that can be used to detect, enumerate and isolate CTCs from blood of patients and is worth running for, as described by Lianidou (6). There are a lot of state-of-the-art CTC technologies that are tested for CTC detection from patients (7), however, to date the only technique for enumerating CTCs from patients in the clinic is the CellSearch technology that has been cleared by FDA for CTC test for metastatic breast cancer, metastatic prostate cancer and metastatic colorectal cancer (8). CellSearch captures CTCs from blood of cancer patients by targeting EpCAM.
Though current advances in technologies are able to isolate CTCs using EpCAM as a marker, they are essentially omitting the metastasis causing CTCs that tend to have an EMT phenotype that are over-looked by EpCAM based technologies (9). We have recently reported cell-surface vimentin (CSV) as a universal marker to detect mesenchymal tumor derived CTC (10). Since CSV is a very specific and sensitive marker to detect mesenchymal CTCs, we used the same concept to detect CTCs that have undergone EMT (11). Here in this manuscript for the first time we report the detection of EMT CTC from metastatic breast cancer patients with high specificity and sensitivity. Also, we tested additional approaches to improve sensitivity and specificity of CTC detection, thereby improving clinical assessment of therapeutic response.
Materials and Methods
Patients and study design
This study was approved by our institutional review board. Informed and written consent was obtained from all the patients involved in this retrospective study. Peripheral blood from 58 breast cancer patients was collected for this study. These patients were diagnosed and treated for metastatic breast cancer. Clinco-pathological information was recorded for all the patients at the time of blood collection. Response Evaluation Criteria in Solid Tumors (RECIST) guidelines were utilized to evaluate the disease status of the patient (responding/ stable and non-responding/ progression). Since this is a pilot study for the detection of EMT CTC from metastatic breast cancer patients and predicting the therapeutic outcome, patients recruited were at different cycles of treatment and blood was collected at a random time point during routine evaluation. Based on therapeutic outcome at the time of blood collection using the RECIST criteria, the patients were classified into responding/stable and non-responding/progression populations. For each patient, 2 tubes of 7.5mL blood were collected in CellSave (Janssen Diagnostics LLC, NJ, USA) collection tubes for the CellSearch test. One blood sample was used for enumeration of CTCs using CellSearch and the left over sample was utilized for enumeration of CTCs using 84-1 monoclonal antibody.
Enumeration of CTC by CellSearch
CTC enumeration by CellSearch was carried out according to the manufacturer's protocol and training. Detailed methods of enumeration and cell counting by pathologist have been described elsewhere (12).
Enumeration of CTC by 84-1 antibody
CTC enumeration using 84-1 antibody was carried out as previously reported (10). Briefly, after mononucleated cell isolation using BD CPT vacutainer tube, CD45 positive cells were depleted using EasySep™ Human CD45 Depletion Kit (Stem cell technologies) according to manufacturer's recommendation. To minimize nonspecific binding, antibody against human Fc receptor was added to the cocktail. Second, the CD45-ve cell fraction was subjected to 84-1 positive selection. Briefly, cells were labeled with 84-1 antibody and later mouse IgG binding microbeads (Miltenyi Biotec) were added to the mixture. 84-1 +ve cells were then extracted using the magnetic column from Miltenyi Biotec according to manufacturer's recommendation. The cells thus obtained are 84-1 +ve, CD45 –ve. These cells were further validated using immunostaining for 84-1 (species: mouse) and CD45 (species: rabbit) by taking images using confocal microscopy and screening for cells with a nucleus size of >8 μm. For EMT characterization, these cells were also stained for EMT markers Twist, Snail and FOXC2 (R&D Systems), and for epithelial specific markers EpCAM and E-cadherin (Cell Signaling). Two independent researchers were involved in the detection and enumeration of CTCs to prevent any user variability. In samples where in there were different amount of blood than 7.5 mL (lower than anticipated), the CTC counts were normalized in order to express the CTC counts in 7.5 mL. A heat map of CTC counts from both methods was generated using matrix2png interface (http://www.chibi.ubc.ca/matrix2png/bin/matrix2png.cgi) (13).
Nuclear EpCAM staining
After CD45 depletion and 84-1 selection, cells were plated on a glass slide with Cytofuge (Iris). For intracellular EpCAM staining, cells were fixed using 4% paraformaldehyde for 15 min, washed with PBS (pH 7.4), and permeabilized in PBS (pH 7.4)/0.2% NP40 (Sigma Aldrich) for 20 min. These cells were then blocked in 10% fetal calf serum (Gibco, Invitrogen) for 1 h, and labeled with EpCAM, 84-1 or CD45 primary antibody (1:100) overnight at 4°C. Cells were then rinsed in PBS (pH 7.4) and stained with Alexa Fluor-555 secondary antibodies (Invitrogen) (1:250) for EpCAM (species: rabbit), Alexa Fluor-647 for 84-1 (species: mouse). For nuclei staining, Sytox Green (Invitrogen) (1:1000) was incorporated along with secondary antibody for 60 min. The cells were then washed with PBS (pH 7.4) three times for 15 min each and mounted in Slow fade antifade (Invitrogen). For confocal analysis, images were acquired in 8 bits with the Zeiss LSM 510 confocal microscope using LSM 5 3.2 image capture and analysis software (Zeiss). A 63× water-immersion objective lens (NA, 1.0) was used with digital zoom for image capture. All images were acquired by the same operator using the same intensity and photo detector gain in order to allow quantitative comparisons of relative levels of immunoreactivity between different samples.
Statistical Methods
Statistical analysis was performed using GraphPad Prism 5.0 (La Jolla, CA). Analysis of two groups of data for the differences between the means was determined using a student's t test. Correlations between both the methods were assessed by κ-test. Diagnostic performance of CTC count using either of the methods was assessed by constructing a receiver operating characteristic (ROC) curve, and was further evaluated by calculating the area under each ROC curve (AUC-ROC). An AUC-ROC of value 1 denotes that the test method is able to discriminate perfectly, while an AUC-ROC of value 0.5 would denote a worst discrimination of the test. P value was calculated for the difference between each AUC-ROC. In all cases a P value of < 0.05 was considered to be statistically significant.
Results
Comparison of data obtained from CellSearch and 84-1 isolation methods
A total of 58 patient (Supplementary Table 1) blood samples were analyzed in this study using both CSV and CellSearch methods (Supplementary Table 2). Patients were classified into treatment responding/stable or treatment non-responding/progressive populations for validating the role of CTCs in predicting therapeutic response. This classification was determined by the clinician for the patient at the time of sample collection. Using a pre-determined cut off value of 5 CTCs/ 7.5 mL of blood sample (based on CellSearch method), our results (Fig. 1A) showed that using 84-1 antibody we were able to significantly distinguish stable and progressive population with high sensitivity (85%) and specificity (94.45%). This data for the first time shows that CSV is a highly evolved and sensitive marker for predicting therapeutic response in breast cancer patients. Also the detected CTCs were tested for the presence of EMT specific markers and the results indicated the expression of Snail, Twist and FOXC2 in these CTC, while epithelial specific markers EpCAM and E-cadherin were down-regulated in these CTC (Supplementary Figure 1). In comparison to CSV method, CellSearch (Fig. 1B) did not show any significant difference in distinguishing the stable and progressive population for the same set of samples. The sensitivity (47.5%) was too low, while specificity (83.35%) of detection was lower compared to CSV method. This discrepancy in the detection of lower number of CTCs in the progressive population is potentially due to CTCs that have lost the epithelial nature and are gaining more mesenchymal phenotype (EMT) that limits EpCAM mediated detection. Also, given that EMT is a characteristic of drug resistant cancer cells, it is essential that we capture the EMT CTC population for predicting therapeutic response.
Figure 1.
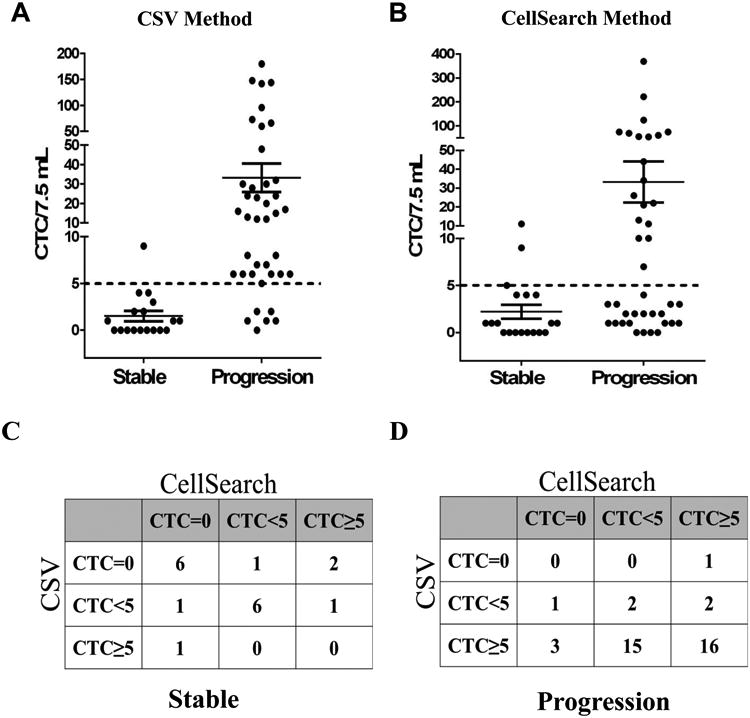
Enumeration of CTCs using CSV and CellSearch method from 58 breast cancer patients. Patients were divided into progressive and stable categories based on clinical evaluations. CTC counts were plotted per 7.5 mL of blood. Dashed line indicates a threshold of 5CTCs/ 7.5mL. A. CTC Enumeration using CSV method (P =0.0053). B. CTC enumeration using CellSearch method (P=0.0564). C, D. A concordance analysis between both the techniques revealed an agreement of 66.67% in identifying the stable population (C), while an agreement of 45% in identifying the progressive population (D). The degree of agreement between both the techniques is poor for progressive population, while degree of agreement is moderate in the detection of stable population.
Concordance between the two techniques
In order to examine the concordance between the techniques, we classified patient CTCs analyzed by both techniques into three different groups: patients with CTC counts = 0 (Group I), patients with CTC counts <5 (Group II) and patients with CTC counts ≥ 5 (Group III). This analysis was done for 2 different sets of patient population: responding/stable (Fig. 1C) and non-responding/progression (Fig. 1D). Using κ-test, we determined that in stable population there was a 66.67% agreement, while a poor 45% agreement between both the techniques for progressive population (Supplementary Notes 1 & Supplementary Table 3). Overall, CSV method was very effective in identifying the non-responding/ progression population, while both methods were equally successful in identifying the responding/stable population. Taken together, CSV is a good marker to identify and isolate CTCs from patients that show no response to therapy and thus act as early indicators of non-responding population.
Summation and Average of CTC counts from both methods
Our goal for this study was to maximize the sensitivity of method to predict progression population with greater efficiency and to minimize possible false negatives. To achieve this goal, we first tested the sensitivity by averaging the counts from both techniques (Fig. 2A); however the results did not significantly improve the predictions. Since CellSearch detects epithelial population and CSV can detect the EMT transitioned mesenchymal population, we tested the possibility of summing both CellSearch and CSV CTC counts for better understanding of the relationship between CTC count (from both epithelial and EMT CTC population) and therapeutic response. From the analysis (Fig.2B) it can be seen that there were only 3/40 patients with progressive disease that showed CTCs <5, however, interestingly there were 7 patients in the stable population that showed CTCs ≥5. This method of detection was significantly better than the method of averages and has improved sensitivity (92.5%) in detection of the progressive population. Also, data analyzed in form of a heat map (Fig. 2C) depicting the CTC counts from individual methods and the summation method indicates better prediction of disease progression in patients when using summation of both methods as compared to that of the individual ones. Since specificity of detection using combination of CTC counts was low, we tested a possibility of increasing the threshold for the sum of CTCs from both techniques to higher value and then calculating the sensitivity and specificity values as determined using ROC curves (Supplementary Figure 2). As per our analysis, a threshold of 8 CTCs/7.5mL increased the specificity of detection from 61.12% (for 5 CTCs/7.5 mL threshold) to 83.33%, without sacrificing and changing the sensitivity of detection [threshold data for 6, 7, 9 CTCs/ 7.5 mL did not provide high specificity (data not shown)]. Thus, increasing the threshold of the sum of CTC counts to 8 CTCs/7.5mL provides more sensitive as well as specific detection method.
Figure 2.
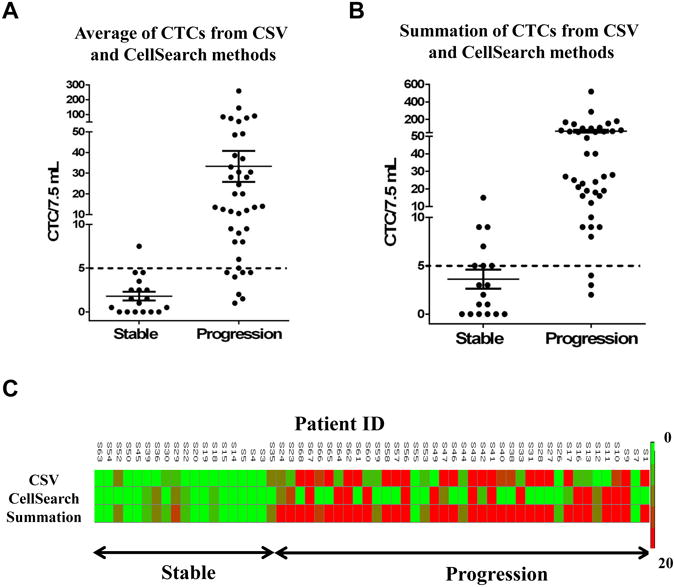
Enumeration of CTCs using both methods. Patients were divided into progressive and stable categories based on clinical evaluations. CTC counts were plotted per 7.5 mL of blood. Dashed line indicates a threshold of 5CTCs/ 7.5mL. (A) Average of CTCs from both methods, (B) Sum of CTCs from both methods. (C) Heat map depicting the CTC counts enumerated using CSV method, CellSearch method and using a sum of both CSV and CellSearch methods with gradient of CTC counts from 0 (green) to 20 (red) CTCs/7.5mL. These samples were divided into patients with stable disease or progressive disease.
CTC counts and receptor status
Simultaneously, we have analyzed the relationship of receptor status of the patient and CTC counts from each of the methods. Four different subtypes (based on receptor status) of breast cancer were tested: Triple negative, Luminal A, Luminal B and HER2 type were analyzed (Supplementary Table 4). Due to the low sample size of Luminal B and HER2 type, we have limited our sensitivity and specificity calculations to Luminal A and triple negative subtypes (Supplementary Table 5). Our data indicates, the CSV method can detect both of these subtypes with high sensitivity and specificity in comparison to that of the CellSearch method. As expected, inclusion of sum of CTC counts increases the sensitivity (triple negative: 83.33%, Luminal A: 95.83%), but shows a lower specificity (triple negative: 25%, Luminal A: 72.73%). By increasing the threshold for sum of CTCs to 8 CTCs/7.5 mL, there is an increase in specificity alone without affecting the sensitivity. Specificity for triple negative increases from 25% to 75%, while for Luminal A there is an increase from 72.73% to 81.82%. Together, the use of combination of CTC counts from both the techniques with a new threshold of 8 CTCs/ 7.5 mL of blood provides a higher sensitivity and specificity for the detection method. Since Luminal A subtype is the predominant type of breast cancer and triple negative type are most difficult to treat, it is important that the detection technologies are able to differentiate these with high sensitivity and specificity, a goal achievable by combination of CSV and CellSearch CTC counts.
E/M or M/E ratios and nuclear EpCAM for predicting therapeutic response
We also tested the possibility of improving the sensitivity and specificity of detection using additional parameters. First we tested if the ratio of mesenchymal to epithelial content would serve an indicator of therapeutic response as suggested by Yu et al (14). In order to test this possibility, we combined both the counts and divided them into CellSearch based epithelial (blue) and CSV based mesenchymal (red) fractions (Fig. 3A) Ratio based analysis indicated that 18/40 patients showed a M/E ratio ≥ 1 (> 50% of mesenchymal fraction) in the progressive population, while 14/18 patients showed a M/E ratio < 1 (>50% of the epithelial fraction) in stable population. Although this method of analysis is a good way to predict the therapeutic response, it does not provide improvement of statistical significance in our analysis. Second, we tested if detection of nuclear EpCAM in CTCs improves specificity and sensitivity of detection. One of the possible explanations for the loss of surface EpCAM in EMT CTC could be the translocation of EpCAM from surface into the nucleus that imparts an increasing proliferative and metastatic potential to these cells, as evidenced by increased cell proliferation and tumor formation in mice (15). This potential of nuclear EpCAM is attributed to its ability to bind and regulate Wnt signaling partners. To date, there is no single report on characterizing the nuclear EpCAM expression in CTCs. To test this, we characterized the expression of nuclear EpCAM in CTC from 20 patient blood samples isolated using CSV method. During our investigation, it was interesting to observe that these CTCs differed in terms of their EpCAM localization especially with reference to the disease status. As seen in the Fig. 3B, most of the stable patients CTCs were devoid of EpCAM expression, while few exhibited cytoplasmic EpCAM only. Interestingly, majority of the progressive population CTCs exhibited nuclear EpCAM expression only. Our analysis of nuclear EpCAM expression in these CTCs indicated that detection of nuclear EpCAM is associated with continued progression of disease. This nuclear EpCAM expression is usually ignored in a majority of studies since in the field of CTC detection, only surface EpCAM is of major significance. The results from pilot study of 20 samples (Fig. 3C and Supplementary Table 6) showed a sensitivity of 86.67% and 80% specificity in detecting the therapeutic response in these patients (Supplementary Table 7). Since there was no increase in specificity of detection using either of these possibilities, we concluded that utilizing sum of CSV and CellSearch detection technologies with a threshold cutoff of 8CTC/7.5mL provides highest sensitivity and specificity of detection.
Figure 3.
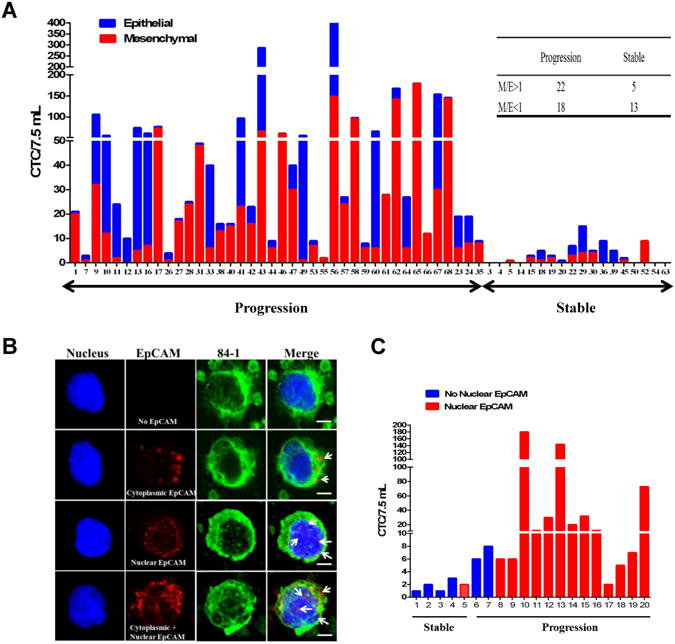
(A) Graphical representation of CTC counts (in 7.5 mL) enumerated from both CSV and CellSearch techniques that were divided into epithelial (blue) and mesenchymal (red) phenotypes based on the method used for isolation. Samples were divided into patients with stable disease or progressive disease. (B) CTCs isolated using 84-1 method were fixed and permeabilized, stained for EpCAM (red), 84-1 (green) and nucleus (Sytox) and using confocal microscopy. Arrows indicate the localization of nuclear EpCAM in CTC. Scale bar, 10 μm. (C) Graphical representation of CTC counts (in 7.5 mL) enumerated using CSV method and CTCs were divided into no-nuclear EpCAM (blue) and nuclear EpCAM (red) phenotypes based on nuclear EpCAM status. Samples were divided into patients with stable disease or progressive disease.
Discussion
EMT in breast cancer is associated with increased aggression and metastatic phenotype (16). It therefore becomes necessary to detect EMT CTCs, which may be the ‘seed’ cells of metastasis. Major hindrance in the detection of EMT CTCs is the scarce availability of surface specific markers that can be used to isolate these. We have recently detected mesenchymal CTC from sarcoma patients using 84-1 mAb that specifically detects CSV on surface of mesenchymal CTC and does not detect any normal cells in the blood, that has been validated using mutational and marker based analysis (10). Since EMT CTC and mesenchymal CTC share similar gene expression markers, we tested whether 84-1 antibody can capture/detect EMT CTCs from breast cancer patients. Our analysis showed that 84-1 antibody can capture/detect EMT CTC with high specificity and sensitivity because the captured CTCs contain a high level of EMT marker gene expression (Supplementary figure 1). However, there remains a small possibility of CTCs that have partially undergone EMT which could be detected by either of the techniques and this possibility will be researched into and analyzed in detail in a follow-up study with a baseline data to compare with.
Since this is a pilot study for detection of EMT CTC from patients, only one time point and 58 patients were considered for CTC evaluation regardless of the treatment stages (Supplementary table 8). Even with such a single time point without considering the treatment stages, the EMT CTC number is clearly associated with the therapeutic outcome, which was evaluated by clinician at time of blood collection. Since CellSearch detection is based on EpCAM and detects non-EMT CTCs while the 84-1 unraveled here detects EMT CTCs, the total number of CTC detected by these two methods from the same blood sample are increased (Fig. 2B).Therefore, we attempted to increase the threshold of cut-off which is usually 5 CTCs/ 7.5mL for CellSearch to 8 CTCs/ 7.5 mL that showed better sensitivity and specificity in case of detecting both EMT and epithelial CTC together as determined by ROC curves. Since this is the first study to consider an increase in threshold, we are further testing this by validating in other cancer types.
Other modalities of increasing the specificity and sensitivity of the methods were tested here that include the nuclear EpCAM localization and epithelial mesenchymal ratios. It is interesting to note that most of the EpCAM detection in CTCs detected by 84-1 method is localized in the nucleus. Although this is only a pilot study and there was a low sensitivity and specificity in comparison to that of the combination methods, it is important to note that nuclear EpCAM is associated with increasing metastatic potential (15) and should be considered as an important criterion in the evaluation of CTCs. Yu et al (17), have shown that circulating breast tumor cells exhibit dynamic changes in epithelial and mesenchymal composition and there was a reversible shift between these cell fates for each cycle of response to therapy and disease progression. In our study we tested if we can improve the sensitivities and specificities of the methods using the ratio between CTCs isolated using both the methods. Although there was significant increase in mesenchymal CTCs in progressive population, this method did not provide a statistical significance in our analysis which could be attributed to the low number of samples that were used for this analysis. This method will be evaluated again in a large scale study to achieve statistical significance.
Although we have reported detection of CSV limited to cancer cells (10), it still remains a mystery as to how this protein is localized to the surface of cancer cells only and what its role would be? In our recent publication (10), we reported a possible role of phosphorylation of vimentin that could promote the transport of vimentin to cell surface. Also, there is a likelihood of tumor microenvironment influencing an unknown signaling mechanism that can induce cell surface localization of vimentin. Investigations in these areas will provide further information on the mechanism of cell surface transport of vimentin.
In conclusion, it is evident that the summation of CTC counts from both CellSearch and CSV emerges as a much stronger and reliable predictor for therapeutic outcome in metastatic breast cancer patients undergoing therapy. Since CTCs are heterogeneous cells with both epithelial and mesenchymal (EMT) phenotypes, it is very important that we take both of these populations into consideration while analyzing the therapeutic response of different chemotherapeutic regimens in patients. Majority of the studies directed towards understanding the role of CTCs in measuring therapeutic response have not taken into account both the phenotypes for evaluation which leads to more biased results, since mainstream of breast cancer CTC studies have utilized CellSearch system that detects only EpCAM positive cells and does not detect EMT CTC, which have increased metastatic potential. Long term goal of our lab is to sequentially collect samples at first diagnosis, pre-surgery, post-surgery and follow-up so as to acquire a prognostic significance. In this age of biologically targeted therapeutics, we can take advantage of this dual system to detect, isolate and characterize CTCs of different phenotypes at the same time, which sheds vital information that holds a key to personalized medicine in breast cancer patients. These results taken together provide a novel approach for the use of CTC enumeration for clinical management of patients with primary consideration towards therapeutic response.
Supplementary Material
Table 1. Analysis of Sensitivity, Specificity, Positive Predictive Value, and Negative Predictive Value for different methods.
| Method | Sensitivity | Specificity | Positive Predictive Value | Negative Predictive Value |
|---|---|---|---|---|
| CSV | 85% | 94.45% | 97.14% | 73.91% |
| CellSearch | 47.50% | 83.35% | 86.37% | 41.67% |
| Average | 82.50% | 94.45% | 97.06% | 70.84% |
| Summation (Th 5) | 92.50% | 61.12% | 84.09% | 78.57% |
| Summation (Th 8) | 92.5% | 83.33% | 92.5% | 83.33% |
| Ratio | 55% | 72.23% | 81.49% | 41.94% |
CSV: Cell-surface vimentin method, Average: average of CTC counts from CSV and CellSearch methods, Summation: sum of CTC counts from CSV and CellSearch Methods
Ratio: ratio of CTC counts from CSV and CellSearch methods in terms of Epithelial to Mesenchymal ratios
Summation (Th 5) indicates a threshold of 5 CTCs/ 7.5 mL as cutoff. Summation (Th 8) indicates a threshold of 8 CTCs/ 7.5 mL as cutoff.
Abbreviations
- CTC
Circulating tumor cells
- CSV
Cell-surface vimentin
References
- 1.Alix-Panabieres C, Pantel K. Circulating tumor cells: Liquid biopsy of cancer. Clinical chemistry. 2013;59:110–8. doi: 10.1373/clinchem.2012.194258. [DOI] [PubMed] [Google Scholar]
- 2.Allard WJ, Matera J, Miller MC, Repollet M, Connelly MC, Rao C, et al. Tumor cells circulate in the peripheral blood of all major carcinomas but not in healthy subjects or patients with nonmalignant diseases. Clinical cancer research : an official journal of the American Association for Cancer Research. 2004;10:6897–904. doi: 10.1158/1078-0432.CCR-04-0378. [DOI] [PubMed] [Google Scholar]
- 3.Cristofanilli M, Budd GT, Ellis MJ, Stopeck A, Matera J, Miller MC, et al. Circulating tumor cells, disease progression, and survival in metastatic breast cancer. The New England journal of medicine. 2004;351:781–91. doi: 10.1056/NEJMoa040766. [DOI] [PubMed] [Google Scholar]
- 4.Urtishak S, Alpaugh RK, Weiner LM, Swaby RF. Clinical utility of circulating tumor cells: A role for monitoring response to therapy and drug development. Biomarkers in medicine. 2008;2:137–45. doi: 10.2217/17520363.2.2.137. [DOI] [PubMed] [Google Scholar]
- 5.Riethdorf S, Muller V, Zhang L, Rau T, Loibl S, Komor M, et al. Detection and her2 expression of circulating tumor cells: Prospective monitoring in breast cancer patients treated in the neoadjuvant geparquattro trial. Clinical cancer research : an official journal of the American Association for Cancer Research. 2010;16:2634–45. doi: 10.1158/1078-0432.CCR-09-2042. [DOI] [PubMed] [Google Scholar]
- 6.Lianidou ES. Circulating tumor cell isolation: A marathon race worth running. Clinical chemistry. 2014;60:287–9. doi: 10.1373/clinchem.2013.216010. [DOI] [PubMed] [Google Scholar]
- 7.Lowes LE, Allan AL. Recent advances in the molecular characterization of circulating tumor cells. Cancers. 2014;6:595–624. doi: 10.3390/cancers6010595. [DOI] [PMC free article] [PubMed] [Google Scholar]
- 8.Riethdorf S, Fritsche H, Muller V, Rau T, Schindlbeck C, Rack B, et al. Detection of circulating tumor cells in peripheral blood of patients with metastatic breast cancer: A validation study of the cellsearch system. Clinical cancer research : an official journal of the American Association for Cancer Research. 2007;13:920–8. doi: 10.1158/1078-0432.CCR-06-1695. [DOI] [PubMed] [Google Scholar]
- 9.Sieuwerts AM, Kraan J, Bolt J, van der Spoel P, Elstrodt F, Schutte M, et al. Anti-epithelial cell adhesion molecule antibodies and the detection of circulating normal-like breast tumor cells. Journal of the National Cancer Institute. 2009;101:61–6. doi: 10.1093/jnci/djn419. [DOI] [PMC free article] [PubMed] [Google Scholar]
- 10.Satelli A, Mitra A, Cutrera JJ, Devarie M, Xia X, Ingram DR, et al. Universal marker and detection tool for human sarcoma circulating tumor cells. Cancer research. 2014;74:1645–50. doi: 10.1158/0008-5472.CAN-13-1739. [DOI] [PMC free article] [PubMed] [Google Scholar]
- 11.Satelli A, Li S. Vimentin in cancer and its potential as a molecular target for cancer therapy. Cellular and molecular life sciences : CMLS. 2011;68:3033–46. doi: 10.1007/s00018-011-0735-1. [DOI] [PMC free article] [PubMed] [Google Scholar]
- 12.Farace F, Massard C, Vimond N, Drusch F, Jacques N, Billiot F, et al. A direct comparison of cellsearch and iset for circulating tumour-cell detection in patients with metastatic carcinomas. British journal of cancer. 2011;105:847–53. doi: 10.1038/bjc.2011.294. [DOI] [PMC free article] [PubMed] [Google Scholar]
- 13.Pavlidis P, Noble WS. Matrix2png: A utility for visualizing matrix data. Bioinformatics. 2003;19:295–6. doi: 10.1093/bioinformatics/19.2.295. [DOI] [PubMed] [Google Scholar]
- 14.Li YM, Xu SC, Li J, Han KQ, Pi HF, Zheng L, et al. Epithelial-mesenchymal transition markers expressed in circulating tumor cells in hepatocellular carcinoma patients with different stages of disease. Cell death & disease. 2013;4:e831. doi: 10.1038/cddis.2013.347. [DOI] [PMC free article] [PubMed] [Google Scholar]
- 15.Maetzel D, Denzel S, Mack B, Canis M, Went P, Benk M, et al. Nuclear signalling by tumour-associated antigen epcam. Nature cell biology. 2009;11:162–71. doi: 10.1038/ncb1824. [DOI] [PubMed] [Google Scholar]
- 16.Sarrio D, Rodriguez-Pinilla SM, Hardisson D, Cano A, Moreno-Bueno G, Palacios J. Epithelial-mesenchymal transition in breast cancer relates to the basal-like phenotype. Cancer research. 2008;68:989–97. doi: 10.1158/0008-5472.CAN-07-2017. [DOI] [PubMed] [Google Scholar]
- 17.Yu M, Bardia A, Wittner BS, Stott SL, Smas ME, Ting DT, et al. Circulating breast tumor cells exhibit dynamic changes in epithelial and mesenchymal composition. Science. 2013;339:580–4. doi: 10.1126/science.1228522. [DOI] [PMC free article] [PubMed] [Google Scholar]
Associated Data
This section collects any data citations, data availability statements, or supplementary materials included in this article.