

Abstract
Superoxide dismutase (SOD) is a major defender against excessive superoxide generated under hyperglycemia. We have recently reported that renal SOD1 (cytosolic CuZn-SOD) and SOD3 (extracellular CuZn-SOD) isoenzymes are remarkably down-regulated in KK/Ta-Ins2Akita diabetic mice, which exhibit progressive diabetic nephropathy (DN), but not in DN-resistant C57BL/6- Ins2Akita (C57BL/6-Akita) diabetic mice. To determine the role of SOD1 and SOD3 in DN, we generated C57BL/6-Akita diabetic mice with deficiency of SOD1 and/or SOD3 and investigated their renal phenotype at the age of 20 weeks. Increased glomerular superoxide levels were observed in SOD1−/−SOD3+/+ and SOD1−/−SOD3−/− C57BL/6-Akita mice but not in SOD1+/+SOD3−/− C57BL/6-Akita mice. The SOD1−/−SOD3+/+ and SOD1−/−SOD3−/− C57BL/6-Akita mice exhibited higher glomerular filtration rate, increased urinary albumin levels, and advanced mesangial expansion as compared with SOD1+/+SOD3+/+ C57BL/6-Akita mice, yet the severity of DN did not differ between the SOD1−/−SOD3+/+ and SOD1−/−SOD3−/− C57BL/6-Akita groups. Increased renal mRNA expression of transforming growth factor-β1 (TGF-β1) and connective tissue growth factor (CTGF), reduced glomerular nitric oxide (NO), and increased renal prostaglandin E2 (PGE2) production were noted in the SOD1−/−SOD3+/+ and SOD1−/−SOD3−/− C57BL/6-Akita mice. This finding indicates that such renal changes in fibrogenic cytokines, NO, and PGE2, possibly caused by superoxide excess, would contribute to the development of overt albuminuria by promoting mesangial expansion, endothelial dysfunction, and glomerular hyperfiltration. The present results demonstrate that deficiency of SOD1, but not SOD3, increases renal superoxide in the setting of diabetes and causes overt renal injury in nephropathy-resistant diabetic mice, and that SOD3 deficiency does not provide additive effects on the severity of DN in SOD1-deficient C57BL/6-Akita mice.
Keywords: Akita mouse, Diabetic nephopathy, Knockout mouse, Oxidative stress, Superoxide dismutase
1. Introduction
Diabetic nephropathy (DN) is the leading cause of end stage renal disease. A large body of studies has shown that cellular oxidative stress plays a central role in the pathogenesis of DN. In the diabetic kidney, superoxide anion (O•−2) is generated through numerous pathways and factors, including mitochondrial electron-transport chain, NAD(P)H oxidase, uncoupled endothelial nitric oxide synthase (eNOS), angiotensin II, oxidized-LDL, and advanced glycation end products (AGEs) [1,2]. Overproduction of superoxide results in the formation of secondary reactive oxygen species, activation of glycolytic damaging pathways, induction of proatherogenic genes, and reduction of anti-atherogenic enzymes such as eNOS and prostacyclin synthase, leading to diabetic renal injury [1,2]. Thus, superoxide excess is considered as a key component in the pathogenesis of DN.
The superoxide dismutase (SOD) family of antioxidant enzymes is a major defense system against the superoxide anion, converting superoxide into hydrogen peroxide (H2O2) and molecular oxygen (O2) [3]. The hydrogen peroxide is subsequently detoxified to water (H2O) by catalase or glutathione peroxidase. Three SOD isoforms have been identified in mammalian species; cytosolic CuZn-SOD (SOD1), mitochondrial Mn-SOD (SOD2), and extracellular CuZn-SOD (SOD3) [3]. Growing evidence suggests an important role of SOD enzyme in DN. There is substantial evidence that SOD activity in peripheral blood cells is reduced in the diabetic patients with DN as compared with those without diabetic complication [4–7]. In addition, recent studies have implicated SOD1 and SOD2 gene polymorphisms in human DN risk [8–10]. Lastly, the transgenic mice with SOD1 gene were shown to be resistant to DN [11,12].
Recent studies have shown that genetic factors significantly affect the development and the severity of DN in mice as well as in human [13,14]. Among the inbred mice, KK and DBA/2 strains have been identified as DN-prone strain, whereas the widely-used C57BL/6 strain is resistant to DN. Akita mouse, C57BL/6-Ins2Akita (C57BL/6-Akita), is a well-characterized mouse model of nonobese and hypoinsulinemic diabetes and develops marked hyperglycemia as early as 4 weeks of age because of a single mutation in cysteine 96 to tyrosin in the insulin 2 gene (Ins2Akita) [15,16]. However, the Akita mouse does not develop progressive DN due to DN-resistant C57BL/6 strain. We have recently generated a new Akita mouse model KK/Ta-Ins2Akita (KK/Ta-Akita) that develops advanced DN by backcrossing the C57BL/6-Akita mouse onto the DN-prone KK/Ta strain mouse [17]. In comparison between the two Akita mouse models, C57BL/6-Akita and KK/Ta-Akita, we found that renal expression of SOD1 and SOD3, but not SOD2, is prominently down-regulated in the KK/Ta-Akita mice that develop progressive DN, whereas renal SOD expression is unaltered in DN-resistant C57BL/6-Akita mice [17]. These findings suggest that down-regulation of SOD1 and SOD3 isoenzymes may contribute to the development and progression of DN.
To further determine the role of SOD1 and SOD3 isoenzymes in DN, here we generated C57BL/6-Akita diabetic mice with deficiency of SOD1, SOD3, or both SOD1 and SOD3. Our results demonstrate that deficiency of SOD1, but not SOD3, induces overt nephropathic changes via enhanced renal oxidative stress, increased renal expression of fibrogenic cytokines such as transforming growth factor-β1 (TGF-β1) and connective tissue growth factor (CTGF), reduction of glomerular nitric oxide (NO), and increased renal prostaglandin E2 (PGE2) in the DN-resistant C57BL/6-Akita mice without affecting the severity of diabetes. The findings indicate an important role of SOD1 in the development of DN.
2. Materials and methods
2.1. Experimental Animals
C57BL/6-Akita mice were purchased from SLC (Hamamatsu, Japan). Heterozygous (+/−) SOD1-deficient mice with C57BL/6 background were purchased from Jackson Laboratory (JAX, Bar Harbor, ME, USA). Homozygous (−/−) SOD3-deficient mice with C57BL/6 background were kindly gifted from Dr. Stefan L. Marklund [18]. SOD1-deficient C57BL/6-Akita (C57BL/6-Akita-SOD1−/−SOD3+/+), SOD3-deficient C57BL/6-Akita (C57BL/6-Akita-SOD1+/+SOD3−/−), and C57BL/6-Akita with deficiency of both SOD1 and SOD3 (C57BL/6-Akita-SOD1−/−SOD3−/−) mice were generated using C57BL/6-Akita, C57BL/6-SOD1+/−, and C57BL/6-SOD3−/− mice. Genotyping for SOD1 was performed according to the manufacturer's protocol as described on the JAX Web site. Genotype for SOD3 was determined by polymerase chain reaction (PCR) with the sense primer (5'-CCA CGA AGT TGC CAA AGT C-3') and the antisense primer (5'-GCG ACA CGC ATG CCA AAG-3'). The thermal cycle reaction was performed as follows: 94°C for 3 min, followed by 35 cycles at 94°C for 45 s, 55°C for 45 s, 72°C for 4 min, and 72°C for 2 min. The SOD3−/− mice showed only a band of ~1.5 kb. Male mice with or without deficiency of SOD1 and/or SOD3 were used for the study. The mice were allowed unrestricted access to standard rodent chow and water. Animal experiments were carried out in accordance with the Animal Welfare Guidelines of Akita and Vanderbilt University. All procedures were approved by the Committee on Animal Experimentation of Akita and Vanderbilt University.
2.2. Blood and urine parameters
Blood glucose was measured on samples obtained after a 6-h daytime fast using Glucocard Diameter (Arkray, Tokyo, Japan). Blood urea nitrogen (BUN), plasma total cholesterol, and plasma triglycerides were enzymatically measured by an autoanalyzer (Fuji Dry-Chem 5500, Fuji Film, Tokyo, Japan). Urinary albumin excretion was assessed by determination of albumin-to-creatinine ratio on morning spot urine as previously described [13]. Urine albumin and creatinine were measured by Albuwell-M Murine Microalbuminuria ELISA kit and Creatinine Companion kit (Exocell, Philadelphia, PA, USA), respectively.
2.3. Physiological parameters
Systolic blood pressure was measured in conscious trained mice using a non-invasive tail cuff and pulse transducer system (BP-98A, Softron, Tokyo, Japan). Glomerular filtration rate (GFR) was measured by a single-bolus FITC-inulin injection and clearance method as previously described [13].
2.4. Renal superoxide production and SOD activity
Renal superoxide levels were assessed by a water-soluble tetrazolium salt (WST-1, 2-[4-lodophenyl]-3-[4-nitrophenyl]-5-[2, 4-disulfophenyl]-2H-tetrazolium) reduction assay and dihydroethidium (DHE) histochemistry as previously described [17]. The specificity of the assay was evaluated by pre-incubating the kidney tissue with SOD-PEG (20 units; Sigma-Aldrich, St. Louis, MO, USA) overnight at 37 °C [17]. SOD activity in renal cortex was measured using a SOD assay kit-WST (Dojindo Molecular Technologies, Gaithers-burg, MD, USA) [17]. The amount of protein was measured using a bicinchoninic acid protein assay (Sigma-Aldrich). Enzymatic activity was expressed in units per mg protein.
2.5. Measurement of plasma and renal thiobarbituric acid-reactive substances (TBARS) levels
Plasma and renal TBARS levels were measured using a TBARS assay kit (Cayman Chemical, Ann Arbor, MI, USA) according to the manufacturer's instructions. Renal TBARS levels were expressed as renal cortical TBARS to protein ratio.
2.6. Western blot analysis
The kidney lysates prepared for SOD activity assay were used in Western blot analysis. Twenty micrograms of protein was separated by SDS-PAGE and subjected to immunoblots. The following primary antibodies were used [17]; rabbit anti-Cu/Zn SOD (SOD1; 1:10,000; Stressgen, Ann Arbor, MI, USA), rabbit anti-Mn SOD (SOD2; 1:10,000; Stressgen), rabbit anti-EC SOD (SOD3; 1:2,000; Stressgen), and rabbit anti-eNOS (1:1,000; Santa Cruz Biotechnology, Santa Cruz, CA, USA) polyclonal antibodies. Loading of the lysate proteins was evaluated by immunoblot using rabbit antiactin antibody (1:1000; Sigma-Aldrich).
2.7. Histologic analysis
Renal histopathology was assessed at 20 weeks of age. The mice were anesthetized with pentobarbital sodium (50 mg/kg body weight, i.p.) and the kidneys were perfused via left ventricle with PBS followed by 4% paraformaldehyde in PBS, removed, and fixed in 4% paraformaldehyde in PBS for overnight at 4 °C. Two μm-thick paraffin sections were stained with periodic acid-Schiff (PAS). A semi-quantitative score was used to evaluate the degree and extent of glomerular mesangial expansion as previously described [17]. Five mice per group were analyzed, and more than sixty cortical glomeruli were assessed in each mouse.
2.8. Quantitative real-time PCR
Total RNA was extracted from 30 mg of frozen renal cortex using RNeasy Mini kit (Qiagen, Tokyo, Japan). After reverse transcription was performed using PrimeScript 1st strand cDNA Synthesis Kit (TaKaRa, Ohtsu, Shiga, Japan), expression of TGF-β1 and CTGF mRNA was assessed by quantitative real-time PCR using Universal ProbeLibrary assays with predesigned probe and primers (Roche Diagnostics, Tokyo, Japan). 18S ribosomal RNA expression was used for normalization.
2.9. In situ detection of NO
Intracellular NO production in the glomeruli was assessed as previously described [19]. Briefly, mice were anesthetized, and a cannula was inserted in the left ventricle. After the mice were perfused with phosphate-buffered saline (PBS) containing 0.01 mmol/L diaminofluorescein-2 diacetate (DAF-2DA; Sekisui Medical, Tokyo, Japan) and 0.1mmol/L L-arginine, the kidneys were removed. Fluorescent images of NO were taken using confocal laser microscopy (LSM510; Carl Zeiss, Jena, Germany) with excitation at 495 nm and emission at 515 nm. The NO fluorescence intensity of glomeruli was semiquantified using Adobe Photoshop (version CS5; Adobe systems, San Jose, CA, USA).
2.10. Measurement of renal PGE2 levels
Renal PGE2 levels were measured using freshly isolated renal cortical tissue as previously described [20]. The levels were expressed as renal cortical PGE2 to protein ratio.
2.11. Statistical analysis
All data were presented as means ± SEM. Statistical analysis of the data was performed using GraphPad Prism software (GraphPad, San Diego, CA, USA). Differences between multiple groups were determined by one-way ANOVA followed by Bonferroni's multiple comparison test. P < .05 was considered statistically significant.
3. Results
3.1. Biochemical and physiological parameters in C57BL/6-Akita mice with deficiency of SOD1 and/or SOD3
Table 1 shows biochemical and physiological data in each group of mice at 20 weeks of age. Compared with wild-type C57BL/6 mice without deficiency of SOD1 and SOD3 (C57BL/6-WT-SOD1+/+SOD3+/+), C57BL/6-Akita diabetic mouse groups with or without deficiency of SOD1 and/or SOD3, C57BL/6-Akita-SOD1+/+SOD3+/+, C57BL/6-Akita-SOD1−/−SOD3+/+, C57BL/6-Akita-SOD1+/+SOD3−/−, and C57BL/6-Akita-SOD1−/−SOD3−/− exhibited markedly elevated blood glucose levels (>400 mg/dL), significantly lower body weight, higher systolic blood pressure, higher BUN levels, higher GFR, and higher kidney weight. Significant differences in these parameters except for GFR, however, were not observed between the four C57BL/6-Akita diabetic mouse groups, indicating that deficiency of SOD1 and SOD3 does not affect the severity of diabetes and diabetes-related parameters. No difference was observed in these parameters between the two non-diabetic mouse groups with or without SOD1 and SOD3 deficiency, C57BL/6-WT-SOD1+/+SOD3+/+ and C57BL/6-WT-SOD1−/−SOD3−/−. Interestingly, the two C57BL/6-Akita diabetic mouse groups with SOD1 deficiency (C57BL/6-Akita-SOD1−/−SOD3+/+ and C57BL/6-Akita-SOD1−/−SOD3−/−) exhibited significantly higher levels of urinary albumin and GFR relative to C57BL/6-Akita-SOD1+/+SOD3+/+, whereas C57BL/6-Akita diabetic mouse group with deficiency of SOD3 alone did not show these changes. Significant renal phenotype was not observed in non-diabetic C57BL/6-WT-SOD1−/−SOD3−/− mice.
Table 1.
Biochemical and physiological parameters in 20-week-old mice.
| C57BL/6-WT |
C57BL/6-Akita |
|||||
|---|---|---|---|---|---|---|
| SOD1+/+SOD3+/+ | SOD1−/−SOD3−/− | SOD1+/+SOD3+/+ | SOD1−/−SOD3+/+ | SOD1+/+SOD3−/− | SOD1−/−SOD3−/− | |
| BW(g) | 33.1 ± 1.1 | 31.4 ± 0.3 | 25.3 ± 0.7† | 26.0 ± 0.7† | 24.8 ± 1.0† | 25.2 ± 0.7† |
| SBP (mmHg) | 93 ± 2 | 94 ± 4 | 107 ± 5* | 110 ± 3* | 112 ± 3* | 115 ± 2* |
| BG (mg/dL) | 112 ± 2 | 106 ± 7 | 456 ± 24† | 452 ± 14† | 470 ± 18† | 443 ± 21† |
| BUN (mg/dL) | 25.8 ± 1.1 | 24.8 ± 1.2 | 40.6 ± 3.9* | 39.2 ± 2.9* | 40.6 ± 0.9* | 41.9 ± 4.2* |
| TC (mg/dL) | 86 ± 6 | 89 ± 4 | 110 ± 12 | 117 ± 9 | 109 ± 9 | 116 ± 10 |
| TG (mg/dL) | 78 ± 8 | 70 ± 5 | 78 ± 8 | 71 ± 7 | 78 ± 4 | 79 ± 7 |
| ACR (μg/mg Cr) | 15.3 ± 1.7 | 16.3 ± 3.7 | 58.4 ± 3.6 | 115.1 ±16.9†,§ | 55.3 ± 6.1 | 135.3 ± 13.4†,§ |
| GFR (μL/min/g BW) | 10.4 ± 0.3 | 10.2 ± 0.4 | 15.5± 0.8† | 18.2 ± 0.5†,‡ | 15.5 ± 0.4† | 18.5 ± 0.7†,‡ |
| LKW/BW (g/kg) | 5.6 ± 0.2 | 5.6 ± 0.1 | 10.7 ± 0.7† | 11.6 ± 1.0† | 10.8 ± 0.4† | 11.4 ± 0.9† |
BW, body weight; SBP, systolic blood pressure; BG, blood glucose; BUN, blood urea nitrogen; TC, total cholesterol; TG, triglyceride; ACR, urinary albumin-to-creatinine ratio; GFR, glomerular filtration rate; LKW, left kidney weight.
Values are means ± SEM. n = 5 per group.
P < .05 vs. C57BL/6-WT SOD1+/+SOD3+/+.
P < .001 vs. C57BL/6-WT SOD1+/+SOD3+/+.
P < .05 vs. C57BL/6-Akita SOD1+/+SOD3+/+.
P < .001 vs. C57BL/6-Akita SOD1+/+SOD3+/+.
3.2. Effects of SOD1 and SOD3 deficiency on renal SOD and oxidative stress
Through Western blot analysis, we first confirmed selective deletion of SOD1 and/or SOD3 proteins in the kidneys of SOD1−/− and/or SOD3−/− mice (Fig. 1A). It is of note that renal SOD2 expression was not altered by SOD1 and/or SOD3 deficiency in C57BL/6-Akita mice. Also, SOD1 deficiency did not alter renal SOD3 expression, and SOD3 deficiency also did not affect renal SOD1 expression in C57BL/6-Akita mice.
Fig. 1.

Renal SOD isoform expression, SOD activity, and superoxide production in experimental mice at 20 weeks of age. A, Renal SOD isoform expression. B, Renal SOD activity. Data are presented as means ± SEM. n = 5 per group. * P < .001. C, Representative glomerular DHE staining in each group of mice. a: C57BL/6-WT-SOD1+/+SOD3+/+. b: C57BL/6-WT-SOD1−/−SOD3−/−. c: C57BL/6-Akita-SOD1+/+SOD3+/+. d: C57BL/6-Akita-SOD1−/−SOD3+/+. e: C57BL/6-Akita-SOD1+/+SOD3−/−. f: C57BL/6-Akita-SOD1−/−SOD3−/−. D, Renal superoxide production. Data are presented as means ± SEM. SOD+: kidney tissue preincubated with SOD-PEG protein. SOD–: kidney tissue without SOD-PEG protein. n = 5 per group. * P < .001.
Renal SOD activity and superoxide levels were measured in each group of mice at the age of 20 weeks. As shown in Fig. 1B, the mice with SOD1 deficiency showed significantly reduced renal SOD activity relative to those without SOD1 deficiency when compared between C57BL/6-WT groups and between C57BL/6-Akita groups. Deficiency of SOD3 alone did not affect renal SOD activity. This would be because SOD3 expression is limited to glomerular and arterial vessel walls, while SOD1 is broadly expressed in renal cells and serves as a major SOD enzyme in kidney [17,18]. Renal superoxide production was assessed using DHE histochemistry and WST-1 reduction assay. The glomeruli in C57BL/6-Akita diabetic groups showed intense hydroethidium fluorescence, indicating increased glomerular superoxide production in these mice, and notably the C57BL/6-Akita diabetic mice with SOD1 deficiency showed stronger glomerular DHE fluorescence than those without SOD1 deficiency (Fig. 1C). As shown in Fig. 1D, C57BL/6-Akita diabetic groups showed significantly increased renal super-oxide levels as compared with the C57BL/6-WT non-diabetic group, C57BL/6-WT-SOD1+/+SOD3+/+. Consistent with the results of DHE histochemistry, SOD1-deficient C57BL/6-Akita diabetic groups exhibited significantly higher renal superoxide levels than SOD1-present C57BL/6-Akita diabetic mouse groups (C57BL/6-Akita-SOD1+/+SOD3+/+ and C57BL/6-Akita-SOD1+/+SOD3−/−), despite comparable levels of hyperglycemia (Fig. 1D). In contrast, deficiency of SOD3 did not affect renal superoxide levels in the C57BL/6-Akita diabetic mice. To further assess the degree of oxidative stress, plasma and renal levels of TBARS, a sensitive marker of oxidative stress, were measured in each group of mice at the age of 20 weeks. As shown in Fig. 2, C57BL/6-Akita diabetic groups showed significantly increased levels of plasma and renal TBARS as compared with the C57BL/6-WT non-diabetic group, C57BL/6-WT-SOD1+/+SOD3+/+. Furthermore, SOD1-deficient C57BL/6-Akita diabetic groups exhibited significantly higher levels of plasma and renal TBARS than SOD1-present C57BL/6-Akita diabetic mouse groups. It is noteworthy that deficiency of SOD1 and SOD3 did not affect renal superoxide and TBARS levels in the C57BL/6-WT non-diabetic mice. These findings indicate that SOD1 serves as the major SOD isoenzyme in kidney, accounting for majority of renal SOD activity, and the lack of SOD1 increases renal superoxide production and oxidative stress in the setting of diabetes.
Fig. 2.

Plasma and renal TBARS levels in 20-week-old mice. Data are presented as means ± SEM. n = 5 per group. * P < .05. † P < .001. ‡ P < .01. MDA, malondialdehyde.
3.3. Renal histopathology in the SOD1 and/or SOD3-deficient C57BL/6-Akita diabetic mice
Renal histopathology was assessed at 20 weeks of age. As shown in Fig. 3A, the two SOD1-deficient C57BL/6-Akita diabetic groups, C57BL/6-Akita-SOD1−/−SOD3+/+ and C57BL/6-Akita-SOD1−/−SOD3−/−, exhibited moderate mesangial expansion, while mesangial expansion was mild in C57BL/6-Akita diabetic group with deficiency of SOD3 alone (C57BL/6-Akita-SOD1+/+SOD3−/−). Non-diabetic groups, C57BL/6-WTSOD1+/+SOD3+/+ and C57BL/6-WT-SOD1−/−SOD3−/−, displayed normal glomerular histology (Fig. 3A). Histologically, obvious tubulointerstitial injury was not observed in all groups. Semi-quantitative analysis of PAS-stained glomeruli revealed greater mesangial expansion scores in diabetic mice, and the SOD1-deficient diabetic mice showed significantly higher mesangial expansion score than C57BL/6-Akita-SOD1+/+SOD3+/+ diabetic mice (Fig. 3B).
Fig. 3.

Glomerular histopathology in 20-week-old mice. A, Representative glomerulus in each group of mice. a: C57BL/6-WT-SOD1+/+SOD3+/+. b: C57BL/6-WT-SOD1−/−SOD3−/−. c: C57BL/6-Akita-SOD1+/+SOD3+/+. d: C57BL/6-Akita-SOD1−/−SOD3+/+. e: C57BL/6-Akita-SOD1+/+SOD3−/−. f: C57BL/6-Akita-SOD1−/−SOD3−/−. PAS stain. B, Glomerular mesangial expansion scores. The scores were determined as described in materials and methods. Data are presented as means ± SEM. n = 5 per group. * P < .001.
3.4. Renal TGF-β1 and CTGF mRNA expression in the SOD1 and/or SOD3-deficient C57BL/6-Akita diabetic mice
Because TGF-β1 and CTGF are critically involved in the development of renal hypertrophy and mesangial expansion in diabetic nephropathy [21,22], we examined renal mRNA expression of these two fibrogenic cytokines at 20 weeks of age. Fig. 4 shows renal mRNA expression levels of TGF-β1 and CTGF in non-diabetic and diabetic mouse groups. C57BL/6-Akita diabetic groups showed significantly increased renal mRNA expression levels of TGF-β1 and CTGF as compared with the C57BL/6-WT non-diabetic group, C57BL/6-WT-SOD1+/+SOD3+/+. Consistent with the results of renal histological analysis, SOD1-deficient C57BL/6-Akita diabetic groups which developed moderate mesangial expansion showed significantly higher renal mRNA expression levels of TGF-β1 and CTGF than SOD1-present C57BL/6-Akita diabetic mouse group, C57BL/6-Akita-SOD1+/+SOD3+/+. Renal mRNA expression levels of TGF-β1 and CTGF were similar between SOD1-present C57BL/6-Akita diabetic mouse groups (C57BL/6-Akita-SOD1+/+SOD3+/+ and C57BL/6-Akita-SOD1+/+SOD3−/−). Increases in renal mRNA expression levels of TGF-β1 and CTGF were not observed in non-diabetic C57BL/6-WT-SOD1−/−SOD3−/− group which displayed normal glomerular histology.
Fig. 4.

Renal mRNA expression of TGF-β1 and CTGF in 20-week-old mice. The mRNA expression relative to 18S ribosomal RNA is expressed as percentage of C57BL/6-WTSOD1+/+SOD3+/+. Data are presented as means ± SEM. n = 4 per group. * P < .001.
3.5. Glomerular NO levels in the SOD1 and/or SOD3-deficient C57BL/6-Akita diabetic mice
It is known that reduction of glomerular NO accelerates nephropathic changes in diabetic mice, including albuminuria and mesangial expansion [23–25]. Since increased superoxide anion may reduce NO levels in the glomeruli, we next examined whether glomerular NO is reduced in SOD1-deficient C57BL/6-Akita diabetic mice which showed increases in glomerular superoxide. Generation of NO in the glomeruli was evaluated by the fluorescent intensity of DAF-2DA reaction. Fig. 5 shows glomerular NO levels in non-diabetic and diabetic mouse groups. As expected, the four C57BL/6-Akita diabetic mouse groups showed decreased glomerular NO levels relative to the non-diabetic mouse group, C57BL/6-WT-SOD1+/+SOD3+/+. Notably, the SOD1-deficient C57BL/6-Akita diabetic groups, C57BL/6- Akita-SOD1−/−SOD3+/+ and C57BL/6-Akita-SOD1−/−SOD3−/−, exhibited lower NO levels in the glomeruli than the SOD1-present diabetic group, C57BL/6-Akita-SOD1+/+SOD3+/+ and C57BL/6-Akita-SOD1+/+SOD3−/−. In contrast, SOD3 deficiency did not affect glomerular NO levels in C57BL/6-Akita diabetic mice. In the two non-diabetic groups, C57BL/6-WT-SOD1+/+SOD3+/+ and C57BL/6-WT-SOD1−/−SOD3−/−, abundant NO production was observed in the glomeruli, and there was no significant difference in glomerular NO levels between these two groups. Renal expression of eNOS, which is a major enzyme responsible for glomerular NO production, was not significantly different among the groups (Fig. 5C and D).
Fig. 5.

Glomerular NO levels in 20-week-old mice. A, Representative images of glomerular NO in each group of mice. a: C57BL/6-WT-SOD1+/+SOD3+/+. b: C57BL/6-WT-SOD1−/−SOD3−/−. c: C57BL/6-Akita-SOD1+/+SOD3+/+. d: C57BL/6-Akita-SOD1−/−SOD3+/+. e: C57BL/6-Akita-SOD1+/+SOD3−/−. f: C57BL/6-Akita-SOD1−/−SOD3−/−. Arrows indicate glomerulus. Note: Images of panels d and f were taken with higher sensitivity; thereby, non-specific tubular fluorescence is seen. B, Semiquantified fluorescence intensity of glomerular NO in each group of mice. Data are presented as means ± SEM. n = 5 per group. * P < .01. † P < .001.
3.6. Renal cortical PGE2 levels in the SOD1 and/or SOD3-deficient C57BL/6-Akita diabetic mice
Lastly, we investigated whether the levels of renal cortical PGE2 are different in C57BL/6-Akita diabetic mice with and without deficiency of SOD1 and/or SOD3, as PGE2 is known to be increased by reactive oxygen species and to play an important role in the development of glomerular hyperfiltration and DN [26,27]. Interestingly, the SOD1-deficient C57BL/6-Akita diabetic groups, C57BL/6-Akita-SOD1−/−SOD3+/+ and C57BL/6-Akita-SOD1−/−SOD3−/−, exhibited remarkably increased renal cortical PGE2 levels than SOD1-present C57BL/6-Akita groups, C57BL/6-Akita-SOD1+/+SOD3+/+ and C57BL/6-Akita-SOD1+/+SOD3−/− (Fig. 6). Non-diabetic C57BL/6-WT group with SOD1 and SOD3 deficiency did not show increased renal cortical PGE2 levels (Fig. 6).
Fig. 6.
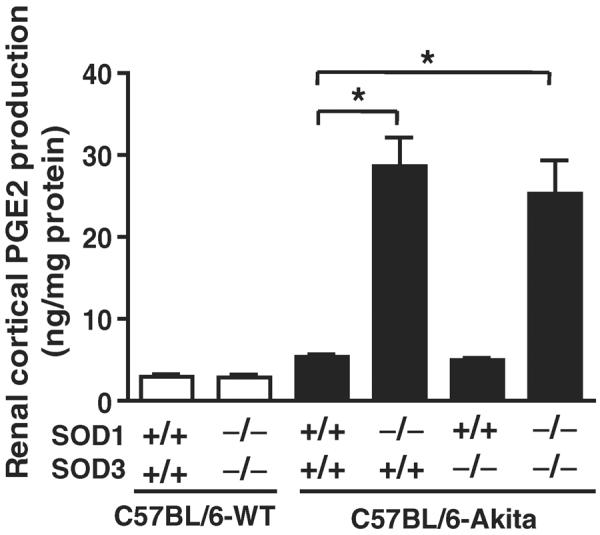
Renal cortical PGE2 levels in 20-week-old mice. Data are presented as means ± SEM. n = 5 per group. * P < .001.
4. Discussion
The present study was performed to investigate whether anti-oxidative enzymes, SOD1 and SOD3, are a key determinant for the development of DN. Our results demonstrate that SOD1 is the major SOD isoenzyme in kidney, accounting for majority of renal SOD activity, and that deficiency of SOD1 increases renal superoxide production and oxidative stress as shown by elevated renal TBARS levels in the setting of diabetes and causes overt renal injury in nephropathy-resistant diabetic mice, as evidenced by pronounced albuminuria and mesangial expansion. The findings indicate a crucial role of SOD1 in the pathogenesis of DN. Furthermore, our data demonstrate that SOD3 is not a major factor involved in the development of DN, and that deficiency of SOD3 in addition to SOD1 does not provide additive effects on the development and progression of DN.
Recently, DeRubertis et al has also shown acceleration of diabetic renal injury in C57BL/6-strain SOD1 deficient mice with high-dose streptozotocin (STZ) diabetes [28]. Although our data support their conclusions in essence, clearly there are some differences in renal outcomes between these two studies. The STZ-SOD1−/− mice exhibited lower blood glucose levels, reduced renal hypertrophy, and significant tubulointerstitial injury as compared with STZ-SOD1+/+ mice. However, these findings were not observed in the SOD1-deficient C57BL/6-Akita mice. In addition, albuminuria in STZ-SOD1−/− mice is definitely more severe than that in SOD1-deficient C57BL/6-Akita mice, exceeding 3.0 mg/24 h. It is known that STZ induces non-specific toxicity in multiple organs including kidney, liver and arteries, especially when it is used at a high dose [29,30]. Furthermore, STZ was shown to stimulate superoxide production [31] and induce robust oxidative stress in kidney as compared with spontaneous diabetic mice [32]. Hence, it is likely that these deleterious effects of STZ caused more severe renal injury in STZ-SOD1−/− mice, and it may be difficult to assess the precise role of SOD1 isoenzyme in DN by STZ model. In this context, our model provides more accurate information about the role of SOD1 in DN. Further studies are warranted to determine the mechanisms responsible for renal injury in the SOD1-deficient C57BL/6-Akita mice.
To elucidate the mechanism by which SOD1 deficiency causes overt albuminuria in the nephropathy-resistant C57BL/6-Akita diabetic mice, we examined glomerular levels of NO whose reduction was shown to confer albuminuria to C57BL/6 diabetic mice [24]. Albuminuria in DN is thought to be caused by glomerular hyperfiltration [33,34] and impaired charge or pore-size selectivity in glomerular capillary wall [35–37]. The glomerular capillary filtration barrier comprises three layers: endothelial cell layer, basement membrane, and podocyte layer. This barrier restricts the passage of anionic macromolecules such as plasma protein through its charge and size selectivity property [38]. The endothelial cell layer has anionic charges and serves as a charge-selective barrier in the glomerular capillary wall [39,40]. NO seems to be important for maintaining charge selectivity in the endothelial cell layer and preventing albuminuria and diabetic glomerular injury. Arcos et al showed that chronic NO inhibition impairs glomerular charge selectivity barrier and causes albuminuria in experimental rats [41]. Furthermore, experimental studies of diabetic rats and mice have indicated that decreased renal NO levels are associated with the development of renal histologic lesions [42], and that NO deficiency by endothelial NO synthase (eNOS) knockout causes glomerular endothelial injury and overt albuminuria [24]. Thus, it is plausible that glomerular NO level is a key factor determining the development of albuminuria in diabetic state. In the present study, we showed that glomerular NO levels were markedly reduced in SOD1-deficient C57BL/6-Akita diabetic mice, but renal eNOS expression was not reduced in these mice. Superoxide excess scavenges NO from endothelial cells and promotes the formation of cytotoxic secondary reactive oxygen species (ROS) such as peroxynitrite (ONOO−) [43,44]. Furthermore, increased ROS induces eNOS uncoupling, resulting in reduction of NO production and bioavailability in glomeruli [19,45]. Therefore, it is thought that reduction of glomerular NO levels in the SOD1-deficient C57BL/6-Akita diabetic mice resulted from higher glomerular superoxide and uncoupled eNOS. Thus, albuminuria in the SOD1-deficient C57BL/6-Akita diabetic mice may result partly from reduced glomerular NO bioactivity caused by glomerular superoxide excess.
Glomerular hyperfiltration is another important factor involved in the development of albuminuria in diabetic state. Reactive oxygen species including superoxide anion induce overproduction of PGE2 through cyclooxygenase-2 up-regulation [46,47] and phospholipase activation [48]. PGE2 is a vasodilator for afferent arterioles and excessive PGE2 could cause glomerular hyperfiltration in early DN [49,50]. In the present study, we found that SOD1-deficient C57BL/6-Akita diabetic mice exhibited higher GFR and remarkably increased renal PGE2 levels as compared with non-SOD1-deficient C57BL/6-Akita diabetic mice. These findings indicate that renal PGE2 overproduction resulted in glomerular hyperfiltration and also contributed to the development of overt albuminuria in the SOD1-deficient C57BL/6-Akita diabetic mice.
Adding to albuminuria, SOD1 deficiency resulted in pronounced mesangial expansion in C57BL/6-Akita diabetic mice. It is well known that increased oxidative stress activates protein kinase C and mitogen-activated protein kinase pathways [51,52] and up-regulates fibrogenic cytokines such as TGF-β1 and CTGF [22,53], leading to mesangial cell proliferation and extracellular matrix production. Recent studies of STZ-induced and C57BL/6-Akita diabetic mice have shown that chronic hyperglycemia increases renal mRNA expression of TGF-β1 and CTGF [53–55]. Our study also indicated that C57BL/6-Akita diabetic mouse groups have higher renal expression levels of TGF-β1 and CTGF than non-diabetic mouse group. Notably, the present study revealed that SOD1 deficiency leads to marked increases in renal expression of TGF-β1 and CTGF in the C57BL/6-Akita diabetic mice, possibly due to increased renal superoxide production and oxidative stress. Hence, it is conceivable that these fibrogenic cytokines are involved in the advanced mesangial expansion in SOD1-deficint C57BL/6-Akita diabetic mice.
As evidenced by the present result that non-diabetic SOD1−/−SOD3−/− mice did not show superoxide excess in the glomeruli and kidney at 20 weeks of age, renal oxidative homeostasis can be preserved without SOD1 and SOD3 in physiological conditions at least up to this age. More recently, we have demonstrated that NAD(P)H oxidase which is a major source of superoxide anion is up-regulated in the kidney of C57BL/6-Akita diabetic mouse model [56]. Therefore, as shown in the present study, renal SOD1 disruption fails to remove excessive glomerular and renal superoxide generated under hyperglycemic conditions, resulting in the development of overt diabetic renal injury. Lastly, SOD1 was shown to play an important role in the protection of oxidative stress in various tissues and organs, including carotid and cerebral arteries [57], heart [58], liver [59], and retina [60]. Hence, extra-renal tissues may also be affected in SOD1-deficient diabetic mice, though principal organs showed normal external appearance in the mice. Further investigation would be required on this issue.
Thus, the present study verified a crucial role of SOD1 in the pathogenesis of DN without the toxic effects of STZ. The SOD1-deficient C57BL/6-Akita mouse model would facilitate precise assessments and further elucidation of the molecular pathways through which SOD1 deficiency accelerates diabetic renal injury.
Acknowledgment
We thank Ms Kayoko Kagaya (Akita University Graduate School of Medicine) for technical assistance.
Funding This work was supported by a Grant-in-Aid for Scientific Research (no. 20590943 and no. 23591177, to H. Fujita) from the Ministry of Education, Science and Culture, Japan, and National Institutes of Health Grants (DK61018 to R.C. Harris, M.D. Breyer, and T. Takahashi and DK79341 to R.C. Harris and T. Takahashi). This study was facilitated by the Vanderbilt Mouse Metabolic Phenotyping Center and O'Brien Mouse Kidney Physiology and Disease Center.
Abbreviations
- SOD
superoxide dismutase
- DN
diabetic nephropathy
- TGF-β1
transforming growth factor-β1
- CTGF
connective tissue growth factor
- NO
nitric oxide
- PGE2
prostaglandin E2
- eNOS
endothelial nitric oxide synthase
- GFR
glomerular filtration rate
- TBARS
thiobarbituric acid-reactive substances
- STZ
streptozotocin
- ROS
reactive oxygen species
Footnotes
Author contributions H. Fujita and T. Takahashi designed the study, performed the experiments, analyzed the data, and wrote the manuscript. H. Fujishima, T. Sato, Tatsunori Shimizu, K. Takahashi, and T. Morii performed the study. Takahiko Shimizu, T. Shirasawa, Z. Qi, M.D. Breyer, R.C. Harris, and Y. Yamada provided the reagents and protocols and supported the study.
Conflict of interest The authors declare no conflict of interest.
REFERENCES
- [1].Brownlee M. The pathobiology of diabetic complications: a unifying mechanism. Diabetes. 2005;54:1615–25. doi: 10.2337/diabetes.54.6.1615. [DOI] [PubMed] [Google Scholar]
- [2].Forbes JM, Coughlan MT, Cooper ME. Oxidative stress as a major culprit in kidney disease in diabetes. Diabetes. 2008;57:1446–54. doi: 10.2337/db08-0057. [DOI] [PubMed] [Google Scholar]
- [3].Faraci FM, Didion SP. Vascular protection: superoxide dismutase isoforms in the vessel wall. Arterioscler Thromb Vasc Biol. 2004;24:1367–73. doi: 10.1161/01.ATV.0000133604.20182.cf. [DOI] [PubMed] [Google Scholar]
- [4].Hodgkinson AD, Bartlett T, Oates PJ, et al. The response of antioxidant genes to hyperglycemia is abnormal in patients with type 1 diabetes and diabetic nephropathy. Diabetes. 2003;52:846–51. doi: 10.2337/diabetes.52.3.846. [DOI] [PubMed] [Google Scholar]
- [5].Kedziora-Kornatowska KZ, Luciak M, Blaszczyk J, et al. Lipid peroxidation and activities of antioxidant enzymes in erythrocytes of patients with non-insulin dependent diabetes with or without diabetic nephropathy. Nephrol Dial Transplant. 1998;13:2829–32. doi: 10.1093/ndt/13.11.2829. [DOI] [PubMed] [Google Scholar]
- [6].Bhatia S, Shukla R, Venkata Madhu S, et al. Antioxidant status, lipid peroxidation and nitric oxide end products in patients of type 2 diabetes mellitus with nephropathy. Clin Biochem. 2003;36:557–62. doi: 10.1016/s0009-9120(03)00094-8. [DOI] [PubMed] [Google Scholar]
- [7].Colak E, Majkic-Singh N, Stankovic S, et al. Parameters of antioxidative defense in type 2 diabetic patients with cardiovascular complications. Ann Med. 2005;37:613–20. doi: 10.1080/07853890500330193. [DOI] [PubMed] [Google Scholar]
- [8].Mollsten A, Marklund SL, Wessman M, et al. A functional polymorphism in the manganese superoxide dismutase gene and diabetic nephropathy. Diabetes. 2007;56:265–9. doi: 10.2337/db06-0698. [DOI] [PubMed] [Google Scholar]
- [9].Lee SJ, Choi MG, Kim DS, et al. Manganese superoxide dismutase gene polymorphism (V16A) is associated with stages of albuminuria in Korean type 2 diabetic patients. Metabolism. 2006;55:1–7. doi: 10.1016/j.metabol.2005.04.030. [DOI] [PubMed] [Google Scholar]
- [10].Al-Kateb H, Boright AP, Mirea L, et al. Multiple superoxide dismutase 1/splicing factor serine alanine 15 variants are associated with the development and progression of diabetic nephropathy: the Diabetes Control and Complications Trial/Epidemiology of Diabetes Interventions and Complications Genetics study. Diabetes. 2008;57:218–28. doi: 10.2337/db07-1059. [DOI] [PMC free article] [PubMed] [Google Scholar]
- [11].Craven PA, Melhem MF, Phillips SL, et al. Overexpression of Cu2+/Zn2+ superoxide dismutase protects against early diabetic glomerular injury in transgenic mice. Diabetes. 2001;50:2114–25. doi: 10.2337/diabetes.50.9.2114. [DOI] [PubMed] [Google Scholar]
- [12].DeRubertis FR, Craven PA, Melhem MF, et al. Attenuation of renal injury in db/db mice overexpressing superoxide dismutase: evidence for reduced superoxide-nitric oxide interaction. Diabetes. 2004;53:762–8. doi: 10.2337/diabetes.53.3.762. [DOI] [PubMed] [Google Scholar]
- [13].Qi Z, Fujita H, Jin J, et al. Characterization of susceptibility of inbred mouse strains to diabetic nephropathy. Diabetes. 2005;54:2628–37. doi: 10.2337/diabetes.54.9.2628. [DOI] [PubMed] [Google Scholar]
- [14].Gurley SB, Clare SE, Snow KP, et al. Impact of genetic background on nephropathy in diabetic mice. Am J Physiol Renal Physiol. 2006;290:F214–22. doi: 10.1152/ajprenal.00204.2005. [DOI] [PubMed] [Google Scholar]
- [15].Yoshioka M, Kayo T, Ikeda T, et al. A novel locus, Mody4, distal to D7Mit189 on chromosome 7 determines early-onset NIDDM in nonobese C57BL/6 (Akita) mutant mice. Diabetes. 1997;46:887–94. doi: 10.2337/diab.46.5.887. [DOI] [PubMed] [Google Scholar]
- [16].Wang J, Takeuchi T, Tanaka S, et al. A mutation in the insulin 2 gene induces diabetes with severe pancreatic beta-cell dysfunction in the Mody mouse. J Clin Invest. 1999;103:27–37. doi: 10.1172/JCI4431. [DOI] [PMC free article] [PubMed] [Google Scholar]
- [17].Fujita H, Fujishima H, Chida S, et al. Reduction of renal superoxide dismutase in progressive diabetic nephropathy. J Am Soc Nephrol. 2009;20:1303–13. doi: 10.1681/ASN.2008080844. [DOI] [PMC free article] [PubMed] [Google Scholar]
- [18].Carlsson LM, Jonsson J, Edlund T, et al. Mice lacking extracellular superoxide dismutase are more sensitive to hyperoxia. Proc Natl Acad Sci U S A. 1995;92:6264–8. doi: 10.1073/pnas.92.14.6264. [DOI] [PMC free article] [PubMed] [Google Scholar]
- [19].Satoh M, Fujimoto S, Haruna Y, et al. NAD(P)H oxidase and uncoupled nitric oxide synthase are major sources of glomerular superoxide in rats with experimental diabetic nephropathy. Am J Physiol Renal Physiol. 2005;288:F1144–52. doi: 10.1152/ajprenal.00221.2004. [DOI] [PubMed] [Google Scholar]
- [20].Fujita H, Kakei M, Fujishima H, et al. Effect of selective cyclooxygenase-2 (COX-2) inhibitor treatment on glucose-stimulated insulin secretion in C57BL/6 mice. Biochem Biophys Res Commun. 2007;363:37–43. doi: 10.1016/j.bbrc.2007.08.090. [DOI] [PMC free article] [PubMed] [Google Scholar]
- [21].Reeves WB, Andreoli TE. Transforming growth factor beta contributes to progressive diabetic nephropathy. Proc Natl Acad Sci U S A. 2000;97:7667–9. doi: 10.1073/pnas.97.14.7667. [DOI] [PMC free article] [PubMed] [Google Scholar]
- [22].Elmarakby AA, Sullivan JC. Relationship between oxidative stress and inflammatory cytokines in diabetic nephropathy. Cardiovasc Ther. 2010 doi: 10.1111/j.1755-5922.2010.00218.x. http://dx.doi.org/10.1111/j.1755-5922.2010.00218.x. [DOI] [PubMed]
- [23].Zhao HJ, Wang S, Cheng H, et al. Endothelial nitric oxide synthase deficiency produces accelerated nephropathy in diabetic mice. J Am Soc Nephrol. 2006;17:2664–9. doi: 10.1681/ASN.2006070798. [DOI] [PMC free article] [PubMed] [Google Scholar]
- [24].Kanetsuna Y, Takahashi K, Nagata M, et al. Deficiency of endothelial nitric-oxide synthase confers susceptibility to diabetic nephropathy in nephropathy-resistant inbred mice. Am J Pathol. 2007;170:1473–84. doi: 10.2353/ajpath.2007.060481. [DOI] [PMC free article] [PubMed] [Google Scholar]
- [25].Wang CH, Li F, Hiller S, et al. A modest decrease in endothelial NOS in mice comparable to that associated with human NOS3 variants exacerbates diabetic nephropathy. Proc Natl Acad Sci U S A. 2011;108:2070–5. doi: 10.1073/pnas.1018766108. [DOI] [PMC free article] [PubMed] [Google Scholar]
- [26].Makino H, Tanaka I, Mukoyama M, et al. Prevention of diabetic nephropathy in rats by prostaglandin E receptor EP1-selective antagonist. J Am Soc Nephrol. 2002;13:1757–65. doi: 10.1097/01.asn.0000019782.37851.bf. [DOI] [PubMed] [Google Scholar]
- [27].Iino K, Iwase M, Sonoki K, et al. Combination treatment of vitamin C and desferrioxamine suppresses glomerular superoxide and prostaglandin E production in diabetic rats. Diabetes Obes Metab. 2005;7:106–9. doi: 10.1111/j.1463-1326.2005.00371.x. [DOI] [PubMed] [Google Scholar]
- [28].DeRubertis FR, Craven PA, Melhem MF. Acceleration of diabetic renal injury in the superoxide dismutase knockout mouse: effects of tempol. Metabolism. 2007;56:1256–64. doi: 10.1016/j.metabol.2007.04.024. [DOI] [PubMed] [Google Scholar]
- [29].Breyer MD, Bottinger E, Brosius FC, III, et al. Mouse models of diabetic nephropathy. J Am Soc Nephrol. 2005;16:27–45. doi: 10.1681/ASN.2004080648. [DOI] [PubMed] [Google Scholar]
- [30].Inada A, Kanamori H, Arai H, et al. A model for diabetic nephropathy: advantages of the inducible cAMP early repressor transgenic mouse over the streptozotocin-induced diabetic mouse. J Cell Physiol. 2008;215:383–91. doi: 10.1002/jcp.21316. [DOI] [PubMed] [Google Scholar]
- [31].Szkudelski T. The mechanism of alloxan and streptozotocin action in B cells of the rat pancreas. Physiol Res. 2001;50:537–46. [PubMed] [Google Scholar]
- [32].Lubec B, Hermon M, Hoeger H, et al. Aromatic hydroxylation in animal models of diabetes mellitus. FASEB J. 1998;12:1581–7. doi: 10.1096/fasebj.12.14.1581. [DOI] [PubMed] [Google Scholar]
- [33].Zatz R, Meyer TW, Rennke HG, et al. Predominance of hemodynamic rather than metabolic factors in the pathogenesis of diabetic glomerulopathy. Proc Natl Acad Sci U S A. 1985;82:5963–7. doi: 10.1073/pnas.82.17.5963. [DOI] [PMC free article] [PubMed] [Google Scholar]
- [34].Anderson S, Brenner BM. Pathogenesis of diabetic glomerulopathy: hemodynamic considerations. Diabetes Metab Rev. 1988;4:163–77. doi: 10.1002/dmr.5610040206. [DOI] [PubMed] [Google Scholar]
- [35].Deckert T, Kofoed-Enevoldsen A, Vidal P, et al. Size- and charge selectivity of glomerular filtration in type 1 (insulin-dependent) diabetic patients with and without albuminuria. Diabetologia. 1993;36:244–51. doi: 10.1007/BF00399958. [DOI] [PubMed] [Google Scholar]
- [36].Friedman S, Jones HW, III, Golbetz HV, et al. Mechanisms of proteinuria in diabetic nephropathy. II. A study of the size-selective glomerular filtration barrier. Diabetes. 1983;32(Suppl. 2):40–6. doi: 10.2337/diab.32.2.s40. [DOI] [PubMed] [Google Scholar]
- [37].Satchell SC, Tooke JE. What is the mechanism of microalbuminuria in diabetes: a role for the glomerular endothelium? Diabetologia. 2008;51:714–25. doi: 10.1007/s00125-008-0961-8. [DOI] [PMC free article] [PubMed] [Google Scholar]
- [38].Guasch A, Deen WM, Myers BD. Charge selectivity of the glomerular filtration barrier in healthy and nephrotic humans. J Clin Invest. 1993;92:2274–82. doi: 10.1172/JCI116831. [DOI] [PMC free article] [PubMed] [Google Scholar]
- [39].Bolton GR, Deen WM, Daniels BS. Assessment of the charge selectivity of glomerular basement membrane using Ficoll sulfate. Am J Physiol. 1998;274:F889–96. doi: 10.1152/ajprenal.1998.274.5.F889. [DOI] [PubMed] [Google Scholar]
- [40].Jeansson M, Haraldsson B. Morphological and functional evidence for an important role of the endothelial cell glycocalyx in the glomerular barrier. Am J Physiol Renal Physiol. 2006;290:F111–6. doi: 10.1152/ajprenal.00173.2005. [DOI] [PubMed] [Google Scholar]
- [41].Arcos MI, Fujihara CK, Sesso A, et al. Mechanisms of albuminuria in the chronic nitric oxide inhibition model. Am J Physiol Renal Physiol. 2000;279:F1060–6. doi: 10.1152/ajprenal.2000.279.6.F1060. [DOI] [PubMed] [Google Scholar]
- [42].Prabhakar S, Starnes J, Shi S, et al. Diabetic nephropathy is associated with oxidative stress and decreased renal nitric oxide production. J Am Soc Nephrol. 2007;18:2945–52. doi: 10.1681/ASN.2006080895. [DOI] [PubMed] [Google Scholar]
- [43].Evans JL, Goldfine ID, Maddux BA, et al. Oxidative stress and stress-activated signaling pathways: a unifying hypothesis of type 2 diabetes. Endocr Rev. 2002;23:599–622. doi: 10.1210/er.2001-0039. [DOI] [PubMed] [Google Scholar]
- [44].Forstermann U, Munzel T. Endothelial nitric oxide synthase in vascular disease: from marvel to menace. Circulation. 2006;113:1708–14. doi: 10.1161/CIRCULATIONAHA.105.602532. [DOI] [PubMed] [Google Scholar]
- [45].Satoh M, Fujimoto S, Arakawa S, et al. Angiotensin II type 1 receptor blocker ameliorates uncoupled endothelial nitric oxide synthase in rats with experimental diabetic nephropathy. Nephrol Dial Transplant. 2008;23:3806–13. doi: 10.1093/ndt/gfn357. [DOI] [PMC free article] [PubMed] [Google Scholar]
- [46].Kiritoshi S, Nishikawa T, Sonoda K, et al. Reactive oxygen species from mitochondria induce cyclooxygenase-2 gene expression in human mesangial cells: potential role in diabetic nephropathy. Diabetes. 2003;52:2570–7. doi: 10.2337/diabetes.52.10.2570. [DOI] [PubMed] [Google Scholar]
- [47].Jaimes EA, Tian RX, Pearse D, Raij L. Up-regulation of glomerular COX-2 by angiotensin II: role of reactive oxygen species. Kidney Int. 2005;68:2143–53. doi: 10.1111/j.1523-1755.2005.00670.x. [DOI] [PubMed] [Google Scholar]
- [48].Baud L, Nivez MP, Chansel D, et al. Stimulation by oxygen radicals of prostaglandin production by rat renal glomeruli. Kidney Int. 1981;20:332–9. doi: 10.1038/ki.1981.143. [DOI] [PubMed] [Google Scholar]
- [49].Hostetter TH, Troy JL, Brenner BM. Glomerular hemodynamics in experimental diabetes mellitus. Kidney Int. 1981;19:410–5. doi: 10.1038/ki.1981.33. [DOI] [PubMed] [Google Scholar]
- [50].Craven PA, Caines MA, DeRubertis FR. Sequential alterations in glomerular prostaglandin and thromboxane synthesis in diabetic rats: relationship to the hyperfiltration of early diabetes. Metabolism. 1987;36:95–103. doi: 10.1016/0026-0495(87)90070-9. [DOI] [PubMed] [Google Scholar]
- [51].Ha H, Lee HB. Reactive oxygen species as glucose signaling molecules in mesangial cells cultured under high glucose. Kidney Int Suppl. 2000;77:S19–25. doi: 10.1046/j.1523-1755.2000.07704.x. [DOI] [PubMed] [Google Scholar]
- [52].Lee HB, Yu MR, Yang Y, et al. Reactive oxygen species-regulated signaling pathways in diabetic nephropathy. J Am Soc Nephrol. 2003;14:S241–5. doi: 10.1097/01.asn.0000077410.66390.0f. [DOI] [PubMed] [Google Scholar]
- [53].Ohshiro Y, Ma RC, Yasuda Y, et al. Reduction of diabetes-induced oxidative stress, fibrotic cytokine expression, and renal dysfunction in protein kinase Cbeta-null mice. Diabetes. 2006;55:3112–20. doi: 10.2337/db06-0895. [DOI] [PubMed] [Google Scholar]
- [54].Kakoki M, Kizer CM, Yi X, et al. Senescence-associated phenotypes in Akita diabetic mice are enhanced by absence of bradykinin B2 receptors. J Clin Invest. 2006;116:1302–9. doi: 10.1172/JCI26958. [DOI] [PMC free article] [PubMed] [Google Scholar]
- [55].Kakoki M, Sullivan KA, Backus C, et al. Lack of both bradykinin B1 and B2 receptors enhances nephropathy, neuropathy, and bone mineral loss in Akita diabetic mice. Proc Natl Acad Sci U S A. 2010;107:10190–5. doi: 10.1073/pnas.1005144107. [DOI] [PMC free article] [PubMed] [Google Scholar]
- [56].Fujita H, Fujishima H, Morii T. Modulation of renal superoxide dismutase by telmisartan therapy in C57BL/6-Ins2(Akita) diabetic mice. Hypertens Res. 2011 doi: 10.1038/hr.2011.176. http://dx.doi.org/10.1038/hr.2011.176. [DOI] [PMC free article] [PubMed]
- [57].Didion SP, Ryan MJ, Didion LA, et al. Increased superoxide and vascular dysfunction in CuZnSOD-deficient mice. Circ Res. 2002;91:938–44. doi: 10.1161/01.res.0000043280.65241.04. [DOI] [PubMed] [Google Scholar]
- [58].Srivastava S, Chandrasekar B, Gu Y, et al. Downregulation of CuZn-superoxide dismutase contributes to beta-adrenergic receptor-mediated oxidative stress in the heart. Cardiovasc Res. 2007;74:445–55. doi: 10.1016/j.cardiores.2007.02.016. [DOI] [PubMed] [Google Scholar]
- [59].Uchiyama S, Shimizu T, Shirasawa T. CuZn-SOD deficiency causes ApoB degradation and induces hepatic lipid accumulation by impaired lipoprotein secretion in mice. J Biol Chem. 2006;281:31713–9. doi: 10.1074/jbc.M603422200. [DOI] [PubMed] [Google Scholar]
- [60].Imamura Y, Noda S, Hashizume K, et al. Drusen, choroidal neovascularization, and retinal pigment epithelium dysfunction in SOD1-deficient mice: a model of age-related macular degeneration. Proc Natl Acad Sci U S A. 2006;103:11282–7. doi: 10.1073/pnas.0602131103. [DOI] [PMC free article] [PubMed] [Google Scholar]