

Abstract
Noninvasive markers of liver fibrosis, measured at baseline, have been shown to predict liver-related mortality. It remains unknown if a change in the value of the scores over time predicts mortality in patients with HIV and viral hepatitis. In this retrospective study, survival in HIV/hepatitis B virus (HBV; n=67), HIV/hepatitis C virus (HCV; n=43), and HIV/HBV/HCV (n=41) patients was examined using Kaplan-Meier life table analysis. Aspartate aminotransferase (AST)-to-platelet ratio index (APRI) and FIB-4 scores, two noninvasive markers of liver fibrosis, were calculated at baseline and at last available clinical follow-up to determine the change in fibrosis score. Factors associated with mortality were assessed by Cox proportional hazards, including the change in the noninvasive marker score between the two time points. All-cause mortality was determined by Social Security Death Index and chart review. Sixty-seven were coinfected with HIV/HBV, 43 with HIV/HCV, and 41 were triply infected (HIV/HBV/HCV). Kaplan-Meier analysis showed similar survival for the three groups at 7 years of follow-up (p=0.10). However, median length of follow-up was lower in HIV/HCV (60.5; range 0-102) compared to HIV/HBV (75.7; 12.3–126.5) and HIV/HBV/HCV (80.0; 2.7–123) months, respectively, p=0.02. Baseline fibrosis score (p=0.002), an increase in the value for noninvasive measurements for fibrosis (p<0.001), and the presence of HIV/HCV coinfection (p=0.041) were each associated with higher risk for mortality. Baseline fibrosis score (p=0.03) and an increase in FIB-4 score (p=0.05) were independent predictors of all-cause mortality, but liver-related mortality was not evaluated. In this study, baseline fibrosis score was predictive of 7-year all-cause mortality. Further studies are needed in a prospective cohort to evaluate the predictive value of monitoring changes in fibrosis scores over time to predict mortality in patients with viral hepatitis.
Introduction
Liver biopsy is the gold standard for diagnosis of liver disease, and is used to rule out concomitant disease, measure iron stores, quantify steatosis, and determine presence of fibrosis or cirrhosis.1 Fibrosis stage has been shown to predict survival in cirrhotic patients. However, there are limitations to a liver biopsy including its invasiveness, inadequate specimen size, and sampling error that can lead to inaccurate staging. As a result, a number of noninvasive methods have been developed to determine the degree of liver fibrosis such as FibroScan® (Echosens, Paris, France), FibroTest™ (Assistance Publique, Hopitaux de Paris, Paris, France), Fibrasure™ (LabCorp, Burlington, NC), FIBROSpectSM (Prometheus Laboratories, San Diego, CA) FibroMax® (Biopredictive, Paris, France),2–5 and others. However, all of the above require special testing and expense. Unlike liver biopsies, noninvasive measures can be performed repeatedly over long periods of time with no risk. Noninvasive scores may be 70-80% accurate in predicting mild fibrosis from more severe disease as assessed by a receiver operator curve.6
Another category of noninvasive methods are readily calculated from clinical data alone to estimate the severity of fibrosis in hepatitis C (HCV) patients, such as aspartate aminotransferase/platelet ratio index (APRI) and FIB-4, which uses biochemical variables (alanine transaminase [ALT], aspartate aminotransferase [AST], platelet) and age.7,8 Compared to those without HIV, the overall ability to predict fibrosis stage by noninvasive methods has generally been lower in HCV/HIV-coinfected patients.6,9
Recently, noninvasive markers have been examined as a means for predicting outcomes in HCV-infected patients with and without HIV. Both APRI and FIB-4 were found to predict 3-year liver-related mortality with an area under the receiver operator curve of 0.88 (95% confidence interval [CI] 0.80–0.93) for APRI and 0.87 (95% CI, 0.77–0.92) for FIB-4.10 These noninvasive markers were used as predictors of mortality and not as surrogates for liver biopsy staging. Baseline fibrosis score appeared to accurately predict liver-related mortality. Since clinical disease evolves over time, it was hypothesized that changes in fibrosis score could also have predictive value. In the present study, APRI and FIB-4 were used to evaluate whether baseline fibrosis score and change in these scores could predict all-cause mortality in subsets of patients with HIV/HBV, HIV/HCV, or HIV/HCV/HBV coinfections. In addition, overall survival in HIV/HCV, HIV/HBV, and HIV with both HBV and HCV was examined.
Methods
Patients and methods
One hundred fifty-one HIV-infected patients coinfected with either HBV, HCV, or both who were receiving care in the HIV clinic at Parkland Health & Hospital System from July 1997 to January 2004 comprised the study population. Subjects were included if they had stored sera available and met eligibility requirements. Although an attempt was made to include those who had a sample prior to starting antiretroviral therapy (ART), those who were on ART were included especially if they were triply infected as this group was less prevalent. Those with HCV included many who were on ART at the time of the available serum sample. The number of patients included does not represent the prevalence of each viral infection in the clinic. Triply infected patients were oversampled. Demographic information, risk factor(s) for HIV transmission, drug use, alcohol use, and date of ART initiation were obtained from chart review. Alanine transaminase (ALT), aspartate aminotransferase (AST), total bilirubin, albumin, and platelet count were collected at the time of the sample and at last clinical follow-up. Hepatitis B, C, and D serologic test results were also available. HIV parameters included CD4 cell count and HIV viral load at baseline. Samples were analyzed for HCV RNA and HBV DNA using VERSANT® 3.0 branched DNA technology (Siemens Medical Solutions Diagnostics, Tarrytown, NY).
APRI was calculated using the formula [(AST/upper limit of normal)/platelets×109)×100]. FIB-4 was calculated using the formula [(age×AST)/platelets×√ALT]. First and last available clinical data were used to calculate two fibrosis measurements for APRI and FIB-4 scores. The time between the first and last clinical data was variable among the patients. Assuming changes in fibrosis occur over a number of years, the last available clinical data was used to calculate the second score. An APRI score of less than 0.5 indicates mild fibrosis, METAVIR stage 0–1, however, an APRI of greater than 1.5 indicates a fibrosis METAVIR stage 2 or greater. A FIB-4 score of less than 1.45 associated with mild fibrosis, METAVIR stage 1 or less whereas a score of greater than 3.25 indicates more advanced disease, METAVIR stage 2 or greater.11 These categorical cut-points have been examined in several studies, and they have been found to be predictive of fibrosis staging at the extremes of the spectrum.7,8,11–15 In this study baseline APRI and FIB-4 were examined by baseline fibrosis score as a dichotomous variable and the change in fibrosis score was examined as a linear variable. Both baseline fibrosis score and the change in APRI or FIB-4 scores were examined as to their relationship to mortality. To determine all-cause mortality, medical records were reviewed and the national Social Security Death Index (SSDI) was accessed to ascertain who had died among the 151 patients by September 17, 2008. Chart reviews were performed to determine cause of death but the number of patients with this type of information was limited and death certificates were generally not available.
Statistical analysis
Descriptive statistics were used to summarize the demographic, immunologic, liver, and viral characteristics of the entire cohort and each of the distinct viral hepatitis groups. Between-group comparisons for the three groups were made using Pearson χ2 test for categorical variables and the Kruskal-Wallis test for continuous variables for which medians and ranges are reported. Exact tests were used when the assumptions were not met.16 For determining the prognostic factors associated with the primary outcome of overall survival (based on all-cause mortality) survival analysis was first conducted using a univariate Cox proportional hazards model. Multivariable analysis was then conducted using Cox proportional hazards regression model to determine which factors were independent prognostic factors for survival. Clinically important and statistically significant factors from univariate analysis were used in the final multivariable model. p values for survival models are based on χ2 test using the Cox model. All confidence intervals were at the two-sided 95% level and all p values were two-sided. p<0.05 was considered statistically significant. Statistical analyses were performed using SAS Version 9.2 software (SAS Institute Inc., Cary, NC) and SigmaPlot Version 11.0 (Systat Software, Chicago, IL).
Results
Sixty-seven HIV-positive patients were coinfected with HBV, 43 with HCV, and 41 were infected both HBV and HCV (triply infected). As illustrated in Table 1, race and gender were comparable across the three patient categories for the entire cohort. There was a trend toward differences in age over the three groups with slightly younger age in the HBV/HIV-coinfected group. No differences were found in median ALT, AST, and platelet count, or in albumin and total bilirubin (data not shown). Median CD4 cell count was lower in HIV/HBV (118 cells per microliter) compared to HIV/HCV (248 cells per microliter) and triply infected (229 cells per microliter), p=0.002. As expected, a higher proportion of HIV/HBV coinfected patients had a CD4 count of less than 200 cells per microliter. Median HIV viral loads also differed among the three groups with higher loads being associated with HIV/HBV coinfection. Median HBV viral load was significantly lower in those who were triply infected compared to those with HIV/HBV. No differences in median HCV viral load were seen in those with HIV/HCV compared to the triply infected group.
Table 1.
Demographics, Immunologic, Liver, and Viral Characteristics of Entire Cohort and by Viral Hepatitis Group
| Variables | Total (n=151) | HBV/HIV (n=67) | HCV/HIV (n=43) | HBV/HCV/HIV (n=41) | p Value |
|---|---|---|---|---|---|
| Gender | 0.120 | ||||
| Male | 124 (82%) | 57 (85%) | 31 (72%) | 36 (88%) | |
| Female | 27 (18%) | 10 (15%) | 12 (28%) | 5 (12%) | |
| Race | 0.675a | ||||
| White | 64 (42%) | 25 (37%) | 21 (49%) | 18 (44%) | |
| Black | 68 (45.0%) | 30 (45%) | 19 (44%) | 19 (46%) | |
| Hispanic | 16 (11%) | 10 (15%) | 3 (7%) | 3 (7%) | |
| Other | 3 (2%) | 2 (3%) | 0 (0%) | 1 (2%) | |
| Age (years) | |||||
| n | 151 | 67 | 43 | 41 | |
| Median (min-max) | 38 (19–60) | 37 (19–60) | 40 (28–57) | 39 (26–60) | 0.061 |
| ALT (IU/mL) | |||||
| n | 141 | 66 | 39 | 36 | |
| Median (min-max) | 35 (6–430) | 36 (8–430) | 29 (6–242) | 36 (8–145) | 0.310 |
| AST (IU/mL) | |||||
| n | 147 | 66 | 43 | 38 | |
| Median (min-max) | 38 (11–389) | 38 (16–389) | 36 (11–240) | 46 (17–172) | 0.239 |
| Platelets | |||||
| n | 145 | 66 | 42 | 37 | |
| Median (min-max) | 188 (50–416) | 186 (68–416) | 190 (70–366) | 189 (50–335) | 0.698 |
| CD4 cell count (cells/mm3) | |||||
| n | 148 | 67 | 43 | 38 | |
| Median (min-max) | 193 (1–1132) | 118 (1–1132) | 248 (5–1130) | 229 (6–746) | 0.002 |
| ≤200 | 75 (51%) | 43 (64%) | 16 (37%) | 16 (42%) | |
| >200 | 73 (49%) | 24 (36%) | 27 (63%) | 22 (58%) | |
| HIV viral load (log copies/mL) | |||||
| n | 147 | 65 | 43 | 39 | |
| Median (min-max) | 4.6 (1.7–6.0) | 5.0 (2.6–6.0) | 4.2 (1.7–5.9) | 4.5 (1.7–5.9) | <0.001 |
| Hepatitis B e antigen | <0.001 | ||||
| Positive | 38 (59%) | 29 (76%) | — | 9 (35%) | |
| Negative | 26 (41%) | 9 (24%) | — | 17 (65%) | |
| Hepatitis delta | 0.006a | ||||
| Positive | 6 (17%) | 0 (0%) | — | 6 (35%) | |
| Negative | 30 (83%) | 19 (100%) | — | 11 (65%) | |
| Log HBV DNA (all samples), IU/mL | |||||
| n | 107 | 67 | — | 40 | |
| Median (min-max) | 7.1 (2.6–7.3) | 7.3 (2.6–7.3) | — | 2.6 (2.6–7.3) | <0.001 |
| Log HCV RNA (all samples), IU/mL | |||||
| n | 84 | — | 43 | 41 | |
| Median (min-max) | 5.3 (2.8–7.1) | — | 5.1 (2.8–6.9) | 5.4 (2.8–7.1) | 0.938 |
| Log HBV DNA (pre-ART samples), IU/mL | |||||
| n | 55 | 12 | 13 | ||
| Median (min-max) | 7.25 (2.55–7.25) | — | 5.55 (2.55–7.25) | 0.07 | |
| Log HCV DNA (pre-ART samples), IU/mL | |||||
| n | 55 | 12 | 13 | ||
| Median (min-max) | — | 6.2 (2.8–6.8) | 5.3 (2.8–6.9) | 0.59 | |
| Any drug use | <0.001 | ||||
| Yes | 79 (52%) | 20 (30%) | 31 (72%) | 28 (68%) | |
| No | 72 (48%) | 47 (70%) | 12 (28%) | 13 (32%) | |
| Heavy alcohol use | 0.086 | ||||
| Yes | 38 (25%) | 11 (16%) | 14 (33%) | 13 (32%) | |
| No | 113 (75%) | 56 (84%) | 29 (67%) | 28 (68%) | |
Exact test.
ART, antiretroviral therapy.
Because both the lamivudine and tenofovir component of ART can affect HBV viral load, a subgroup analysis of those who had samples available prior to starting ART (pre-ART samples, Table 1) was performed. Among the 80 patients for whom samples were available prior to initiation of ART, no significant differences were observed in demographics, liver function tests, CD4 T cell count or HIV viral load (data not shown). A trend toward lower HBV DNA levels in those with triple infection compared to those with HIV/HBV was observed in the pre-ART samples. No differences were observed in HCV viral load between those with HIV/HCV and triple infection in the pre-ART samples.
Overall, hepatitis D virus (HDV) antibody testing was obtained in 36 of a possible 67 patients; 6 of 36 (17%) were found to be HDV-positive in the triply infected group compared to HIV/HBV, p=0.006. Hepatitis B e antigen (HBeAg) was measured in 64 patients and was positive in 59%; HBeAg was more likely to be positive in the HIV/HBV group, n=29/38 (76%), than in the triply infected group, n=9/17 (35%), p<0.001.
Alcohol and drug use
From data obtained from chart review, 52% were classified as having used drugs (past or present), either through injection, inhalation, or intranasally. Approximately 25% of patients were classified as heavy alcohol users if they drank more than 5 drinks at one time, either currently or in the past. Drug use was more common in those with HIV/HCV (72%) and triple infection (68%) compared to HIV/HBV (30%), p<0.001. A trend toward a higher proportion of patients with heavy alcohol use was observed in those with HIV/HCV (33%) or triple infection (32%) compared to HIV/HBV (17%), p=0.06.
Survival
There were 40 deaths overall and 111 patients censored over 7 years of follow-up with an estimated Kaplan-Meier survival rate of 69%. Kaplan-Meier survival curves (Fig. 1) at 7 years estimated that 78% of HIV/HBV-coinfected patients, 55% of HIV/HCV-coinfected, and 69% of HIV/HBV/HCV triply infected patients had survived (p=0.10). The median length of follow-up was 75.3 months (range, 0.0–126.5 months). The HIV/HCV group had a lower median length of follow-up (60.5, [0–102] months) compared to HIV/HBV (75.7, [12.3–126.5] months) and HIV/HBV/HCV (80.0, [2.7–123] months), p=0.02.
FIG. 1.

Kaplan-Meier curve of survival based on type of viral infection (HIV/HBV, HIV/HBV/HCV, HIV/HCV) with data censored beyond 7 years. Number at risk indicates those who were still in the cohort at the corresponding time points. HBV, hepatitis B virus; HCV, hepatitis C virus.
The distribution of fibrosis score at baseline and follow-up for the entire cohort is depicted in Fig. 2. Overall a higher proportion of patients had advanced liver disease at follow-up in the entire cohort. Specifically, those with HIV/HCV coinfection and HIV/HCV/HBV coinfection had a higher proportion with advanced fibrosis at follow-up compared to HIV/HBV-coinfected group.
FIG. 2.
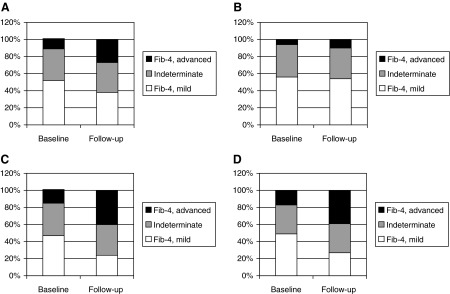
Distribution of fibrosis by FIB-4 score at baseline and follow-up time point. Advanced indicates a FIB-4 score >3.25 and indicates>stage 2 fibrosis. Mild corresponds to a FIB-4 score of <1.45 and indicates≤stage 1. Indeterminates are those numbers that follow in between for whom fibrosis score cannot be reliably assessed. (A) Entire cohort. (B) HIV/HBV. (C) HIV/HBV. (D) HIV/HBV/HCV. HBV, hepatitis B virus; HCV, hepatitis C virus.
In a univariate analysis, we examined the 7-year survival rate and risk of mortality by gender, drug use, alcohol use, type of infection, and change in fibrosis score. Age was not used as a variable since it is included in the fibrosis score calculation for FIB-4. HIV/HCV coinfection (hazard rate [HR]=2.17; 95% CI, 1.03–4.55; p=0.04), baseline APR I >1.5 (HR=2.79; 95% CI, 1.32–5.91; p=0.007), baseline FIB-4>3.25 (HR=3.83; 95% CI, 1.68–8.77; p=0.002), change in APRI (HR=1.14; 95% CI, 1.02–1.28; p=0.02), and change in FIB-4 score (HR=1.03; 95% CI, 1.01–1.04; p<0.001) were all predictive of mortality in the univariate analysis (Table 2).
Table 2.
Risk of All-Cause Mortality: Univariate Analysis of Overall Survival
| Seven-year survival rate±standard error | Unadjusted hazard ratioa | 95% CI | p Valuea | |
|---|---|---|---|---|
| Gender | ||||
| Male (reference) vs. | 67%±5% | |||
| Female | 80%±8% | 0.58 | (0.23, 1.48) | 0.257 |
| Drug use | ||||
| No [reference] | 73%±6% | |||
| Yes | 66%±6% | 1.3 | (0.69, 2.45) | 0.413 |
| Heavy alcohol use | ||||
| No [reference] | 74%±5% | |||
| Yes | 58%±8% | 1.7 | (0.90, 3.25) | 0.100 |
| Type of infection | ||||
| HIV/HBV [reference] | 78%±6% | |||
| Triple (HIV/HBV/HCV) | 69%±7% | 1.32 | (0.60, 2.89) | 0.492 |
| HIV/HCV | 55%±9% | 2.17 | (1.03, 4.55) | 0.041b |
| Baseline APRI score | ||||
| APRI <0.5 [reference] | 76%±5% | |||
| APRI 0.5–1.5 (indeterminate) | 70%±8% | 1.17 | (0.54, 2.53) | 0.69 |
| APRI >3.25 | 39%±12% | 2.79 | (1.32, 5.91) | 0.007b |
| Baseline FIB-4 score | ||||
| FIB-4 <1.45 | 75%±6% | |||
| FIB-4 1.45–3.25 | 72%±7% | 1.02 | (0.47–2.18) | 0.96 |
| FIB-4 >3.25 | 36%±13% | 3.83 | (1.68–8.77) | 0.002b |
| Change in APRI score | n/a | 1.14 | 1.02–1.28 | 0.020b |
| Change in FIB-4 score | n/a | 1.03 | 1.01–1.04 | <0.001b |
Hazard ratios and p values based on univariate Cox proportional hazards regression model.
p Value<0.05 statistically significant.
CI, confidence interval; n/a, not applicable since this is a continuous variable; HBV, hepatitis B virus; HCV, hepatitis C virus; APRI, aspartate aminotransferase/platelet ratio index.
In a multivariable model (Table 3), when adjusting by type of infection (HIV/HCV, HIV/HBV, and triply infected), excessive alcohol use, and drug use, baseline advanced fibrosis score remained an independent predictor of all-cause mortality at 7 years by both APRI (adjusted HR=2.64;95% CI, 1.22–5.75, p=0.01) and FIB-4 (adjusted HR=2.74; 95% CI, 1.1–6.82, p=0.03). The change in fibrosis score observed (APRI or FIB-4) when adjusted for baseline fibrosis showed a trend toward being associated with increased risk of all-cause mortality. FIB-4 (adjusted HR=1.02; 95% CI, 1.01–1.04; p=0.003) appeared to be more robust than APRI (adjusted HR 1.13; 95% CI, 1.00–1.28; p=0.05) in predicting all-cause mortality. In a sensitivity analysis, when removing two outliers [patients who died in the hospital with thrombotic thrombocytopenic purpura (TTP) or disseminated intravascular coagulation (DIC)], change in FIB-4 score, adjusted for type of viral infection, alcohol and drug use, remained an independent predictor of all-cause mortality (HR=1.1; 95% CI: 1.0–1.16; p=0.007). Additionally, the median length of time from the last clinical sample to death was 2.4 months (0.0–74.0).
Table 3.
Risk of All-Cause Mortality Adjusted by Viral Infection, Alcohol Use, Drug Use, and Change in Fibrosis Score: Multivariable Analysis of Overall Survival
| Parameter estimate±standard error | Adjusted hazard ratioa | 95% CI | p Value | |
|---|---|---|---|---|
| APRI | ||||
| HIV/HBV [reference] | — | 1.0 | — | — |
| HIV/HCV | 0.63±0.44 | 1.87 | 0.78–4.50 | 0.16 |
| Triple (HIV/HBV/HCV) | 0.12±0.45 | 1.13 | 0.47–2.73 | 0.78 |
| Drug use | −0.00±0.42 | 0.91 | 0.40–2.1 | 0.83 |
| Excessive alcohol use | 0.36±0.36 | 1.46 | 0.71–2.97 | 0.30 |
| Baseline APRI <0.5 [reference] | — | 1.0 | — | — |
| Baseline APRI 0.5–1.5 | 0.21±0.40 | 1.24 | 0.56–2.72 | 0.60 |
| Baseline APRI >1.5 | 0.97±0.40 | 2.64 | 1.22–5.75 | 0.01b |
| Change in APRI score | 0.10±0.05 | 1.11 | 1.00–1.23 | 0.06 |
| FIB-4 | ||||
| HIV/HBV [reference] | — | 1.0 | — | — |
| HIV/HCV | 0.40±0.47 | 1.5 | 0.60–3.75 | 0.39 |
| Triple (HIV/HBV/HCV) | 0.03±0.45 | 1.03 | 0.43–2.50 | 0.94 |
| Drug use | −0.04±0.43 | 0.96 | 0.42–2.22 | 0.93 |
| Excessive alcohol use | 0.51±0.39 | 1.67 | 0.78–3.56 | 0.18 |
| Baseline FIB-4<1.45 | — | 1.0 | 0 | 0 |
| Baseline FIB-4 1.45–3.25 | 0.02±0.39 | 1.0 | 0.47–2.15 | 1.0 |
| Baseline FIB-4>3.25 | 1.01±0.46 | 2.74 | 1.1–6.82 | 0.03b |
| Change in FIB-4 Score | 0.02±0.01 | 1.02 | 1.0–1.03 | 0.05b |
Hazard ratios and p values based on multivariable Cox proportional hazards regression model.
p value<0.05 statistically significant.
CI, confidence interval; APRI, aspartate aminotransferase/platelet ratio index; HBV, hepatitis B virus; HCV, hepatitis C virus.
Discussion
APRI and FIB-4 scores were developed to be surrogates for staging hepatic fibrosis to help clinicians distinguish mild from advanced fibrosis. More recently, these scores have been shown to predict liver-related mortality in HCV-infected persons.10 A change in these noninvasive fibrosis scores over time might help clinicians identify those at increased risk of mortality. Our results show that baseline fibrosis score is a strong predictor of all-cause mortality at 7 years. This finding validates the observations made in a previous study and shows that advanced fibrosis can be predictive of all-cause mortality over a longer period of time. The change in FIB-4 score overtime was also a predictor of all-cause mortality after adjustment for baseline fibrosis score. Changes in FIB-4 scores over time appear to be more robust as a predictor of all-cause mortality when compared to changes in the APRI score.
The MELD score “Model for End-Stage Liver Disease,” developed to predict survival following placement of transjugular intrahepatic shunt (TIPS),17 has been validated as a predictor of survival in patients with advanced liver disease.18 However, in patients who may not have advanced liver disease initially, a change in fibrosis score by APRI or FIB-4 may provide an indicator of long-term survival. Because of variable length of follow-up, this study could not determine the risk of mortality by changes in fibrosis score over a fixed time (i.e., 1 year). Future studies with measurements at fixed time intervals will be needed to further refine this model. However, this simple tool may allow HIV-providers to predict early risk of death in patients with viral hepatitis.
In addition to examining the predictive value of noninvasive scores, we examined overall survival of the three groups in this study. It is well known that higher mortality rates are observed between HIV/HCV patients when compared to HIV monoinfection. When comparing factors associated with survival over a 7-year period, HIV/HCV-coinfected patients did not have a significantly poorer survival compared to those with HIV/HBV coinfection. These results differ from other studies in that the present study compared HIV/HCV co-infected patients to other coinfected or triply infected patients rather than comparing co-infected to those with HIV alone.19,20
No differences in mortality were observed between the three multiply infected groups; thus, the type of viral infection does not appear to predict mortality. However, the baseline fibrosis score and change in noninvasive fibrosis score does provide an independent predictor of mortality.
Although excessive alcohol use and drug use were not predictors of mortality in the univariate analysis, these variables were placed in the multivariable model because they were considered likely to impact mortality. Age was part of the noninvasive score and was not added as an additional variable into the model. Baseline CD4 cell count and HIV viral load were not predictive of death and were not added to the model. Although this may appear surprising, studies have shown that last CD4 cell count compared to baseline or nadir is the best predictor of serious clinical end points including all-cause mortality.21 Last available CD4 cell count was not examined in this study and thus is likely the reason why CD4 cell count failed to predict mortality in this study. Furthermore, most patients were on ART and thus baseline CD4 may be very different than last available CD4 cell count. The viral interaction between HBV and HCV was also of interest. We compared those triply infected with HIV/HBV and HIV/HCV dual infections. Samples obtained prior to ART initiation showed that triply infected patients had a trend toward lower HBV DNA levels, similar to other reports in HBV/HCV patients.22–24 No difference in HCV RNA levels in the triply infected patients was observed when compared to the HIV/HCV coinfected group; this result differs from a recent study.24
Hepatitis D virus infection occurred more often in those with triple infection, suggesting that the intravenous/parenteral route is the most likely mode of transmission of these infections.
There are many limitations to this study including using retrospective data and variable length of time to follow-up visit. As such, change in fibrosis score may be a time-varying predictor. Although statistical methods are available to develop predictive survival models with time-dependent prognostic factors, such a study would require more than one follow-up time point to use this methodology.25 An assumption was made that change in fibrosis score was a time-dependent covariate and therefore the risk of mortality based on change in fibrosis score over a specific time period could not be determined. In addition, lower platelet counts may be associated with worsening HIV disease and not liver disease, and using this clinical variable might be misleading in certain cases. Other non-invasive markers were not used due to cost but might have given different results. A prospective cohort study will be needed to validate this model and determine if changes, specifically an increase, in FIB-4 may be used as a predictor of mortality in HIV patients with viral hepatitis. Calculation of APRI and FIB-4 scores are based on the liver function tests that can fluctuate highly with the reactivation of hepatitis. Studying a large number of patients might offset this bias to some extent. However, FIB-4 and APRI, at baseline, has already been shown to be a predictor of 3-year liver-related mortality.10 Another limitation in the change in FIB-4/APRI scores is the proximity of the last clinical sample to the person's death and could be due to premorbid conditions. Further studies are needed to determine if changes in fibrosis score 6–12 months prior to death would be predictive of mortality.
The impact of HCV treatment on reduction in mortality could not be done since very few patients were treated during this time period. However, treating HCV and obtaining a sustained virologic response (SVR) has been shown to reduce liver-related complications and mortality26,27 and reduce fibrosis.28,29 One study examining noninvasive markers of fibrosis found a significant decrease in scores in those who had an SVR.30 Thus, a decrease in fibrosis scores has been shown with HCV treatment although this study did not examine if a decrease in the score was associated with improved survival.
In conclusion, baseline advanced fibrosis score is a strong predictor of all-cause mortality at 7 years among those with viral hepatitis. After adjusting for baseline fibrosis, an increase in noninvasive marker scores, specifically FIB-4 was also predictive of all-cause mortality. This study used noninvasive fibrosis scores as an independent predictor of mortality instead of a means to stage fibrosis. This simple tool with further validation could help clinicians assess the risk of death in patients with HIV and viral hepatitis. Those at risk could be offered counseling and treatment to reduce risk of further liver disease progression. Further prospective studies with larger number of patients are needed to determine the prognostic value of an increase in fibrosis score over a defined time period and to determine whether treatment of viral hepatitis could reduce changes in fibrosis score.
Acknowledgment
Data was presented in part at the 58th Annual Meeting of the AASLD, Boston, November 2–6, 2007 and the 14th Conference on Retroviruses and Opportunistic Infections, Los Angeles, February 25–28, 2007.
Author Disclosure Statement
M.K.J. has received research grant support from Vertex Pharmaceuticals, Roche, Pfizer, Gilead, and ViiV Healthcare, Boehringer Ingelheim. M.K.J. has also served as consultant to Vertex, Boehringer Ingelheim, and Merck. W.M.L. has been a consultant for Eli Lilly, Merck, Novartis, Pfizer, FoldRx and Gilead Sciences. W.M.L. has received research grant support from Schering-Plough Research Institute, Siemens, Vertex, Roche, Gilead Sciences, and Globeimmune. E.S., R.B., D.D., R.J., N.A., H.Y. have no conflict of interest
References
- 1.Germani G. Burroughs AK. Dhillon AP. The relationship between liver disease stage and liver fibrosis: A tangled web. Histopathology. 2010;57:773–784. doi: 10.1111/j.1365-2559.2010.03609.x. [DOI] [PubMed] [Google Scholar]
- 2.Patel K. Benhamou Y. Yoshida EM, et al. An independent and prospective comparison of two commercial fibrosis marker panels (HCV FibroSURE and FIBROSpect II) during albinterferon alfa-2b combination therapy for chronic hepatitis C. J Viral Hepat. 2009;16:178–186. doi: 10.1111/j.1365-2893.2008.01062.x. [DOI] [PubMed] [Google Scholar]
- 3.Smith JO. Sterling RK. Systematic review: Non-invasive methods of fibrosis analysis in chronic hepatitis C. Aliment Pharmacol Ther. 2009;30:557–576. doi: 10.1111/j.1365-2036.2009.04062.x. [DOI] [PubMed] [Google Scholar]
- 4.Shaheen AA. Wan AF. Myers RP. FibroTest and FibroScan for the prediction of hepatitis C-related fibrosis: A systematic review of diagnostic test accuracy. Am J Gastroenterol. 2007;102:2589–2600. doi: 10.1111/j.1572-0241.2007.01466.x. [DOI] [PubMed] [Google Scholar]
- 5.Morra R. Munteanu M. Imbert-Bismut F. Messous D. Ratziu V. Poynard T. FibroMAX: Towards a new universal biomarker of liver disease? Expert Rev Mol Diagn. 2007;7:481–490. doi: 10.1586/14737159.7.5.481. [DOI] [PubMed] [Google Scholar]
- 6.Loko MA. Castera L. Dabis F, et al. Validation and comparison of simple noninvasive indexes for predicting liver fibrosis in HIV-HCV-coinfected patients: ANRS CO3 Aquitaine cohort. Am J Gastroenterol. 2008;103:1973–1980. doi: 10.1111/j.1572-0241.2008.01954.x. [DOI] [PubMed] [Google Scholar]
- 7.Wai CT. Greenson JK. Fontana RJ, et al. A simple noninvasive index can predict both significant fibrosis and cirrhosis in patients with chronic hepatitis C. Hepatology. 2003;38:518–526. doi: 10.1053/jhep.2003.50346. [DOI] [PubMed] [Google Scholar]
- 8.Sterling RK. Lissen E. Clumeck N, et al. Development of a simple noninvasive index to predict significant fibrosis in patients with HIV/HCV coinfection. Hepatology. 2006;43:1317–1325. doi: 10.1002/hep.21178. [DOI] [PubMed] [Google Scholar]
- 9.Macias J. Giron-Gonzalez JA. Gonzalez-Serrano M, et al. Prediction of liver fibrosis in human immunodeficiency virus/hepatitis C virus coinfected patients by simple non-invasive indexes. Gut. 2006;55:409–414. doi: 10.1136/gut.2005.065904. [DOI] [PMC free article] [PubMed] [Google Scholar]
- 10.Nunes D. Fleming C. Offner G, et al. Noninvasive markers of liver fibrosis are highly predictive of liver-related death in a cohort of HCV-infected individuals with and without HIV infection. Am J Gastroenterol. 2010;105:1346–1353. doi: 10.1038/ajg.2009.746. [DOI] [PubMed] [Google Scholar]
- 11.Cacoub P. Carrat F. Bedossa P, et al. Comparison of non-invasive liver fibrosis biomarkers in HIV/HCV co-infected patients: the fibrovic study—ANRS HC02. J Hepatol. 2008;48:765–773. doi: 10.1016/j.jhep.2008.01.025. [DOI] [PubMed] [Google Scholar]
- 12.Mallet V. Dhalluin-Venier V. Roussin C, et al. The accuracy of the FIB-4 index for the diagnosis of mild fibrosis in chronic hepatitis B. Aliment Pharmacol Ther. 2009;29:409–415. doi: 10.1111/j.1365-2036.2008.03895.x. [DOI] [PubMed] [Google Scholar]
- 13.Shin WG. Park SH. Jang MK, et al. Aspartate aminotransferase to platelet ratio index (APRI) can predict liver fibrosis in chronic hepatitis B. Dig Liver Dis. 2008;40:267–274. doi: 10.1016/j.dld.2007.10.011. [DOI] [PubMed] [Google Scholar]
- 14.Trang T. Petersen JR. Snyder N. Non-invasive markers of hepatic fibrosis in patients co-infected with HCV and HIV: comparison of the APRI and FIB-4 index. Clin Chim Acta. 2008;397:51–54. doi: 10.1016/j.cca.2008.07.009. [DOI] [PubMed] [Google Scholar]
- 15.Wai CT. Cheng CL. Wee A, et al. Non-invasive models for predicting histology in patients with chronic hepatitis B. Liver Int. 2006;26:666–672. doi: 10.1111/j.1478-3231.2006.01287.x. [DOI] [PubMed] [Google Scholar]
- 16.Xiong Z. %YAMGAST: Yet another macro to generate a summary table. Pharmaceutical Industry SAS Users Group (PharmaSUG) Proceedings; 2008. p. P004. [Google Scholar]
- 17.Malinchoc M. Kamath PS. Gordon FD. Peine CJ. Rank J. ter Borg PC. A model to predict poor survival in patients undergoing transjugular intrahepatic portosystemic shunts. Hepatology. 2000;31:864–871. doi: 10.1053/he.2000.5852. [DOI] [PubMed] [Google Scholar]
- 18.Kamath PS. Kim WR. The model for end-stage liver disease (MELD) Hepatology. 2007;45:797–805. doi: 10.1002/hep.21563. [DOI] [PubMed] [Google Scholar]
- 19.Bonacini M. Louie S. Bzowej N. Wohl AR. Survival in patients with HIV infection and viral hepatitis B or C: A cohort study. AIDS. 2004;18:2039–2045. doi: 10.1097/00002030-200410210-00008. [DOI] [PubMed] [Google Scholar]
- 20.Lohse N. Hansen AB. Pedersen G, et al. Survival of persons with and without HIV infection in Denmark, 1995–2005. Ann Intern Med. 2007;146:87–95. doi: 10.7326/0003-4819-146-2-200701160-00003. [DOI] [PubMed] [Google Scholar]
- 21.Achhra AC. Amin J. Law MG, et al. Immunodeficiency and the risk of serious clinical endpoints in a well studied cohort of treated HIV-infected patients. AIDS. 2010;24:1877–1886. doi: 10.1097/QAD.0b013e32833b1b26. [DOI] [PMC free article] [PubMed] [Google Scholar]
- 22.Chuang CS. Tung SY. Lee IL, et al. Clinical features and outcome of chronic viral hepatitis with acute exacerbation in patients with concurrent infections of hepatitis B and C virus. Dig Dis Sci. 2008;53:511–516. doi: 10.1007/s10620-007-9891-4. [DOI] [PubMed] [Google Scholar]
- 23.Sagnelli E. Coppola N. Marrocco C, et al. Hepatitis C virus superinfection in hepatitis B virus chronic carriers: A reciprocal viral interaction and a variable clinical course. J Clin Virol. 2006;35:317–320. doi: 10.1016/j.jcv.2005.10.006. [DOI] [PubMed] [Google Scholar]
- 24.Morsica G. Bagaglio S. Cicconi P, et al. Viral interference between hepatitis B, C, and D viruses in dual and triple infections in HIV-positive patients. J Acquir Immune Defic Syndr. 2009;51:574–581. doi: 10.1097/QAI.0b013e3181add592. [DOI] [PubMed] [Google Scholar]
- 25.Chen LS. Yen MF. Wu HM, et al. Predictive survival model with time-dependent prognostic factors: Development of computer-aided SAS Macro program. J Eval Clin Pract. 2005;11:181–193. doi: 10.1111/j.1365-2753.2005.00519.x. [DOI] [PubMed] [Google Scholar]
- 26.Berenguer J. Alvarez-Pellicer J. Martin PM, et al. Sustained virological response to interferon plus ribavirin reduces liver-related complications and mortality in patients coinfected with human immunodeficiency virus and hepatitis C virus. Hepatology. 2009;50:407–413. doi: 10.1002/hep.23020. [DOI] [PubMed] [Google Scholar]
- 27.Veldt BJ. Heathcote EJ. Wedemeyer H, et al. Sustained virologic response and clinical outcomes in patients with chronic hepatitis C and advanced fibrosis. Ann Intern Med. 2007;147:677–684. doi: 10.7326/0003-4819-147-10-200711200-00003. [DOI] [PubMed] [Google Scholar]
- 28.Camma C. Di Bona D. Schepis F, et al. Effect of peginterferon alfa-2a on liver histology in chronic hepatitis C: A meta-analysis of individual patient data. Hepatology. 2004;39:333–342. doi: 10.1002/hep.20073. [DOI] [PubMed] [Google Scholar]
- 29.Poynard T. McHutchison J. Manns M, et al. Impact of pegylated interferon alfa-2b and ribavirin on liver fibrosis in patients with chronic hepatitis C. Gastroenterology. 2002;122:1303–1313. doi: 10.1053/gast.2002.33023. [DOI] [PubMed] [Google Scholar]
- 30.Halfon P. Carrat F. Bedossa P, et al. Effect of antiviral treatment on serum markers of liver fibrosis in HIV-hepatitis C virus-coinfected patients: The Fibrovic 2 Study - ANRS HC02. Antivir Ther. 2009;14:211–219. [PubMed] [Google Scholar]